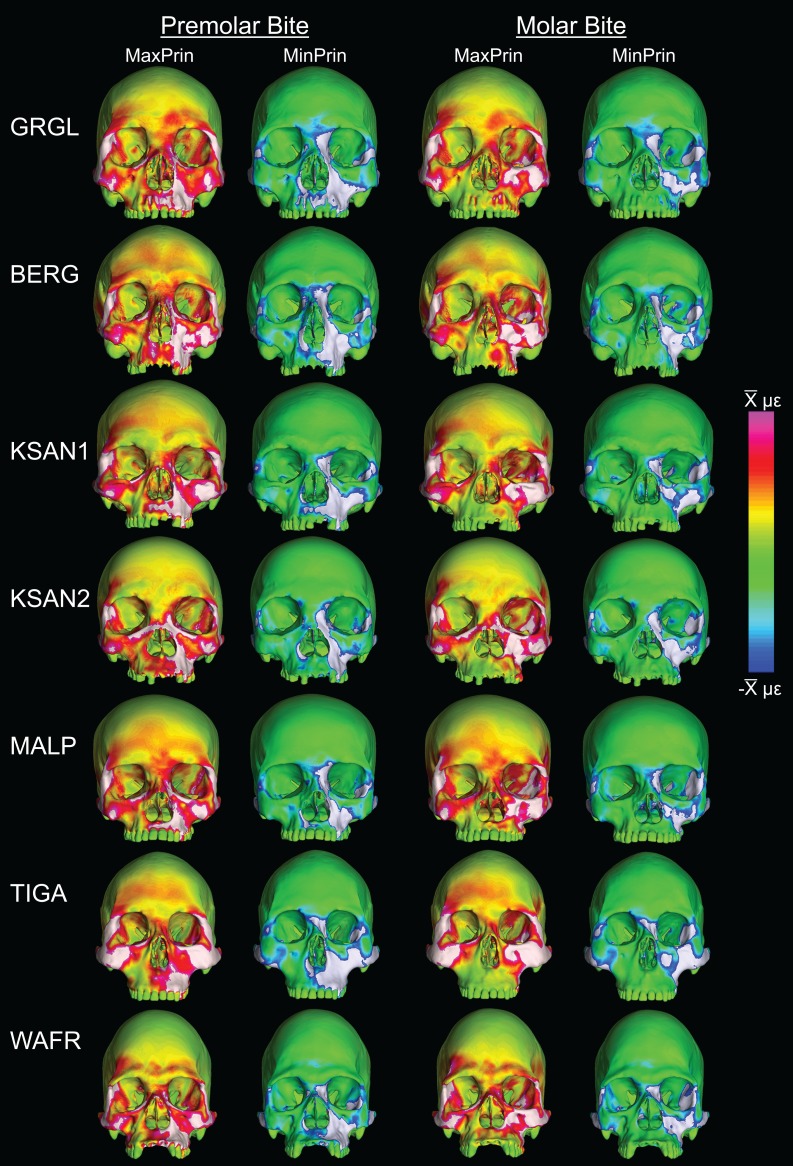
Figure 9. Relative strain distributions.
Color maps of “relative” maximum (MaxPrin) and minimum (MinPrin) principal strains in the CHIMPED model variants during premolar (P3) and molar (M2) biting. The scales range from to , where differs in each image as follows: P3, MaxPrin/MinPrin: GRGL, 612/644; BERG, 500/534; KSAN1, 508/603; KSAN2, 593/724; MALP, 520/610; TIGA, 455/498; WAFR, 672/742; M2, MaxPrin/MinPrin: GRGL, 505/546; BERG, 468/525; KSAN1, 441/473; KSAN2, 505/546; MALP, 433/458; TIGA, 419/420; WAFR, 530/553. White regions exceed scale.

