Abstract
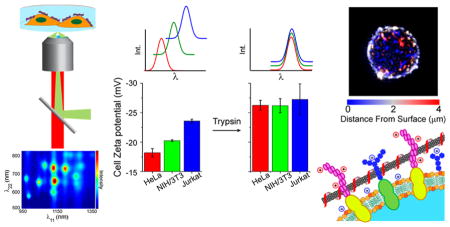
Cell adhesion is a protein-mediated process intrinsic to most living organisms. Dysfunction in cell adhesion processes is implicated in various diseases, including thrombosis and metastatic cancers. Using an approach to resolve spectral features from cell membrane-associated photoluminescent single-walled carbon nanotubes, we found that nanotube optical bandgaps respond to the electrostatic potential of the cell surface, which corresponds to cell adhesion properties. We studied the carbon nanotube emission energy response to solution ionic potentials, which suggests sensitivity to local charge accumulation. We conclude that nanotubes respond to cell surface electrostatic potentials that are mediated by membrane proteins, which vary significantly across cell types. These findings portend the optical measurement of surface electrostatic potentials for biophysical measurements and biomedical applications.
Keywords: nanobiotechnology, fluorescence, optical biophysics, near-infrared sensors, in vivo spectroscopy, live cell measurements
Graphical Abstract
Single-walled carbon nanotubes (SWCNTs) exhibit a unique set of physical,1 electrical,2 and optical properties3 which potentiate them for biological applications. The family of semiconducting nanotubes exhibits exceptionally photostable bandgap photoluminescence at their first Van Hove transitions (E11) in the near-infrared (nIR) spectral region (λ11, 900–1600 nm),4 which can be excited at the E22 resonances (λ22, 500–900 nm).5 Nanotubes are produced as a mixture of species (chiralities), denoted by (n,m) chiral indices. Photoluminescence excitation/emission contour maps (denoted herein as photoluminescence plots) can be constructed to extract spectral properties of emissive nanotube species.6 Nanotube photoluminescence has been employed to detect ions,7 macromolecules,8 and environmental dielectric fluctuations9 by means of either an intensity change, emission wavelength modulation, or both.10,11 Nanotube sensors can detect single analyte molecules, thus facilitating measurements with unprecedented sensitivity.12,13
In order to develop functional optical probes and sensors based on carbon nanotube fluorescence modulation, a thorough characterization of nanotube optical properties is necessary. Studies on immobilized nanotubes using an applied external bias established that increasing cathodic polarization14 or electric field density15 near the nanotube induces a reduction in photon emission energy, corresponding to a shift of the emission band toward longer wavelengths (red-shift). This photophysical mechanism has been described as a type of quantum-confined Stark effect acting on the nanotube charge carriers,16,17 which reduces photon emission energy. An electric potential may be produced in semiconducting nanotubes after photoexcitation,18 and field-strengths from ionic accumulations at surfaces can reach 109 V/m.19
The interactions of photoluminescent carbon nanotubes with living cells and tissues have been investigated.20–24 It is now known that anionic nanotube dispersions (e.g., ssDNA-dispersed SWCNTs) enter cells by means of an energy-dependent endocytic mechanism21,25,26 and exhibit low cytotoxicity.26 However, few studies have focused on the modulation of nanotube emission by natural cellular processes. Although it was noted that nanotube emission undergoes a distinct red-shift upon internalization,20,21 the mechanism is not well understood. In particular, the response of nanotube photoluminescence to interactions with the cell membrane remains unexplored.
Cell adhesion is crucial for many biological processes including embryonic development, immune response, and intercellular signaling.27 Dysfunctions in cell adhesion result in various diseases including thrombosis28 and metastatic cancers.29 Current approaches to accurately quantify cellular adhesion to a substrate, e.g., single-cell force spectroscopy,30 are not amenable to high throughput methods.
Herein, we present an investigation of cell surface proteins by measuring the carbon nanotube optical response to electrostatic potential. Using the experimental approach developed in this work to extract detailed spectroscopic information from nanotubes bound to live cell membranes, we found that changes in exciton emission energy observed via nanotube photoluminescence correspond to cell adhesion properties. We studied the carbon nanotube photon emission energy response to solution ionic potentials, finding that nanotube photon emission energies report local charge accumulation. We report that nanotubes respond to cell surface electrostatic potentials that are mediated by membrane proteins, which vary significantly by cell type.
RESULTS AND DISCUSSION
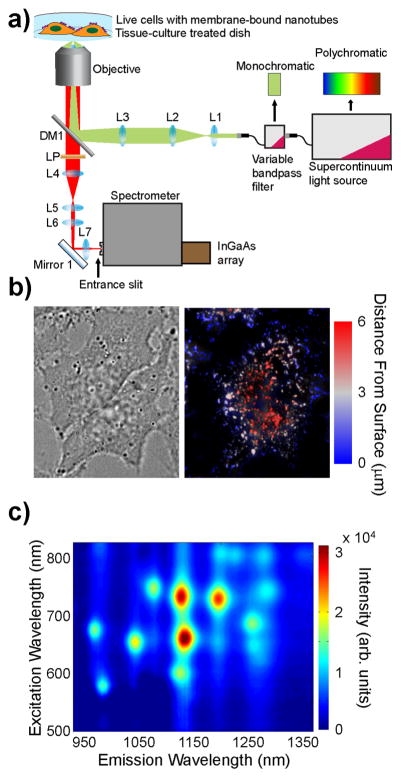
To study nanotube photoluminescence spectra in biological environments, we constructed an instrument to conduct nIR excitation/emission spectroscopy of nanotubes on live eukaryotic cells (Figure 1a). The sample was excited using a supercontinuum laser (NKT SuperK Extreme EXR15) coupled to a variable bandpass filter (NKT SuperK Varia High) to tune the excitation from 500 to 827 nm with a 20 nm bandwidth. The light was injected into an inverted fluorescence microscope through a 50× objective. The resulting nIR emission was collected through the same objective and directed into a spectrometer (Princeton Instruments IsoPlane SCT 320), with a focal length of 320 mm and an aperture ratio of f/4.6, which was coupled to a TE-cooled InGaAs array detector (Princeton Instruments 640 × 512 pixel NIRvana: 640) with a 20 μm pixel size, and a quantum efficiency of >85% in the detection range of 0.9 to 1.7 μm. To conduct excitation/emission spectroscopic measurements, the excitation was varied from 500 to 827 nm in steps of 3 nm. At each excitation wavelength, with exposure time of 0.5–3.0 s, the emission from 930 to 1370 nm was dispersed using a ruled grating with 86 grooves/mm. Corrections for wavelength-dependent variations in excitation power (5–30 mW measured at the sample), as well as grating and detector efficiencies, were applied. (Figures S1–2). We automated the system to illuminate the sample with 109 different excitation bands and collected spectra from carbon nanotubes in solution or in contact with a cell monolayer to produce a full photoluminescence plot in 0.5–5 min.
Figure 1.
Near-infrared photoluminescence spectroscopy of nano-tubes on live cells. (a) Schematic of 2D excitation/emission setup. (b) Transmitted white light and deconvolved broadband nIR height-colored z-axis projection images of live HeLa cells with surface-adsorbed DNA-SWCNTs. The z-axis distance from the substrate (μm) is color-coded from blue to red. (c) Photo-luminescence 2D excitation/emission plot of ss(AT)15-HiPco nanotubes on live HeLa cell membranes.
HiPco nanotubes were suspended with ss(AT)15 DNA oligonucleotides using ultrasonication to form noncovalent DNA-SWCNT complexes. Throughout the study, nanotube complexes were diluted in cell media without serum to negate any confounding interactions between the nanotubes and serum proteins. Absorbance and photoluminescence measurements showed standard E11 and E22 optical transitions (Figure S3). Excitation and emission spectra from each nanotube chirality were fit using Gaussian lineshapes to most accurately identify the peak center wavelengths, λ11 and λ22 (Figure S4, Table S1). Atomic force microscopy was conducted on ss(AT)15-HiPco nanotube complexes adsorbed to a mica surface (Figure S5). The mean length of the nanotube preparation was determined to be 166 ± 6 nm, n = 600 nanotubes, with a standard deviation of 149 nm (Figure S5). This relatively short mean length assured that individual nanotubes would be punctate under diffraction-limited imaging and further reduced the likelihood of nanotube-to-nanotube contact when confined to the cell surface.
Photoluminescence was measured from nanotubes on the surfaces of live cells. HeLa cells were plated at 80% confluence on Petri dishes (Corning cell culture treated polystyrene) approximately 12 h before incubating briefly (<5 min) with nanotube complexes in cell media without serum, followed by thorough washing to remove free nanotubes from solution. The cells were immediately imaged via nIR fluorescence microscopy under 730 nm laser excitation to observe emission between 900 and 1600 nm (see Methods). A deconvolved height-colored z-axis projection image32 revealed that the nanotube emission appeared as punctate nIR emissive regions near the cell membrane but was not observed inside of the cell (Figure 1b, S6). Although nanotubes incubated in complete cell media (including 10% serum) are taken up into cells and exhibit a significant degree of movement internally,26 we found that incubation in serum-free media prevented internalization and exhibited virtually no movement 6 h after introduction of nanotube to the cells (Movie S1, S2).
Near-infrared excitation/emission spectra were collected from nanotubes on the surfaces of HeLa cells (Figure 1c), as well as an adherent murine fibroblast cell line, NIH/3T3, and the suspension human lymphocyte cell line, Jurkat (Figure S7a–c). Excitation and emission peak center wavelength values were measured for each of the 12 nanotube chiralities (Table S2–4).
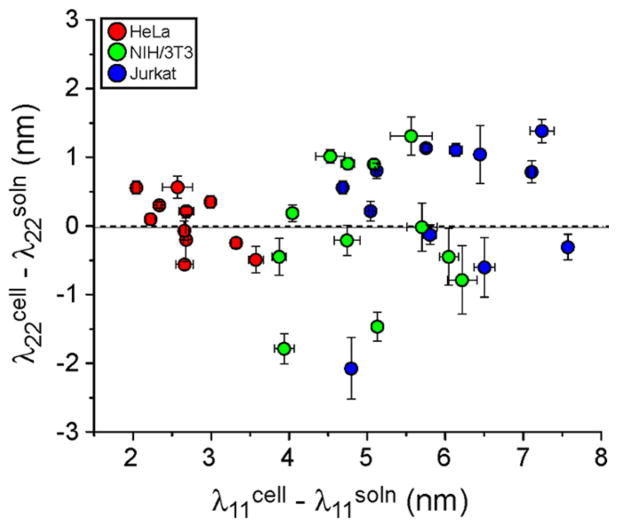
Carbon nanotube emission wavelength modulation exhibited distinct cell line-dependent trends. The change in nanotube emission wavelength between membrane-bound nanotubes and those in solution (serum-free media) were plotted for both λ22 and λ11 transitions (Figure 2, S7a–c, Tables S2–4). The shifts were found to be dependent on the DNA sequence used to suspend the nanotubes, with ss(AT)15-HiPco showing the most consistent response across chiralities (Figure S8). A distinct cell type-dependent trend emerged, as nanotubes exhibited a greater change in λ11, in the direction of longer wavelengths, when in contact with less adherent cells. Jurkat cells induced the largest shift, followed by NIH/3T3, then HeLa cells, with average Δλ11 values of 6.02 ± 0.28, 4.97 ± 0.23, and 2.72 ± 0.12 nm, respectively. The λ22 values exhibited smaller relative changes but followed the same trend, with average Δλ22 values of 0.33 ± 0.28, −0.07 ± 0.28, and 0.05 ± 0.11 nm for HeLa, NIH/3T3, and Jurkat cells, respectively.
Figure 2.
Photoluminescence responses of ss(AT)15-HiPco nanotube complexes to cell membranes. The shifts in peak center wavelengths between nanotube complexes on cell membranes are plotted relative to values from nanotube complexes in solution (cell media without serum, denoted soln). Error bars represent S.E.M., n = 5 technical replicates.
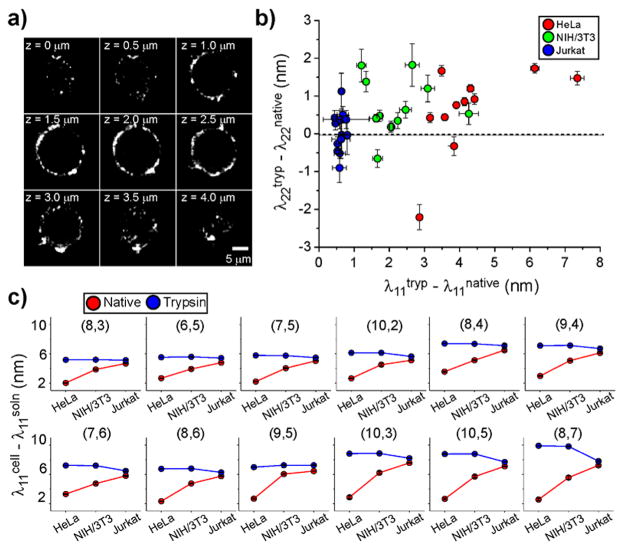
As cell surface proteins, comprising cellular adhesion molecules, receptors, ion channels, etc., are the primary contact surface presented by a cell, we propose that these surface proteins are a major determinant of membrane-bound nanotube optical responses. To test this hypothesis, we performed an experiment in which we introduced recombinant trypsin, an enzyme which functions by cleaving proteins at the c-terminal side of the cationic amino acids arginine or lysine, to remove the extracellular portions of cell surface proteins.31 After introducing trypsin to cells, the enzyme was thoroughly washed away, followed by subsequent incubation of the cells with the nanotube complexes. Residual trypsin in solution did not have a measurable effect on nanotube emission wavelength (Figure S9). Cells were optically sectioned by acquiring images at successive planes through the z-axis,32 and the reconstructed images confirmed that nanotubes were bound to the surfaces of the trypsinized cells (Figure 3a). We then acquired photo-luminescence spectra from nanotubes exposed to trypsin-treated cells (Figure S7d–f) and fit the excitation and emission peaks accordingly (Tables S5–7).
Figure 3.
Cell membrane-bound carbon nanotube emission responses. (a) Optical cross-sections of a deconvolved nIR broadband (900–1600 nm) z-stack of images of ss(AT)15-HiPco nanotubes associated with trypsinized HeLa cell membranes, at different heights from the substrate. (b) The shift in excitation peak center wavelength of nanotubes bound to cell membranes in the trypsinized “tryp” and nontrypsinized “native” states, plotted against the same relative changes in emission wavelength, for three cell types. (c) Shifts in emission peak wavelength (red) of nanotubes bound to cell membranes relative to the emission values recorded from nanotube complexes in solution (cell media without serum, denoted soln). (Blue) Emission peak wavelength shifts upon binding of nanotubes to trypsinized cells. Nanotube chiralities are arranged in order of increasing λ11. Error bars represent S.E.M., n = 3 technical replicates.
We found that the process of removing proteins caused membrane-bound nanotube emission to red-shift toward longer wavelengths (Figure 3b). The change in nanotube signal was most pronounced on HeLa cells, while the signal changed only slightly after trypsinizing Jurkat cells, with average Δλ11 values between trypsinized and native states, [λ11tryp – λ11native], of 4.43 ± 0.39 for HeLa, 2.20 ± 0.25 for NIH/3T3, and 0.59 ± 0.03 nm for Jurkat. The shifts in λ22 values were again significant but smaller, where Δλ22 was 0.63 ± 0.32, 0.69 ± 0.21, and 0.03 ± 0.16 nm for HeLa, NIH/3T3, and Jurkat cells, respectively. Trypsin drastically diminished variations between emission energies of nanotubes on cell membranes consistently across the 12 measured nanotube chiralities (Figure 3c). We therefore conclude that differences in membrane-bound nanotube photon emission energies can be attributed primarily to cell surface proteins.
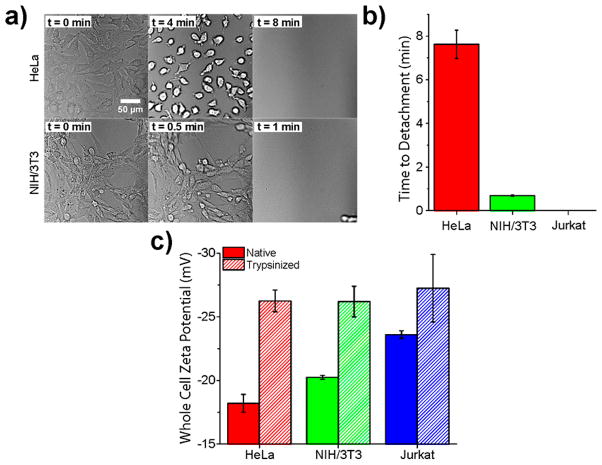
To understand the nanotube emission responses to the cell membrane, we assessed multiple cell surface properties. Adhesiveness of the cell types was quantified by performing a “time to detachment” assay in the presence of trypsin. Cells were plated on tissue culture-treated plastic, media was removed, and the cells were rinsed 3× with PBS. Trypsin was introduced to the cells at time zero while imaging in transmitted light mode. Images were acquired until the point of detachment of all cells from the surface (Figure 4a). We found that NIH/3T3 cells detached ~11× faster than HeLa cells (Figure 4b). Jurkat cells were reported as having zero time to detachment, as they remain in suspension without trypsin. We also assessed the relative expression of cell adhesion molecules on HeLa vs Jurkat cells, using mRNA expression profile data from the Broad-Novartis Cancer Cell Line Encyclopedia (CCLE), to be approximately 4 to 30 fold higher on HeLa cells depending on adhesion molecule type (Figure S10).33
Figure 4.
Quantification of cell surface properties. (a) Transmitted light images from a movie of HeLa or NIH/3T3 cells attached to a tissue-culture dish acquired during trypsinization using a 20× objective. (b) Time required for cell detachment from a plastic tissue-culture treated surface in the presence of trypsin. (c) Whole cell zeta potential (mV) in either native or trypsinized state. Error bars represent S.E.M., n = 3 technical replicates.
As cell surface proteins are less anionic on average than the phospholipid bilayer,34 we hypothesized that charge screening by these proteins mediates the overall cell surface charge. We conducted zeta potential measurements on whole, untrypsinized cells that were removed from the cell culture flask surfaces by scraping (Figure 4c). Zeta potentials of all examined cell lines were negative. The surface charges exhibited a trend in which HeLa cells were the least anionic (−18.2 ± 0.7 mV), followed by NIH/3T3 cells (−20.3 ± 0.2 mV), while Jurkat cell surfaces were the most anionic (−23.6 ± 0.3 mV). Trypsinization of the cells resulted in a systematic decrease in zeta potentials to statistically identical values (−26.3 ± 0.9, −26.2 ± 1.2, and −27.3 ± 2.7 mV, for HeLa, NIH/3T3, and Jurkat cells, respectively).
Both physiological measurements of cell surface proteins, surface adhesion, as well as whole-cell zeta potential, directly correlated with membrane-bound nanotube photon emission energies. HeLa cells, which exhibited the most adhesive character, measured as time to detach in response to trypsin, and the greatest (least negative) zeta potential, also registered the shortest membrane-bound nanotube emission wavelengths (and smallest red-shifts) compared to controls. Jurkat cells, in contrast, exhibited zero time to detachment and the most negative zeta potential. On Jurkat cell membranes, nanotube emission shifted to the longest wavelengths when compared to controls. It is important to note that the surface of most mammalian cells is coated by various types of oligosaccharides collectively known as the glycocalyx.35 Lymphocytes, especially T cells like Jurkat cells, are known to be highly glycosylated with the negatively charged carbohydrate sialic acid.36,37 We believe that the high density of anionic charge, resulting from glycocalyx sugars, may have caused Jurkat cells to induce the largest shift in nanotube emission. Trypsin resulted in all cell lines exhibiting minimal cell adhesion and more negative zeta potential values, while also resulting in the longest membrane-bound nanotube emission wavelengths. We conclude that, in general, the net surface charge, mediated primarily by membrane proteins, induced the observed nanotube photon emission energy differences.
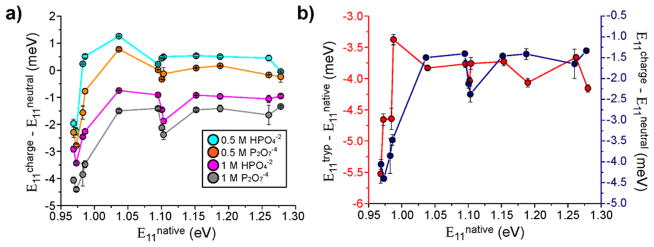
Because cell surface charge correlated with nanotube emission response, we investigated whether increased screening of nanotube charge carriers from anionic charge density (unpublished data, C. Horoszko et al.) would recapitulate the observed spectral responses. We incubated the ss(AT)15-HiPco nanotube complexes with 0.5 or 1 M (pH 8.0) each of sodium phosphate or potassium pyrophosphate in deionized water. A 1 M concentration of anions ensured a greatly reduced Debye length via charge packing of the phosphates near the nanotube surface.38 Using monophosphate, with up to a −2 charge, and pyrophosphate, with up to a −4 charge,39 we exposed the nanotubes to increasing anionic charge density. As the local anionic charge density increased, the nanotube population exhibited a progressive decrease in E11 photon emission energies, corresponding to longer λ11 values (Figure 5a). Similar behavior was observed in the corresponding absorbance spectra, in which nanotube λ11 values red-shifted significantly when highly screened with 1 M phosphate solutions, consistent with a Stark effect16,17 (Figure S11). We observed that the energy loss was almost constant across nanotube chiralities with the exception of small bandgap (large diameter) nanotubes which exhibited an abrupt dip in energy. Interestingly, this distinctive trend also appeared in nanotubes interacting with surfaces of HeLa and NIH/3T3 cells (Figures 5b, S12), though not in Jurkat cells. Nanotubes in contact with Jurkat cells exhibited a small decrease in E11 emission energy (approximately 0.56 ± 0.03 meV) compared to solution controls. We can attribute the observed cell-type dependent nanotube emission responses to differences in the native state charge density on the cell surface.
Figure 5.
Nanotube emission energy response to charge accumulation. (a) ss(AT)15-HiPco nanotubes introduced to 0.5 or 1 M sodium phosphate or potassium pyrophosphate. Nanotube emission energy change (meV) between ionic solutions and deionized water plotted as a function of emission energy (eV). (b) Emission energy change of nanotubes on HeLa cell membranes in a trypsinized state and a native state (red), and emission energy change between 1 M potassium pyrophosphate and deionized water (blue), as a function of nanotube emission energy. Error bars represent S.E.M, n = 3.
We present a simplified schematic to describe this system, in which the microenvironment of a cell membrane perturbs the nanotube photon emission energy (Figure 6). In the native state, the cell surface is populated with charged proteins, glycocalyx carbohydrates, and lipids.27 When a nanotube, with average length of 166 nm is in the vicinity of the cell surface, it likely interacts with many different molecules simultaneously. In such a complex mixture, it is not possible to attribute any single interaction to the observed nanotube emission response. However, upon removal of cell surface proteins with trypsin, we can conclude that any observed differences between the two states arise due the removal of these proteins. Zeta potential measurements suggest that surface proteins conferred less anionic character to the cell surface; nanotube emission energy responded accordingly. The common zeta potential and nanotube emission values across cell types observed after trypsinization further suggest that cell membrane charge densities are homogeneous, likely due to consistent lipid bilayer properties across mammalian cells.27
Figure 6.
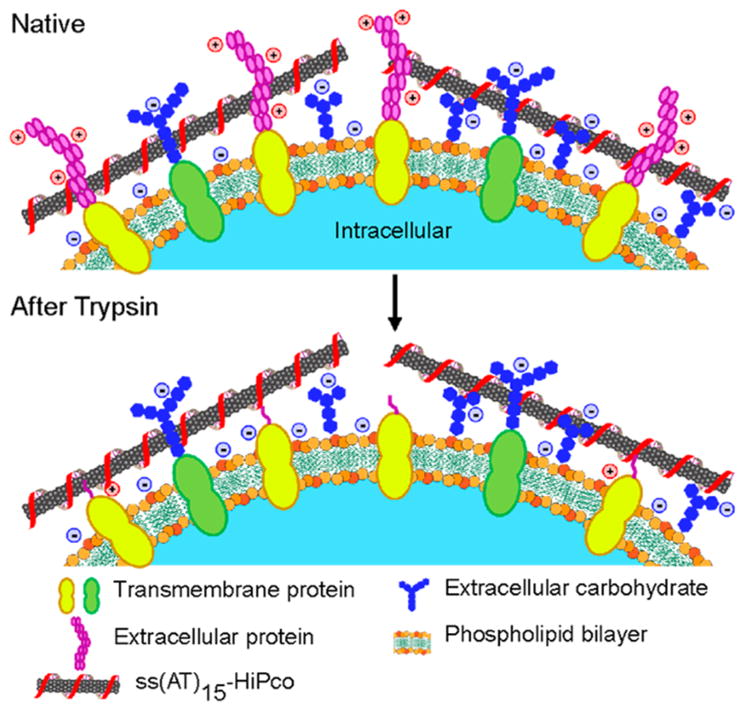
Representative schematic of ss(AT)15-HiPco nanotubes interacting with the cell membrane before and after protein cleavage with trypsin. Figure not drawn to scale.
CONCLUSIONS
In this study, using a custom-built instrument to conduct excitation/emission spectroscopy of carbon nanotubes associated with the membranes of live cells, we found that the nanotube photon emission energy responds to charge accumulation mediated by cell surface proteins. Nanotube photon emission energy correlated with both the degree to which a cell adheres to a substrate, as well as the whole-cell zeta potential. Nanotube optical responses were consistent across most species, potentially allowing the use of simpler spectroscopy instrumentation for future studies. Photoluminescence responses on the cell surface could be recapitulated in vitro by introducing ionic charge into the local environment of the nanotube. We propose a mechanism in which the nanotube photoluminescence is modulated by the charge density on live cell surfaces. This study suggests that nanotube optical bandgap modulation can be mediated by ionic or polyelectrolyte charge accumulation on the nanotube surface. Our findings portend a nanoscale tool for the optical quantification of electrostatic charge accumulation on live cell membranes for biomedical applications.
METHODS
Excitation/Emission Spectroscopy
Lens and mirror properties in Figure 1 schematic: L1–40 mm focal length (FL), L2–400 mm FL, L3–150 mm FL, DM1–875 nm dichroic beam splitter, LP–830 nm long pass edge filter, L4–150 mm FL nIR tube lens, L5–75 mm FL, L6–6o mm FL, Mirror 1–Silver mirror, L7–40 mm FL. All lenses are plano convex.
Nanotube Sample Preparation
HiPco single walled carbon nanotubes (Unidym, HiPco Raw) were suspended with DNA in 1 mL of deionized water with 100 mM NaCl (Sigma-Aldrich) by adding 1 mg raw nanotubes to 2 mg of desalted ss(AT)15 oligonucleotide (Integrated DNA Technologies) in a microcentrifuge tube. The mixture was ultrasonicated using a 1/8″ tapered microtip (Sonics & Materials, Sonics Vibracell) for 30 min at 40% amplitude, with an average power output of 8 W, in a 0 °C temperature-controlled microcentrifuge tube holder. After sonication, the dispersion was ultracentrifuged (Sorvall Discovery 90SE) for 30 min at 250 000g in a fixed-angle rotor (Fiberlite F50L), and the top 80% of the supernatant was extracted. The concentration was determined with a UV/vis/nIR spectrophotometer (Jasco, Tokyo, Japan) using the extinction coefficient A910 = 0.02554 L·mg−1·cm−1.40 To remove free DNA, 100 kDa Amicon centrifuge filters (Millipore) were used. For excitation/emission spectroscopy and cell incubation experiments, the resuspended samples were diluted to 5 mg/L concentration in cell media without serum.
Atomic Force Microscopy
A stock solution of ss(AT)15–HiPco nanotubes at 20 mg/L in 100 mM NaCl was diluted 20× in dH2O and plated on a freshly cleaved mica substrate (SPI) for 4 min before washing with 10 mL of dH2O and blowing dry with argon gas. An Olympus AC240TS AFM probe (Asylum Research) in an Asylum Research MFP-3D-Bio instrument was used to image in AC mode. Data was captured at 2.93 nm/pixel XY resolution and 15.63 pm Z resolution.
Cell Lines and Cell Culture Procedures
HeLa CCL-2 cells and NIH/3T3 cells (ATCC, Manassas, VA) were grown under standard incubation conditions at 37 °C and 5% CO2 in sterile-filtered DMEM with 10% heat-inactivated FBS, 2.5% HEPES, 1% Glutamine, and 1% Penicillin/Streptomycin (all Gibco). Jurkat cells were grown under the same conditions described above using RPMI 1640 complete medium instead of DMEM. Cells were plated onto T-75 flasks at 20% confluence and passaged every 3 days. For live and fixed-cell imaging experiments, cells were plated onto cell culture treated polystyrene Petri dishes (Corning).
Incubation of Cells with Nanotubes
For adherent cell lines (HeLa and NIH/3T3), nanotubes were introduced to a monolayer of cells at a concentration of 5 mg/L for 5 min in cell media without serum. After this time, they were washed 3× with PBS (Gibco), and placed in fresh cellular media without serum for data acquisition. In the case of the suspension cell line, Jurkat, 5 mg/L nanotubes were added to a microcentrifuge tube containing 106 cells. The solution was gently shaken for 5 min, followed by 2 min of centrifugation at 3000g. The cells were resuspended with a pipet tip in cell media without serum, and then centrifuged again. This process was repeated 3× in order to remove all unbound nanotubes from the solution. A volume of 100 uL in a 96-well plate (Corning) was used for excitation/ emission spectroscopy.
For trypsinization experiments, 106 cells were incubated with TrypLE cell-dissociation reagent (Life technologies), a recombinant porcine trypsin alternative, for 15 min to ensure all cells were detached from the substrate. The suspension was centrifuged at 3000g for 2 min, followed by resuspension with a pipet. This process was repeated 3× in order to remove the remaining enzyme. The cells were then incubated with nanotubes at 5 mg/L and washed in a similar fashion as the Jurkat procedure mentioned above.
Zeta Potential Measurements
HeLa or NIH/3T3 cells were detached from the plastic culture plates by scraping with a rubber cell scraper. Suspension Jurkat cells were used as is. Suspensions of 105 cells/mL in Ca2+/Mg2+ free PBS were placed in a 1 mL folded capillary cell (Malvern) and measured using a Zetasizer (Malvern, Nano-ZS).
nIR Imaging in Live Cells
As described in a previous study,40 a continuous wave (CW) 730 nm diode laser with a sample power of 230 mW was used for photoluminescence imaging experiments. To ensure a homogeneous illumination over the entire microscope field of view, the excitation beam was passed through a custom beam shaping module to produce a top hat intensity profile within 20% variation on the surface of the sample under test. A long-pass dichroic mirror with a cut-on wavelength of 880 nm was aligned to reflect the laser into an Olympus IX-71 inverted microscope equipped with a 100× (UAPON100XOTIRF, NA = 1.49) oil objective (Olympus, USA). Images were collected with a 2D nIR detector (InGaAs sensor array) operational between 900 and 1600 nm and with a quantum efficiency greater than 70% over the entire range was used.
Supplementary Material
Acknowledgments
This work was supported in part by the NIH New Innovator Award (DP2-HD075698), the Honorable Tina Brozman Foundation for Ovarian Cancer Research, the Louis V. Gerstner Jr. Young Investigator’s Fund, the Frank A. Howard Scholars Program, Cycle for Survival, the Alan and Sandra Gerry Metastasis Research Initiative, the MSKCC Center for Molecular Imaging and Nanotechnology, Mr. William H. Goodwin and Mrs. Alice Goodwin and the Commonwealth Foundation for Cancer Research, The Experimental Therapeutics Center of Memorial Sloan-Kettering Cancer Center, and the NIH/NCI Cancer Center Support Grant P30 CA008748. DR was supported by an American Cancer Society 2013 Roaring Fork Valley Research Fellowship. Y.S. was supported by the MSKCC Center for Metastasis Research Scholars Fellowship Program. The authors thank J. Harvey, T. Galassi, J. Budhathoki-Uprety, and R. Williams for helpful discussions.
Footnotes
Notes
The authors declare no competing financial interest.
The Supporting Information is available free of charge on the ACS Publications website at DOI: 10.1021/acsnano.5b05438.
Data used to calibrate the instrument, as well as additional fit parameters from photoluminescence plots of ss(AT)15HiPco nanotubes are presented. (PDF)
Movie S1 (AVI).
Movie S2 (AVI).
References
- 1.Saito R, Dresselhaus G, Dresselhaus MS. Physical Properties of Carbon Nanotubes. Vol. 4 World Scientific; 1998. [Google Scholar]
- 2.Ebbesen TW, Lezec HJ, Hiura H, Bennett JW, Ghaemi HF, Thio T. Electrical Conductivity of Individual Carbon Nanotubes. Nature. 1996;382:54–56. [Google Scholar]
- 3.Lefebvre J, Homma Y, Finnie P. Bright Band Gap Photoluminescence from Unprocessed Single-walled Carbon Nanotubes. Phys Rev Lett. 2003;90:217401–217401. doi: 10.1103/PhysRevLett.90.217401. [DOI] [PubMed] [Google Scholar]
- 4.O’Connell MJ, Bachilo SM, Huffman CB, Moore VC, Strano MS, Haroz EH, Rialon KL, Boul PJ, Noon WH, Kittrell C, et al. Band Gap Fluorescence from Individual Single-Walled Carbon Nanotubes. Science. 2002;297:593–596. doi: 10.1126/science.1072631. [DOI] [PubMed] [Google Scholar]
- 5.Boghossian AA, Zhang J, Barone PW, Reuel NF, Kim JH, Heller DA, Ahn JH, Hilmer AJ, Rwei A, Arkalgud JR. Near-Infrared Fluorescent Sensors based on Single-Walled Carbon Nanotubes for Life Sciences Applications. ChemSusChem. 2011;4:848–863. doi: 10.1002/cssc.201100070. [DOI] [PubMed] [Google Scholar]
- 6.Bachilo SM, Strano MS, Kittrell C, Hauge RH, Smalley RE, Weisman RB. Structure-Assigned Optical Spectra of Single-Walled Carbon Nanotubes. Science. 2002;298:2361–2366. doi: 10.1126/science.1078727. [DOI] [PubMed] [Google Scholar]
- 7.Heller DA, Jeng ES, Yeung TK, Martinez BM, Moll AE, Gastala JB, Strano MS. Optical Detection of DNA Conformational Polymorphism on Single-Walled Carbon Nanotubes. Science. 2006;311:508–511. doi: 10.1126/science.1120792. [DOI] [PubMed] [Google Scholar]
- 8.Ahn JH, Kim JH, Reuel NF, Barone PW, Boghossian AA, Zhang J, Yoon H, Chang AC, Hilmer AJ, Strano MS. Label-Free, Single Protein Detection on a Near-Infrared Fluorescent Single-Walled Carbon Nanotube/Protein Microarray Fabricated by Cell-Free Synthesis. Nano Lett. 2011;11:2743–2752. doi: 10.1021/nl201033d. [DOI] [PubMed] [Google Scholar]
- 9.Heller DA, Pratt GW, Zhang J, Nair N, Hansborough AJ, Boghossian AA, Reuel NF, Barone PW, Strano MS. Peptide Secondary Structure Modulates Single-Walled Carbon Nanotube Fluorescence as a Chaperone Sensor for Nitroaromatics. Proc Natl Acad Sci U S A. 2011;108:8544–8549. doi: 10.1073/pnas.1005512108. [DOI] [PMC free article] [PubMed] [Google Scholar]
- 10.Choi JH, Strano MS. Solvatochromism in Single-Walled Carbon Nanotubes. Appl Phys Lett. 2007;90:223114. [Google Scholar]
- 11.Larsen BA, Deria P, Holt JM, Stanton IN, Heben MJ, Therien MJ, Blackburn JL. Effect of Solvent Polarity and Electrophilicity on Quantum Yields and Solvatochromic Shifts of Single-Walled Carbon Nanotube Photoluminescence. J Am Chem Soc. 2012;134:12485–12491. doi: 10.1021/ja2114618. [DOI] [PubMed] [Google Scholar]
- 12.Cognet L, Tsyboulski DA, Rocha JDR, Doyle CD, Tour JM, Weisman RB. Stepwise Quenching of Exciton Fluorescence in Carbon Nanotubes by Single-Molecule Reactions. Science. 2007;316:1465–1468. doi: 10.1126/science.1141316. [DOI] [PubMed] [Google Scholar]
- 13.Jin H, Heller DA, Kim JH, Strano MS. Stochastic Analysis of Stepwise Fluorescence Quenching Reactions on Single-Walled Carbon Nanotubes: Single Molecule Sensors. Nano Lett. 2008;8:4299–4304. doi: 10.1021/nl802010z. [DOI] [PubMed] [Google Scholar]
- 14.Schäfer S, Cogan NMB, Krauss TD. Spectroscopic Investigation of Electrochemically Charged Individual (6,5) Single-Walled Carbon Nanotubes. Nano Lett. 2014;14:3138–3144. doi: 10.1021/nl5003729. [DOI] [PubMed] [Google Scholar]
- 15.Mohite AD, Gopinath P, Shah HM, Alphenaar BW. Exciton Dissociation and Stark Effect in the Carbon Nanotube Photocurrent Spectrum. Nano Lett. 2008;8:142–146. doi: 10.1021/nl0722525. [DOI] [PubMed] [Google Scholar]
- 16.Freitag M, Steiner M, Naumov A, Small JP, Bol AA, Perebeinos V, Avouris P. Carbon Nanotube Photo- and Electro-luminescence in Longitudinal Electric Fields. ACS Nano. 2009;3:3744–3748. doi: 10.1021/nn900962f. [DOI] [PubMed] [Google Scholar]
- 17.Steiner M, Freitag M, Perebeinos V, Naumov A, Small JP, Bol AA, Avouris P. Gate-Variable Light Absorption and Emission in a Semiconducting Carbon Nanotube. Nano Lett. 2009;9:3477–3481. doi: 10.1021/nl9016804. [DOI] [PubMed] [Google Scholar]
- 18.Barkelid M, Zwiller V. Photocurrent Generation in Semiconducting and Metallic carbon nanotubes. Nat Photonics. 2014;8:47–51. [Google Scholar]
- 19.Bard A, Faulkner LR. Electrochemical Methods. Fundamentals and Applications. 2. John Wiley & Sons, Inc; 2001. [Google Scholar]
- 20.Cherukuri P, Bachilo SM, Litovsky SH, Weisman RB. Near-Infrared Fluorescence Microscopy of Single-Walled Carbon Nanotubes in Phagocytic Cells. J Am Chem Soc. 2004;126:15638–15639. doi: 10.1021/ja0466311. [DOI] [PubMed] [Google Scholar]
- 21.Heller DA, Baik S, Eurell TE, Strano MS. Single-Walled Carbon Nanotube Spectroscopy in Live Cells: Towards Long-Term Labels and Optical Sensors. Adv Mater. 2005;17:2793–2799. [Google Scholar]
- 22.Jin H, Heller DA, Sharma R, Strano MS. Size-Dependent Cellular Uptake and Expulsion of Single-Walled Carbon Nanotubes: Single Particle Tracking and a Generic Uptake Model for Nanoparticles. ACS Nano. 2009;3:149–158. doi: 10.1021/nn800532m. [DOI] [PubMed] [Google Scholar]
- 23.Hong G, Wu JZ, Robinson JT, Wang H, Zhang B, Dai H. Three-Dimensional Imaging of Single Nanotube Molecule Endocytosis on Plasmonic Substrates. Nat Commun. 2012;3:700. doi: 10.1038/ncomms1698. [DOI] [PubMed] [Google Scholar]
- 24.Holt BD, Dahl KN, Islam MF. Differential Sub-Cellular Processing of Single-Wall Carbon Nanotubes via Interfacial Modifications. J Mater Chem B. 2015;3:6274–6284. doi: 10.1039/c5tb00705d. [DOI] [PubMed] [Google Scholar]
- 25.Jin H, Heller DA, Strano MS. Single-Particle Tracking of Endocytosis and Exocytosis of Single-Walled Carbon Nanotubes in NIH-3T3 Cells. Nano Lett. 2008;8:1577–1585. doi: 10.1021/nl072969s. [DOI] [PubMed] [Google Scholar]
- 26.Bhattacharya S, Roxbury D, Gong X, Mukhopadhyay D, Jagota A. DNA Conjugated SWCNTs Enter Endothelial Cells via Rac1Mediated Macropinocytosis. Nano Lett. 2012;12:1826–1830. doi: 10.1021/nl204058u. [DOI] [PMC free article] [PubMed] [Google Scholar]
- 27.Lodish H. Mol Cell Biol. W. H. Freeman; 2008. [Google Scholar]
- 28.Wagner DD, Burger PC. Platelets in Inflammation and Thrombosis. Arterioscler, Thromb, Vasc Biol. 2003;23:2131–2137. doi: 10.1161/01.ATV.0000095974.95122.EC. [DOI] [PubMed] [Google Scholar]
- 29.Hanahan D, Weinberg RA. The Hallmarks of Cancer. Cell. 2000;100:57–70. doi: 10.1016/s0092-8674(00)81683-9. [DOI] [PubMed] [Google Scholar]
- 30.Friedrichs J, Helenius J, Muller DJ. Quantifying Cellular Adhesion to Extracellular Matrix Components by Single-Cell Force Spectroscopy. Nat Protoc. 2010;5:1353–1361. doi: 10.1038/nprot.2010.89. [DOI] [PubMed] [Google Scholar]
- 31.Walsh K. Trypsinogens and Trypsins of Various Species. Methods Enzymol. 1970;19:41–63. [Google Scholar]
- 32.Jena PV, Shamay Y, Shah J, Roxbury D, Paknejad N, Heller DA. Photoluminescent Carbon Nanotubes Interrogate the Permeability of Multicellular Tumor Spheroids. Carbon. 2016;97:99–109. doi: 10.1016/j.carbon.2015.08.024. [DOI] [PMC free article] [PubMed] [Google Scholar]
- 33.Barretina J, Caponigro G, Stransky N, Venkatesan K, Margolin AA, Kim S, Wilson CJ, Lehar J, Kryukov GV, Sonkin D, et al. The Cancer Cell Line Encyclopedia Enables Predictive Modelling of Anticancer Drug Sensitivity. Nature. 2012;483:603–307. doi: 10.1038/nature11003. [DOI] [PMC free article] [PubMed] [Google Scholar]
- 34.Alberts B, Johnson A, Lewis J. Mol Biol Cell. 4. Garland Science; New York: 2002. Cell–Cell Adhesion. [Google Scholar]
- 35.Sabri S, Soler M, Foa C, Pierres A, Benoliel A, Bongrand P. Glycocalyx Modulation is a Physiological Means of Regulating Cell Adhesion. J Cell Sci. 2000;113:1589–1600. doi: 10.1242/jcs.113.9.1589. [DOI] [PubMed] [Google Scholar]
- 36.Daniels MA, Hogquist KA, Jameson SC. Sweet ‘n’sour: The Impact of Differential Glycosylation on T CellResponses. Nat Immunol. 2002;3:903–910. doi: 10.1038/ni1002-903. [DOI] [PubMed] [Google Scholar]
- 37.Bi S, Baum LG. Sialic Acids in T Cell Development and Function. Biochim Biophys Acta, Gen Subj. 2009;1790:1599–1610. doi: 10.1016/j.bbagen.2009.07.027. [DOI] [PubMed] [Google Scholar]
- 38.Adamson AW, Gast AP. Physical Chemistry of Surfaces. Wiley; 1997. [Google Scholar]
- 39.Perrin DD. Ionisation Constants of Inorganic Acids and Bases in Aqueous Solution. Vol. 29 Elsevier; 2013. [Google Scholar]
- 40.Roxbury D, Jena PV, Williams RM, Enyedi B, Niethammer P, Marcet S, Verhaegen M, Blais-Ouellette S, Heller DA. Hyperspectral Microscopy of Near-Infrared Fluorescence Enables 17-Chirality Carbon Nanotube Imaging. Sci Rep. 2015;5:14167. doi: 10.1038/srep14167. [DOI] [PMC free article] [PubMed] [Google Scholar]
Associated Data
This section collects any data citations, data availability statements, or supplementary materials included in this article.


