

Abstract
MAP1LC3B (LC3) is a key component of the autophagy pathway, contributing to both cargo selection and autophagosome formation in the cytoplasm. Emerging evidence suggests nuclear forms of LC3 are also functionally important; however, the mechanisms that facilitate the nuclear targeting and trafficking of LC3 between the nucleus and cytoplasm under steady state conditions are poorly understood. In the current study, we examine how residues known to regulate the interactions between LC3 and other proteins or RNA (F52 L53, R68-R70, and G120) contribute to its nuclear targeting, nucleocytoplasmic transport, and association with nucleoli and other nuclear components. We find that residues F52 L53 and R68-70, but not G120, regulate targeting of LC3 to the nucleus, its rates of nucleocytoplasmic transport, and the apparent sizes of LC3-associated complexes in the nucleus inferred from FRAP measurements. We also show that LC3 is enriched in nucleoli and its triple arginine motif is especially important for nucleolar targeting. Finally, we identify a series of candidate nuclear LC3-interacting proteins using mass spectrometry, including MAP1B, tubulin, and several 40S ribosomal proteins. These findings suggest LC3 is retained in the nucleus in association with high molecular weight complexes that continuously scan the nucleolus.
Keywords: autophagy, MAP1LC3, nucleus, FRAP, nucleo-cytoplasmic transport, diffusion, mass spectrometry, MudPIT
Graphical Abstract
INTRODUCTION
Microtubule associated protein 1 light chain 3 (LC3), a ubiquitin-like protein that participates in autophagosome formation and autophagy cargo selection in the cytoplasm, is one of the most widely utilized markers of autophagy (1, 2). LC3, however, has been detected in the nucleus in multiple studies (3–10), and several lines of evidence indicate that LC3’s trafficking into and out of the nucleus is a regulated event, and that the functions of nuclear LC3 are highly important. But how LC3 is trafficked to the nucleus under steady-state conditions, and the nature of nuclear LC3’s interactions with nuclear components and subnuclear bodies (e.g. the nucleolus) is incompletely understood.
LC3 is a member of the ATG8 protein family, which consists of several homologues: LC3 isoforms A, B, B2, and C, GABARAP, GABARAPL1, and GATE 16 (1, 2). In the context of autophagy, LC3B (hereafter referred to as LC3) is the best-studied ATG8 family member. A 94 % sequence identity is shared between rat Map1lc3 and human MAP1LC3B (11). LC3 is both soluble (LC3-I), and membrane-associated after conjugation to the lipid phosphatidylethanolamine (LC3-II) (12). LC3 cycles between its soluble and lipid modified forms with the help of ubiquitin-like activation, conjugation, and ligation enzymes, ATG7 along with cysteine protease, ATG4B (13).
Work over the past year indicates that nuclear LC3 interacts with the Promyelocytic leukemia (PML) protein (8) and components of the ERK pathway (5). In addition, in response to starvation, Huang et al. demonstrated that nuclear LC3 is deacetylated and subsequently actively trafficked out of the nucleus into the cytoplasm by virtue of its association with TP53INP2/DOR (9). Remarkably, the nuclear-derived pool of LC3 appears to be the major source of autophagosome-targeted LC3 in starved cells (9). Very recently, Dou et al. showed that LC3 interacts directly with lamin B1, associates with transcriptionally inactive heterochromatin domains known as lamin-associated domains, and participates in degradation of nuclear lamina in response to oncogenic insults (14).
In principle, LC3 is small enough to passively cross the nuclear envelope, even when tagged with GFP. We and others, however, have shown that GFP-LC3 is modestly enriched in the nucleus relative to the cytoplasm, suggesting it is either selectively targeted to or retained within this compartment as part of a complex that is too large to cross the nuclear envelope by passive diffusion (4, 9). LC3 lacks a consensus nuclear localization sequence, and it contains a sequence with some similarity to nuclear export signals (NES), but inhibition of active nuclear export with leptomycin B has no effect on the nucleocytoplasmic distribution of LC3 (4), possibly because this region of the protein is buried in the crystal structure (15). Nevertheless, we found that GFP-LC3 shuttles between the cytoplasm and nucleus, and diffuses more slowly than predicted for a monomer in both the cytoplasm and nucleus suggesting that both cytoplasmic and nuclear LC3 may associate with larger complexes (4).
To better understand the nature of autophagosome independent (LC3-I) LC3-associated complexes in the cytoplasm, we developed a combination of biophysical approaches to characterize LC3 complex formation in living cells (16), and we used these approaches to determine LC3’s size, stoichiometry and organization in live cells and in cytoplasmic extracts (17). We found that a single soluble (LC3-I) Venus-LC3 molecule associates with a ~500 kDa complex, and that the sizes of LC3-associated complexes are altered by mutation of residues that are known to be involved in binding to other proteins and RNA (F52 L53 and R70) (17). In contrast, disruption of G120, a residue required for lipidation of LC3 (LC3-II) (18), had little effect on the size of the complexes (17). Our findings ruled out the possibility that the slow diffusion of cytoplasmic LC3 is a result of its association with autophagic vesicles, and also suggests it is not the result of interactions with protein machinery responsible for lipidation (17).
The current paper aims to extend our previous work by determining if residues on LC3 that are important for binding of LC3 to other proteins or RNA, or for LC3’s lipidation regulate (i) LC3’s nuclear localization, (ii) LC3’s trafficking into and out of the nucleus, (iii) LC3’s association with large complexes in the nucleus, and (iv) LC3’s association with nuclear bodies (e.g. the nucleolus) and other components of the nucleus. To address these questions, we employed quantitative live cell fluorescence microscopy methods and biophysical methods to measure diffusion coefficients and transport kinetics under nutrient-rich conditions and after starvation. In addition, protein complexes from subcellular fractions were immunoprecipitated followed by shotgun proteomics-Multidimensional Protein Identification Technology (MudPIT) mass spectrometry (19, 20) to identify prospective nuclear LC3 interacting proteins. We observed that LC3’s triple arginine motif regulates nuclear LC3’s association with high molecular weight complexes that continuously scan the nucleolus, and identified MAP1B, tubulin, and ribosomal subunit proteins as possible LC3 interacting partners in the nucleus.
RESULTS
LC3’s triple arginine motif and hydrophobic binding interface, but not its lipidation site contributes to the enrichment of LC3 in the nucleus
To study the mechanisms that target LC3 to the nucleus, we transiently expressed Venus-tagged versions of LC3 in HeLa cells. We examined several mutants of LC3 to determine regions of the protein that contribute to its nuclear localization. The positions of these residues in the context of the sequence and three dimensional structure of LC3 are shown in Figure 1. These included LC3 residues F52, L53, and R68-R70, which are involved in binding to many different LC3 interacting proteins (21, 22). Residues F52 and L53 make up part of a hydrophobic binding interface on LC3’s surface that regulates interactions with proteins containing an LC3 interacting region motif (LIR) with the consensus sequence: W/Y/F-X-X-L/I/V (23–25). LC3 residue R70 also forms part of a triple arginine motif (R68-70) on a surface exposed alpha helix that interacts with RNA, and regulates fibronectin mRNA translation (Figure 1B) (26, 27), whereas R68 is important for proper C-terminal cleavage of Atg8 family members (28). Given these reported roles of residues R68-70, we generated an R68-70A mutant of LC3 for the current study. We verified in control experiments that Venus-LC3 R68-R70 fails to accumulate on autophagosomes in chloroquine treated cells (Supplementary Figure 1A). We also examined a G120A mutant of LC3, which is unable to undergo lipid modification (18). In whole cell extracts of transiently transfected cells, Venus-LC3 and Venus- LC3 R70A were present predominantly as LC3-II, Venus-LC3 G120A existed exclusively as LC3-I, and Venus-LC3 R6870A was present as an approximately 50:50 mixture of LC3-I and LC3-II (Supplementary Figure 1B).
Figure 1. Models highlighting the regions of LC3 studied in this work.
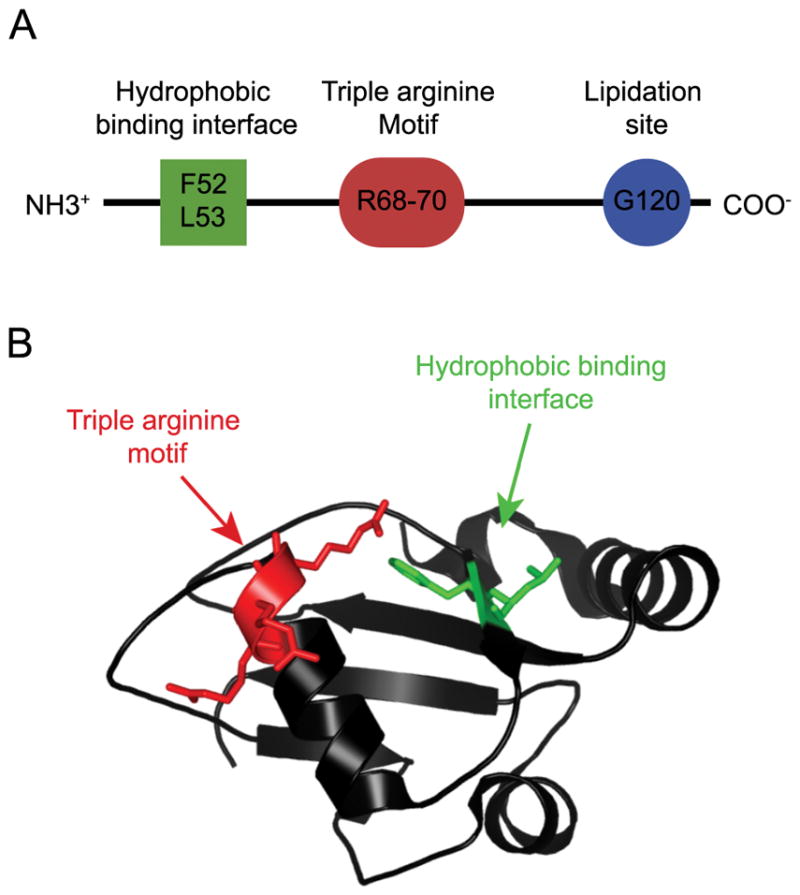
(A) Schematic depiction of the regions of LC3 investigated in this study. (B) LC3 structure, PDB: 1UGM. The backbone is represented as a black ribbon. (Green) Residues F52 and L53—LC3’s hydrophobic binding interface—are important for interactions with proteins containing an LIR motif. (Red) Residues R68-70—LC3’s triple arginine motif—interact with RNA, and are also important for interactions with other proteins in the autophagy pathway.
To analyze the nucleocytoplasmic distribution of LC3 and its mutants, we compared its localization to that of Cerulean—a protein that equilibrates freely between the nucleus and cytoplasm as the result of passive diffusion across nuclear pores (29). Cells were co-transfected with Venus-tagged forms of LC3 and Cerulean, and just prior to imaging were labeled with a nuclear marker, DRAQ5, enabling us to quantify the nucleocytoplasmic ratio (N/C) using an automated image processing routine (Figure 2A). For this analysis, we only included the soluble pools of LC3, excluding puncta-associated protein. Because LC3 was fused to Venus for these studies, an empty Venus construct was chosen as a negative control for these studies. To our knowledge, like Cerulean, Venus does not contain any nuclear targeting information or bind to specific nuclear or cytoplasmic components, and is also small enough to passively cross nuclear pores. Thus, it should be representative of the distribution of a protein that passively equilibrates between the nucleus and cytoplasm.
Figure 2. LC3’s nucleocytoplasmic distribution is reduced by disrupting its hydrophobic binding interface or triple arginine motif.

(A) To analyze the nucleocytoplasmic distribution of LC3, live HeLa cells expressing Venus-LC3 or the indicated LC3 mutants, were co-transfected with Cerulean and labeled with DRAQ5 to facilitate image analysis. An automated image analysis routine was used to quantify the nucleocytoplasmic distribution of Venus-LC3 by creating masks for cytoplasm (green) using the Cerulean channel, nucleus (blue) using the DRAQ5 channel, and puncta (red) using the Venus channel. (B) Confocal images of Venus-LC3 and the indicated Venus-LC3 mutants under basal conditions. Empty Venus was included as a negative control. Scale bar, 10 μm. (C) Quantification of the N/C ratio for indicated constructs under basal conditions. Light gray bars show the values for the Venus-tagged constructs and the dark gray bars are for Cerulean in the same cells. Error bars are 95% confidence intervals. N = 80 cells for LC3; 50 for F52A L53A, G120A, and R70A; 40 for R68-70A, and 70 for Venus. One way ANOVA p<1×10⁻⁴. Bonferonni corrected t-tests for the N/C ratio of each construct compared to Venus-LC3. ns p>0.05; * p≤0.05; ** p≤0.01; *** p≤0.001. (D) As in B, except cells were subjected to EBSS treatment for 1 h prior to imaging. (E) As in C except quantification of N/C ratio was performed in EBSS-treated cells.
All of the LC3 constructs were localized to both the cytoplasm and nucleus under basal conditions; however, they were enriched in the nucleus to varying degrees (Figure 2B,C). Consistent with our previous report (4), we found that Venus-LC3 was enriched in the nucleus relative to the cytoplasm with a N/C ratio of 2.3 ± 0.5, which was ~20% higher than the Venus control (t-test, p<0.005 N=70). The G120A mutant had an N/C ratio that was indistinguishable from that of wild-type LC3 (t-test, p>0.005 N=50). This suggests that LC3’s lipid modification does not play a role in targeting to the nucleus under basal conditions, in agreement with our previous findings (4), as well as a recent report (9). In contrast, the F52A L53A, R70A, and R68-70A mutants all showed modest, but significant decreases in their N/C ratios compared to wild type Venus-LC3 (t-test, p<0.005, N=50 cells per construct). These results demonstrate that LC3’s nucleocytoplasmic distribution, in general, is regulated by its interactions with proteins and/or RNA mediated by residues F52 L53, and R68-70, but does not depend on its ability to undergo lipid modification under basal conditions. Furthermore, similar N/C values were observed when cells were treated with leptomycin B for 2 h, demonstrating that neither wild type LC3 nor its mutants undergo active nuclear export over this timeframe (Supplementary Figure 2). In contrast, when cells were subjected to amino acid starvation prior to imaging, soluble Venus-LC3 shifted out of the nucleus into the cytoplasm, equilibrating to a level similar to that of free Venus (Figure 2D, E). Interestingly, most of the Venus-LC3 mutants (G120A, F52A/L53A, and triple arginine mutants) showed a similar shift in their N/C ratios (Figure 2D, E), while Venus R70A had an N/C ratio that was statistically even lower than that of Venus-LC3 (p<0.005, t-test). Thus, the interactions mediated by these residues are not required for LC3 to exit the nucleus in response to starvation.
Wild type LC3 and LC3 mutants have indistinguishable basal nucleocytoplasmic transport rate constants
Transport of small proteins can occur via passive diffusion through nuclear pores, but the rate at which a protein passes through the pores by this mechanism is very sensitive to its hydrodynamic radius (29–32). In particular, molecules with hydrodynamic radii larger than about 5 nm are unable to passively diffuse across nuclear pores (30, 31). We previously showed that GFP-LC3 cycles between the nucleus and cytoplasm under steady state conditions, but does so more slowly than empty GFP (4). We speculated that the nuclear enrichment and slow basal nucleocytoplasmic shuttling of LC3 may be regulated by binding of the protein to larger complexes within the cytoplasm and/or nucleus (4). We, therefore, next tested whether disruption of residues known to be important for binding of LC3 to other proteins or RNA influenced the rate of nucleocytoplasmic transport.
To test this idea, we measured the rate of transport of LC3 between the nucleus and cytoplasm by performing selective photobleaching of the nuclear pool of the protein under steady state conditions (Figure 3). For these experiments, Venus-tagged forms of wild type LC3 or its mutants were co-expressed with Cerulean as an internal control in HeLa cells. The entire nucleus was photobleached, and the recovery of fluorescence in the nucleus was monitored over time (Figure 3A). The data was well fit by a two component exponential model (Equation 2). The fast component was consistent with intra-compartmental diffusion, while the slow component was consistent with nucleocytoplasmic exchange (see Table 1 for a summary of the best-fit parameters). As a control, we measured the nucleocytoplasmic transport rate of Venus, and found that it recovered with a rate of 8 ± 3 × 10⁻³ s−1, consistent with previous measurements for GFP (29). In agreement with our previous results (4), Venus-LC3 recovered much more slowly than Venus, with a rate of 3 ± 1 × 10⁻³ s−1 (t-test, p<0.005 N=9). Furthermore, all of the LC3 mutants recovered with rates that were statistically within error of the wild-type protein (t-tests, p>0.005, N>7). In these experiments, the measured nucleocytoplasmic transport rate constant is the sum of the individual rate constants of nuclear import and nuclear export. Since the nucleocytoplasmic transport rate constants for the LC3 mutants are the same as Venus-LC3, but their N/C ratios are lower than Venus-LC3, this suggests that the rates of nuclear import are slower than the rates of nuclear export for the mutants as compared to wild-type Venus-LC3. This is most likely the case because interactions in the nucleus mediated by residues F52 L53, R70, R68-70, are disrupted.
Figure 3. The nucleocytoplasmic transport rate constants for wild type Venus-LC3, G120, F52 L53, R70, and R68-70 are identical.

(A) Representative images from a quantitative FRAP assay used to measure the rate of nucleocytoplasmic transport for Venus (top row) or Venus-LC3 (bottom row). The entire nuclear region was selectively photobleached using a user defined ROI, and the fluorescence intensity of the whole cell was used for normalization. Scale bar is 10 μm. (B) Average FRAP curves from cells expressing the indicated constructs following photobleaching of the nucleus. The data were fit using a two component exponential model (see Table 2 for parameters). The fast component was consistent with intracompartmental diffusion, while the slow component is consistent with nucleocytoplasmic transport. For graphical comparison, the FRAP data were transformed as described in Materials and Methods. The solid gray lines are the 95% confidence intervals for the fit to Venus, and the solid black lines are the 95% confidence intervals for the fit to Venus-LC3. Parameters from the fits to the data are summarized in Table 1.
Table 1.
Fit parameters from the fits to nucleocytoplasmic transport FRAP data.
| Protein | a | b | c | K Slow (s−1) | K Fast (s−1) |
|
|
|---|---|---|---|---|---|---|---|
| Venus | 0.95±0.04 (9) | 0.22±0.06 (9) | 0.3±0.1 (9) | 0.008±0.003 (9) | 0.08±0.05 (9) | 10.0 | |
| Venus-LC3 | 0.95±0.09 (9) | 0.19±0.08 (9) | 0.28±0.09 (9) | 0.003±0.001 (9) | 0.06±0.04 (9) | 21.2 | |
| F52A L53A | 0.94±0.09 (8) | 0.2±0.1 (8) | 0.27±0.07 (8) | 0.003±0.001 (8) | 0.06±0.03 (8) | 22.7 | |
| R70A | 1.1±0.2 (10) | 0.2±0.1 (10) | 0.3±0.2 (10) | 0.003±0.002 (10) | 0.07±0.04 (10) | 22.6 | |
| R68-70A | 0.99±0.07 (8) | 0.19±0.08 (8) | 0.36±0.06 (8) | 0.004±0.001 (8) | 0.07±0.03 (8) | 19.3 | |
| G120A | 1.1±0.2 (7) | 0.3±0.1 (7) | 0.4±0.2 (7) | 0.003±0.003 (7) | 0.06±0.05 (7) | 22.5 |
Values are the mean ± 95% CI (N = # of cells)
Nuclear LC3 associates with slowly diffusing complexes whose apparent size depends strongly on R70 and R68-70 but not on F52 L53 or G120
To test this idea further, we used FRAP to measure the diffusional mobility of nuclear Venus-tagged LC3, Venus-LC3 mutants, and Venus alone (Figure 4A). FRAP yields two parameters that report on the mobility of the molecules of interest. First, it reports on the mobile fraction of molecules, defined as the fraction of molecules that are able to recover into the bleached region over the timescale of the experiment. Second, it provides a diffusion coefficient, D, which measures the mean squared displacement of molecules per unit time. D can be directly related to the hydrodynamic radius, r, of the diffusing species for the case of freely diffusing, spherical molecules. In some cases, FRAP can also be used to detect a combination of diffusion and binding events (33–37).
Figure 4. The diffusional mobility of LC3 in the nucleus is increased by disrupting its interactions with proteins and RNA mediated by residues F52 L53, R70, and R68-70, but is unaffected by disrupting G120.

(A) Representative example of bleach regions used to measure the diffusion of soluble LC3 in the nucleus of HeLa cells by FRAP. The imaging ROI is indicated by the dashed rectangle, and the bleaching ROI (1 μm radius) is indicated by the dashed circle. Scale bar is 10 μm. (B) Representative datasets showing the average of 10 FRAP curves from cells expressing either Venus (gray circles) or Venus-LC3 (white circles). The FRAP curves were fit using a single component diffusion model (data for G120A, F52A L53A, R70A, and R68-70A were similarly well fit by this model), and normalized between 0 and 1 for graphical comparison. Residuals for the fits to the data are also shown. (C) Mean diffusion coefficients from FRAP experiments of the indicated constructs in the nucleus under basal conditions (gray bars) and in EBSS-treated cells (black bars). N values are reported in Table 2. (D) LC3’s effective size in the cytoplasm and nucleus are correlated. Predicted molecular weights were calculated using the diffusion coefficients from FRAP measurements under basal conditions in the nucleus from the current study (panel C) or from previously reported diffusion coefficients measured in the cytoplasm by FRAP (17). Data for R68-70A in the cytoplasm were collected in the current study. Data are shown for both wild type and mutant forms of LC3. The data were fit by linear regression, R2=0.82.
The results of the FRAP measurements showed that all of the constructs were well described by a pure diffusion model (Figure 4B). The mobile fractions were 100% for all of the constructs (Table 2), indicating that the proteins are mobile, and do not undergo stable interactions with static components of the nucleus on the timescale of our measurements. D was fastest for Venus, as expected, given that it is a freely diffusing, inert protein (Figure 4C). Nuclear Venus-LC3 diffused ~3.5 fold more slowly than the Venus control, in agreement with our previous findings (4, 16). Similar D values were obtained for wild type LC3, F52A L53A, and G120A (t-tests, p>0.005, N=49, 30 & 20 respectively). In contrast, D values for R70A and R68-70A were over 2 fold faster than for wild type LC3 (t-tests, p<0.005, N=30 & 18 respectively). Assuming D is proportional to MW−1/3, these findings imply that nuclear Venus-LC3 is incorporated into a complex with an approximate molecular weight of 1.2 MDa (Table 2). R70A and R68A-70A, on the other hand, associate with complexes that are significantly smaller in size, approximately 160 and 90 kDa respectively. These complexes are thus still larger than the predicted size of Venus-LC3 if it were present as a monomer (~45 kDa). We conclude from these measurements that, under basal conditions, LC3 likely associates with mobile high molecular weight complexes in the nucleus. Furthermore, its interactions with these putative complexes depend on its triple arginine motif, but not its hydrophobic binding interface or lipidation site. Similar results were observed in cells treated with EBSS prior to FRAP analysis (Figure 4C).
Table 2.
Effective molecular weights (MW) and mobile fractions for nuclear LC3 and mutants based on FRAP measurements of HeLa cells
| Protein | Monomer MW (kDa) | Basal Predicted MW (kDa)* | EBSS Predicted MW (kDa)* | Basal Mobile Fraction (%) | EBSS Mobile Fraction (%) |
|---|---|---|---|---|---|
| Venus | 25 | N/A | N/A | 99.9±0.3 (50) | 102±4 (20) |
| Venus-LC3 | 45 | 1200±300 (49) | 2000±1000 (20) | 99.6±0.3 (49) | 99±1 (20) |
| Venus-LC3F52A L53A | 45 | 1500±400 (30) | 1700±700 (20) | 99.8±0.6 (30) | 100±2 (20) |
| Venus-LC3R70A | 45 | 160±50 (30) | 140±60 (20) | 100.1±0.4 (30) | 100±2 (20) |
| Venus-LC3R68-70A | 45 | 90±30 (18) | 100±40 (20) | 100.1±0.8 (18) | 100±1 (20) |
| Venus-LC3G120A | 45 | 1000±400 (20) | 1700±700 (20) | 99.5±0.7 (20) | 99.7±0.9 (20) |
Calculated assuming a spherical geometry
Values are the mean ± 95% CI (N = # of cells)
Our finding that the diffusional mobility of LC3 in the nucleus depends on R70, but was less sensitive to mutations of F52 L53 or G120 was reminiscent of the previously reported behavior of these mutants in the cytoplasm (17). To directly test the relationship between cytoplasmic and nuclear forms of LC3, we compared the diffusional mobilities of nuclear LC3 obtained in the current study with those previously measured for cytoplasmic LC3 under basal conditions (17). Because the triple arginine mutant had not been analyzed in our previous study, we carried out measurements of its diffusional mobility in the cytoplasm for comparison. This analysis revealed that D for wild type LC3 and the LC3 mutants in the cytoplasm and nucleus are correlated (R2=0.82) (Figure 4D), which implies that nuclear and cytoplasmic LC3 associate with complexes whose hydrodynamic radii depends in a similar manner on F52 L53, R70, R68-70, and G120.
LC3 is enriched in the nucleolus
Because LC3 is enriched in the nucleus in slowly diffusing complexes relative to Venus, we next considered the possibility that LC3 associates with subnuclear bodies in the nucleus, such as the nucleolus. To test this, we asked whether Venus-LC3 had a similar distribution as a biologically inert protein, such as GFP. GFP is relatively uniformly distributed throughout the nucleoplasm, but is partially excluded from the nucleolus (verified by immunostaining cells for the nucleolar marker fibrillarin) (Supplementary Figure 3). We, therefore, co-expressed Cerulean and Venus-LC3 and looked for differences in their subnuclear distribution (Figure 5A).
Figure 5. Venus-LC3 is enriched within the nucleolus via a mechanism that depends on its triple arginine motif.

(A) HeLa cells were co-transfected with either Venus and Cerulean (top row) or Venus-LC3 and Cerulean (bottom row). Cerulean was used as an inverse marker for the nucleolar compartment (dashed circles). Scale bar, 10 μm. (B) Confocal images of the nuclear region of live HeLa cells co-expressing Cerulean and the indicated Venus-tagged constructs under basal conditions. (C) Confocal images of the nuclear region of live HeLa cells co-expressing Cerulean and the indicated Venus-tagged constructs following 000 h of EBSS treatment. (D) Quantification of the ratio of the indicated constructs in the nucleolus versus the surrounding nucleoplasm under basal conditions (gray bars) and in EBSS-treated cells (black bars). Error bars are 95% confidence intervals. For basal conditions, N = 120 for LC3; 65 for G120A; 66 for F52A L53A and Venus; 62 for R70A; and 37 for R68-70A. N = 20 for all constructs during EBSS treatment. One way ANOVA p<1×10⁻⁴. Bonferroni corrected t-tests for the nucleolar ratios of each construct compared to Venus-LC3..
We observed some nuclear puncta enriched in Venus-LC3, in agreement with recent reports (5, 7), although these puncta were not studied further here. Interestingly, however, this analysis revealed that Venus-LC3 was enriched in nucleoli—regions where Cerulean was excluded, and where fibrillarin is present (Figure 5A, Supplementary Figure 3).
To quantify the extent of enrichment of Venus-LC3 in the nucleolus, we used the images of Cerulean to define the nucleolar regions, and then measured the ratio of Venus-LC3 in the nucleoli versus the surrounding nucleoplasm. We found that Venus-LC3 was nearly equally distributed inside and outside of nucleoli with a nucleolar ratio (NoR) of 0.94 ± 0.06, which was 22% higher than the Venus control (Bonferonni corrected t-test, p<0.005 N=66) (Figure 5D). This finding is especially remarkable given the apparent size of nuclear Venus-LC3 is much larger than that of Venus itself. Thus, Venus-LC3 is selectively enriched in the nucleolus compared to an inert reporter protein under basal conditions. Similar results were obtained in cells treated with EBSS prior to imaging (Figure 5D).
Multiple residues contribute to LC3’s nucleolar enrichment
Next, we considered the possibility that LC3 is specifically targeted to the nucleolus. The signals that regulate nucleolar localization (NoLS) are not fully defined, but are thought to include charged arginine and lysine residues (38). We used a published program (39, 40) to test for the presence of nucleolar signals in human and rat LC3B. By this analysis, LC3B does not contain a predicted NoLS. Nucleolar signals are, however, poorly defined and it is believed that nucleolar localization is the result of direct and indirect interactions with nucleolar building blocks, which may be nucleic acids or proteins (41). It is thus possible that either protein-protein interactions or protein-RNA interactions, or both, may help target LC3 to nucleoli.
We addressed these possibilities by examining the sub-nuclear distribution of the LC3 mutants (Figure 5B–D). The F52A L53A mutant had a modest, but significant decrease in its NoR compared to wild type LC3 (t-test, p<0.005 N=66), the R70A mutant had a more noticeable ~10% decrease in its NoR (t-test p<0.005 N=62), and the R68-70A mutant showed the most dramatic (~20%) decrease in its NoR (t-test, p<0.005 N=37); in fact, fully disrupting LC3’s triple arginine motif completely abolished LC3’s nucleolar localization to levels observed for Venus alone (t-test, p>0.005 N=37). In contrast, the NoR for G120A was identical to that of wild type LC3 (t-test, p>0.005, N=65). These trends were similar in cells examined under basal conditions (Figure 5B, D) or following starvation (Figure 5C, D). Taken together, these findings suggest that LC3’s interactions with proteins and/or RNA within the nucleolus, especially those mediated via its triple arginine motif, are largely responsible for regulating its nucleolar localization.
LC3 cycles rapidly in and out of the nucleolus
The finding that Venus-LC3 is present at similar levels in the nucleolus and nucleoplasm implies that it only weakly associates with nucleolar components, rather than being immobilized there. We thus used FRAP to measure nucleolar transport and asked whether Venus-LC3 cycles in and out of the nucleolus. For these studies, we photobleached a region within the nucleolus that was slightly smaller than the average size of most nucleoli (Figure 6A), and for comparison we bleached an identically sized region in the nucleoplasm (Figure B). Recovery of fluorescence within nucleoli occurred within ~ 1 s for Venus, wild type Venus-LC3, and the mutant forms of the protein in both the nucleoplasm and nucleolus (Figure 6C). Thus, Venus-LC3 and its mutants are able to rapidly exchange in and out of the nucleolus.
Figure 6. LC3 cycles rapidly in and out of the nucleolus under basal conditions.

(A) Representative images for a FRAP experiment in the nucleoplasm. Bar, 10 μm. (B) Representative images for a FRAP experiment in the nucleolus. Bar, 10 μm. (C) Normalized FRAP curves for Venus-LC3 in the nucleoplasm (gray circels) or nucleolus (white circles). Curves represent the mean values for 20 cells. The FRAP curves were fit using a single component diffusion model (black lines) and normalized between 0 and 1 for graphical comparison. Residuals for the fits to the data are also shown. (D) Bar graph of the mean diffusion coefficients from FRAP data collected in either the nucleoplasm (gray bars) or nucleolus (black bars). Bars are 95% confidence intervals; N=20 cells. Bonferonni corrected t-tests for the D values of each construct in the nucleoplasm compared to the nucleolus.
The recovery of Venus-LC3 into the nucleolus could potentially reflect a combination of diffusional exchange of proteins between the nucleoplasm and the nucleolus, binding to nucleolar components, and diffusion within the nucleolus. Despite this complexity, however, we found that the FRAP curves could be well fit using a single component free diffusion model, and thus for simplicity used this model for our analysis. For Venus, similar D values were obtained inside and outside of the nucleolus (t-test, p>0.008) (Figure 6D). In contrast, while the D values within the nucleolus and nucleoplasm were strongly correlated for the Venus-LC3 constructs, in all cases, D was significantly slower in the nucleolus than nucleoplasm (t-tests, p<0.008) (Figure 6D). Taken together, these data suggest that LC3-associated complexes rapidly traffic between the nucleoplasm and nucleolus, but are slightly enriched in the nucleolus relative to an inert protein as a result of weak binding to nucleolar components, such as nucleolar RNA or nucleolar-associated proteins.
Identification of candidate LC3 interacting proteins in the nucleus
According to our FRAP data, LC3 forms large complexes in nucleus and cytoplasm and also appears to interact weakly with components of the nucleolus. Therefore we wanted to identify candidate proteins that specifically interact with LC3 in the nucleus and cytoplasm. To this end, HeLa cells transiently transfected with Venus and wild type Venus-LC3 were fractionated into nuclear and cytoplasmic extracts. Next, Venus and Venus-LC3 complexes were co-immunoprecipitated from these extracts using anti-GFP binding resin and partially resolved by electrophoresis. The identification of proteins in these complexes was then performed using MudPIT (Figure 7A). We also probed the blots for tubulin and HDAC2 to assess the purity of the cytoplasmic and nuclear fractions, respectively (Figure 7B).
Figure 7. Strategy for identification of proteins interacting with LC3 in the nucleus and cytoplasm.

(A) Schematic of experiment workflow. HeLa cells were transiently transfected with Venus or Venus-LC3 prior to subcellular fractionation. Nuclear or cytoplasmic extracts containing Venus or Venus-LC3 were incubated with GBP-Sepharose resin for 2h at 4° C in order to immunoprecipitate Venus or Venus-LC3 protein complexes (IP). IP fractions were washed 4 times (WO) and then eluted from the beads (elution). The input, unbound, wash, and eluted fractions were then analyzed by immunoblotting (C,D). Protein complexes obtained in elutions were partially resolved by SDS-PAGE followed by protein identification via MudPIT. Further validation of two of the proteins identified by MudPIT (MAP1B and SQSTM1) was performed by immunoblotting of IP fractions with anti-MAP1B and anti-SQSTM1 antibodies (C,D). (B) For quality control of subcellular fractionation, nuclear (N) and cytoplasmic (C) extracts of Venus or Venus-LC3 transfected HeLa cells were resolved by SDS-PAGE and western blotted with anti-HDAC2 (positive nuclear control) and β-Tubulin (positive cytoplasmic control) antibodies. IP fractions from (C) Nuclear and (D) Cytoplasmic HeLa extracts were electrophoretically resolved by SDS PAGE and immunoblotted with (i) anti-MAP1B, (ii) anti-SQSTM1, or (iii) anti-GFP antibodies. M, molecular weight markers.
Using MudPIT, a total of 1176 proteins were identified in eluted nuclear protein complexes, out of which 497 proteins had higher spectral counts in the nuclear-LC3 fraction compared to the nuclear-Venus fraction (Supplementary Table 1). We thresholded this list, and prepared a table for the high confidence interacting proteins (Table 3). After cross-referencing these proteins against a recently reported database of the nuclear vertebrate proteome (42), we found the vast majority was previously identified there, thus providing independent confirmation that they represent bona fide nuclear-localized proteins.
Table 3.
List of proteins co-immunoprecipitated with Venus-LC3 from nuclear fraction of HeLa cells*
| Protein, ID* |
Mass** (kDa) |
Protein class** |
Function** | Sub- cell Loc*** |
Total Spectral counts |
Ref**** | |
|---|---|---|---|---|---|---|---|
| LC3 | Venus | ||||||
| Tubulin beta-3 chain, Q13509 | 50 | Cytoskeleton, Mt | Protein polymerization, GTP binding, N/C shuttling | Nu, Cy | 26 | 0 | - |
| Beta-actin-like protein 2, Q562R1 | 42 | Cytoskeleton | ATP binding, Motility | Cy | 17 | 0 | - |
| Proteasome activator complex subunit 2, Q9UL46 | 27 | Proteasome | DNA damage response, Gene expression, Polyubiqitination, Ubiquitin protein ligase/Apoptosis regulation | Np, Cy, CM | 9 | 0 | 2 |
| Hydroxymethylglutaryl-CoA lyase, mitochondrial, P35914 | 34 | Lyase | Ketogenesis, Nutrition-starvation, Homo-oligomerization | M, P, CM | 9 | 0 | 2 |
| Sequestosome-1, Q13501 | 48 | Autophagy | Ubiquitin protein ligase, Transcription regulation from RNA polymerase II promoter, Homo/hetero oligomerization, Apoptosis, Protein localization, N/C shuttling, Cell stress response | Nu, Np, Cy, ER | 6 | 0 | 1,2 |
| Zinc finger protein 207, O43670 | 51 | DNA/RNA binding, Mt binding | Transcription regulation, Cell cycle, Mt polymerization, Protein stabilization | Nu, No Ch | 6 | 0 | 2 |
| GTP-binding protein SAR1α, Q9NR31 | 22 | GTP-binding protein | Intracellular vesicle mediated protein transport | ER, G | 5 | 0 | 2 |
| 40S ribosomal protein S27, P42677 | 9 | Ribosomal protein, DNA/RNA binding | Gene expression, mRNA degradation, Translation | Nu, Cy | 5 | 0 | 2 |
| 14-3-3 protein beta/alpha, P31946 | 28 | Adaptor protein | Gene expression, Transcription regulation from RNA polymerase II promoter, mRNA stability, Apoptosis, Innate immunity, Protein targeting, Insulin receptor signaling, Hetero-oligomerization, Membrane organization | Nu, Cy, PN, CM | 5 | 0 | 2 |
| Cellular nucleic acid-binding protein, P62633 | 19 | DNA/RNA binding | Cell proliferation/Transcription regulation, Cholesterol biosynthesis | Nu, Cy, ER | 4 | 0 | 2 |
| Voltage-dependent anion selective channel protein 1, P21796 | 31 | Porin | Macromitophagy, Ion transport, Apoptosis, Epithelial cell differentiation, Protein complex | Nu, M, PM, CM, | 4 | 0 | 2 |
| GTPase Era, mitochondrial, O75616 | 48 | GTP/RNA binding | Ribosome biogenesis, | M | 4 | 0 | 2 |
| Adenylosuccinate lyase, P30566 | 55 | Lyase | Purine biosynthesis, Response to hypoxia/Nutrition/Starvation, Protein Tetramerization | Cy, M | 4 | 0 | 2 |
| Protein LTV1 homolog, Q96GA3 | 55 | - | - | Np, Cy | 4 | 0 | 2 |
| Meiotic nuclear division protein 1 homolog, Q9BWT6 | 24 | DNA binding | DNA recombination, Meiotic cell cycle | Nu | 4 | 0 | 2 |
| Microtubule associated protein 1B, P46821 | 271 | Cytoskeleton, Mt binding/polymerization/stabilization | Intracellular transport, N/C shuttling, Oligomerization, Autophagic vesicle formation | Cy, PM | 104 | 2 | 1,2 |
| 40S ribosomal protein S20, P60866 | 13 | Ribosomal protein, RNA binding | Gene expression, mRNA degradation, Translation | Cy, CM | 17 | 1 | 2 |
| NEDD8-conjugating enzyme Ubc12, P61081 | 21 | Ligase, ATP binding | Ubiquitination, Proteasome degradation, Apoptosis | Cy | 11 | 1 | 2 |
| Thioredoxin reductase1, cytoplasmic, Q16881 | 71 | Oxidoreductase | Tubulin/Actin polymerization, Gene expression, Transcription, Cell redox homeostasis | Nu, Np, No, Cy, M | 8 | 1 | 2 |
| Long-chain-fatty acid-CoA ligase 4, O60488 | 79 | Ligase, ATP binding | Lipid metabolism, Fatty acid transport | Cy, ER, M, P, CM | 8 | 1 | 2 |
| Ubiquitin-conjugating enzyme E1 D2, P62837 | 17 | Transferase, ATP binding | Ubiquitination, Innate immunity, Transcription regulation from RNA polymerase II promoter in response to hypoxia, Protein complex formation | Np, Cy | 8 | 1 | 2 |
| Heat shock protein beta-1, P04792 | 23 | Chaperone, RNA/Ub/Proteasome binding | Gene expression, Translation/mRNA stability/Apoptosis regulation, Stress response, unfolded protein response, Translocate to nucleus during heat shock, Homophilic interaction | Nu, Cy, PM | 6 | 1 | - |
| Calnexin, P27824 | 68 | Chaperone, RNA/Ca/glycoprotein binding | N linked glycosylation, protein folding, assembly of protein subunits | ER, CM | 6 | 1 | 2 |
| Methionine-R-sulfoxide reductase B2, mitochondrial, Q9Y3D2 | 20 | Oxidoreductase, DNA/Actin binding | Actin polymerization, Oxidative stress response, Transcription regulation, Cell survival and protein repair | M | 6 | 1 | 2 |
| Putative transferase CAF17, mitochondrial, Q5T440 | 38 | Transferase, RNA binding | Heme biosynthesis | M | 10 | 2 | 2 |
| Aspartyl/asparaginyl beta-hydroxylase, Q12797 | 86 | Oxidoreductase, Ca binding | Ca ion transmembrane transport, Transcription/Proteolysis/protein depolymerization/intracellular protein transport regulation, Response to ATP | Cy, ER, CM | 5 | 1 | 2 |
| Myosin light polypeptide 6, B7Z6Z4 | 27 | Motor protein, Ca binding | Motility | - | 5 | 1 | - |
| Rho-related GTP binding protein RhoG, P84095 | 21 | Cytoskeleton, GTP binding | Cell migration, Transcription regulation, Protein localization to membrane | PM, ER, CM | 5 | 1 | 2 |
| Methyltransferase-like protein 2B, Q6P1Q9 | 43 | Transferase | tRNA methylation, | - | 5 | 1 | - |
| 6-phosphofructokinase, muscle type, P08237 | 85 | Kinase/Transferase, ATP binding | Glycolysis, Protein oligomerization, Homophilic protein interaction | Cy | 5 | 1 | 2 |
| 6-phosphofructokinase type C, Q01813 | 86 | Kinase/Transferase, ATP binding | Glycolysis. Mitophagy, Protein complex binding | Nu, Cy, CM | 36 | 8 | 1,2 |
| Myeloid, differentiation primary response protein MyD88, Q99836 | 33 | Innate immunity | mRNA stabilization, Death receptor binding, Homophilic interaction | Cy, PM, CM | 9 | 2 | 2 |
| Guanine nucleotide-binding protein subunit beta-2-like 1, P63244 | 35 | RNA binding, Cell cycle related protein | Cellular response to glucose stimulus, Cell migration, Protein localization, Protein complex scaffold, homo-dimerization, Ubiquitin/Proteasomal degradation, Translation/Unfolded protein response/Phagocytosis/Apoptosis regulation | Nu, PN, Cy, CM, M | 16 | 4 | 2 |
| Hepatoma-derived growth factor, P51858 | 27 | DNA/RNA binding | Transcription repressor, Unfolded protein response | Nu, Np, Cy | 12 | 3 | 2 |
| Splicing factor, proline-and glutamine-rich, P23246 | 76 | DNA/RNA binding | Cell cycle/Transcription regulation, DNA damage response, DNA repair/recombination, RNA splicing, Chromosome organization, Histone deacetylation | Nu, Np, NuM, Ch, Cy | 8 | 2 | 2 |
| Thymidine Kinase, cytosolic, P04183 | 25 | Kinase/Transferase, ATP binding | DNA synthesis, response to nutrient level, homo oligomerization, Homophilic interaction | Cy | 8 | 2 | - |
| 40S ribosomal protein S5, P46782 | 23 | Ribosomal protein, RNA binding | Gene expression, mRNA degradation, Translation | Cy, CM | 7 | 2 | 2 |
| 40S ribosomal protein S18, P62269 | 18 | Ribosomal protein, RNA binding | Gene expression, mRNA degradation, Translation | Nu, Cy, CM | 7 | 2 | 2 |
| Ketosamine-3-kinase, Q9HA64 | 34 | Kinase/Transferase | Phosphorylation of ketosamine moiety of glycated proteins, Protein repair | - | 7 | 2 | 2 |
| Telomere-associated protein RIF1, Q5UIP0 | 274 | Cell cycle | Cell response to DNA damage, DNA repair, Telomere maintenance, Mt binding | Nu, Np Ch, Cy | 7 | 2 | 2 |
| Transcription elongation regulator 1, O14776 | 124 | RNA binding | Transcription regulation | Nu, No | 7 | 2 | 2 |
| Cysteine and glycine-rich protein 2, Q16527 | 21 | Developmental protein | Cell differentiation and proliferation | Nu | 20 | 6 | 2 |
| Heterogeneous nuclear ribonucleoprotein A1, P09651 | 39 | DNA/RNA binding, Ribonucleoprotein | Gene expression, mRNA processing/splicing, Nuclear import/export, mRNA export from nucleus, | Nu, Np, Cy, CM | 10 | 3 | 2 |
| Condensin-2 complex subunit D3, P42695 | 169 | Cell cycle | DNA condensation, Mitotic chromosome architecture | Nu, No, Ch CM | 10 | 3 | 2 |
| Dihydropyrimidinase-related protein 3, Q14195 | 62 | Cytoskeleton | Actin crosslinking/assembly, cell migration, homo oligomerization | Cy | 22 | 7 | 2 |
| Cysteine-rich protein 2, P52943 | 22 | Cell proliferation | Hemopoiesis | C | 9 | 3 | - |
| Serine/threonine-protein phosphatase PP1-alpha catalytic subunit, P62136 | 38 | Phosphatase/ribonucleoprotein complex | Glycogen biosynthesis, Cell cycle, Translation/Apoptosis regulation, Triglyceride catabolic process | Nu, No, Np, Cy, PM | 6 | 2 | 2 |
| 26S protease regulatory subunit 10B, P62333 | 44 | Proteasome complex, ATP binding | Gene expression, mRNA stability, regulation of RNA polymerase II transcription preinitiation complex assembly, Protein binding/bridging, Apoptosis, Proteasome/ubiquitin protein degradation, Cell cycle, Innate immune response, amino acid metabolism | Nu, Np, Cy, CM | 6 | 2 | 2 |
| Glucosamine 6-phosphate N-acetyltransferase, Q96EK6 | 21 | Transferase | Protein glycosylation, Homophilic interaction | Cy, ER, G, CM | 9 | 3 | 2 |
| Ras-related protein rab-13, P51153 | 23 | GTP binding | Intracellular membrane trafficking, Actin organization, Membrane organization, cell migration, cellular response to insulin | Cy, G, PM | 6 | 2 | 2 |
| ATP synthase subunit O, mitochondrial, P48047 | 23 | ATP biosynthesis | Cell metabolism, Ion transport | Nu, M, CM, PM | 6 | 2 | 2 |
| Heterogenous nuclear ribonucleoprotein D0, Q14103 | 38 | RNA/DNA binding, Ribonucleoprotein | Gene expression, RNA processing/splicing, mRNA stability, Transcription/Translation regulation | Nu, Np, Cy | 6 | 2 | 2 |
Proteins were selected for inclusion in this table if they exhibited a fold change of ≥3 and fold difference of ≥ 4. Fold change for each protein is defined as the ratio of total spectral counts in Venus-LC3 versus the Venus samples. (Fold change is ∞ for proteins with absolute spectral counts in Venus-LC3 fraction, but zero counts in Venus fraction.) Fold difference was by subtracting the spectral counts for Venus from Venus-LC3. Proteins are arranged in decreasing order of their absolute spectral counts in Venus-LC3 fraction and fold change.
Functional and subcellular location information derived from http://www.uniprot.org/ using Uniprot ID.
Loc: Location; C: Cell cortex; Ch: Chromosome; CM: Cell membrane; Cy: Cytoplasm; ER: Endoplasmic reticulum; G: Golgi apparatus; M: Mitochondria; Mt: Microtubules; MtOC: Microtubule organizing center; P: Peroxisome; PM: Plasma membrane; PN: Perinuclear, No: Nucleolus; Np: Nucleoplasm; Nu: Nucleus; NuM: Nuclear matrix.
References cited:
1. Behrends C, Sowa ME, Gygi SP, Harper JW. Network organization of the human autophagy system. Nature 2010;466(7302):68–76.
2. Wühr M, Güttler T, Peshkin L, McAlister GC, Sonnett M, Ishihara K, Groen AC, Presler M, Erickson BK, Mitchison TJ, Kirschner MW, Gygi SP. The nuclear proteome of a vertebrate. Curr Biol. 2015;25(20):2663–71.
Following similar exclusion and inclusion criteria for the cytoplasmic co-immunoprecipitated complexes, we found that 105 proteins had higher spectral counts in the cytoplasmic Venus-LC3 fraction compared to cytoplasmic Venus fraction (Supplementary Table 1). By applying a similar set of thresholds as for the nuclear proteins, we identified high confidence interacting proteins that were enriched in the cytoplasmic LC3 co-immunoprecipitated complexes (Table 4).
Table 4.
List of proteins co-immunoprecipitated with Venus-LC3 from cytoplasmic fractions of HeLa cells.
| Protein, ID* | Mass** (kDa) | Protein class** | Function** | Sub cell Loc*** | Total Spectral count | Ref**** | |
|---|---|---|---|---|---|---|---|
| LC3 | Venus | ||||||
| Ubiquitin-like modifier-activating enzyme, ATG7, O95352 | 78 | Autophagosome assembly | Amino acid metabolism, cell response to nitrogen starvation, Homo dimerization, Protein transport, Organelle organization, Membrane organization/fusion Ubiquitination/Apoptosis regulation, Protein modification by conjugation, late nucleophagy, mitophagy, Atg8/Atg12 activation | Cy | 22 | 0 | 1, 2 |
| Glucose-6-phosphate1-dehydrogenase, P11413 | 59 | Oxidoreductase/glucose metabolism | Gene expression, Transcription regulation from RNA polymerase II promoter, cell response to oxidative stress, food, Glutathione metabolic process, Lipid metabolism, Cholesterol biosynthesis, Homo dimerization, Homophilic interaction | Cy, Nu, MtOC, PM, CM | 4 | 0 | 2 |
| Cysteine protease ATG4B, Q9Y4P1 | 44 | Hydrolase/Endopeptidase | Autophagosome assembly, Protein transport, Proteolysis, cell response to nitrogen starvation, Mitophagy, Nucleophagy | Cy | 13 | 2 | 1, 2 |
| Aldo-keto reductase family 1 member C3, P42330 | 37 | Oxidoreductase/nuclear import | Cellular response to nutrient/starvation/ROS, GPCR signaling, Steroid metabolism | Cy, Nu | 5 | 1 | 2 |
| Microtubule-associated protein 1B, P46821 | 271 | Cytoskeleton, Mt binding/polymerization/stabilization | Intracellular transport, N/C shuttling, Oligomerization, Autophagic vesicle formation | Cy, PM | 14 | 3 | 1, 2 |
| Sequestosome-1, Q13501 | 48 | Autophagy | Ub protein ligase, Transcription regulation from RNA polymerase II promoter, Homo/hetero oligomerization, Apoptosis, Protein localization, N/C shuttling, Cell stress response | Nu, Np, Cy, ER | 18 | 4 | 1, 2 |
| Cysteine-rich protein 2, P52943 | 22 | Cell proliferation | Hemopoiesis | C | 6 | 2 | - |
Proteins were selected for inclusion in this table if they exhibited a fold change of ≥3 and fold difference of ≥ 4. Fold change for each protein is defined as the ratio of total spectral counts in Venus-LC3 versus the Venus samples. (Fold change is ∞ for proteins with absolute spectral counts in Venus-LC3 fraction, but zero counts in Venus fraction.) Fold difference was by subtracting the spectral counts for Venus from Venus-LC3. Proteins are arranged in decreasing order of their absolute spectral counts in Venus-LC3 fraction and fold change.
Functional and subcellular location information derived from http://www.uniprot.org/ using Uniprot ID.
Loc: Location; C: Cell cortex; CM: Cell membrane; Cy: Cytoplasm; Endoplasmic Reticulum: ER; MtOC: Microtubule Organizing Center; Np: Nucleoplasm; Nu: Nucleus; PM: Plasma Membrane.
References cited:
1. Behrends C, Sowa ME, Gygi SP, Harper JW. Network organization of the human autophagy system. Nature 2010;466(7302):68–76.
2. Wühr M, Güttler T, Peshkin L, McAlister GC, Sonnett M, Ishihara K, Groen AC, Presler M, Erickson BK, Mitchison TJ, Kirschner MW, Gygi SP. The Nuclear Proteome of a Vertebrate. Curr Biol. 2015;25(20):2663–71.
Previous studies have identified SQSTM1 and MAP1B as two of the major LC3 interacting proteins (22, 43, 44). Consistent with this, as listed in Tables 3 and 4, MudPIT identified MAP1B and SQSTM1 as major Venus-LC3 interacting proteins. Both proteins were detected in the nuclear and cytoplasmic fractions. Immunoblotting with SQSTM1 and anti-MAP1B antibodies confirmed co-immunoprecipitation of endogenous SQSTM1 and MAP1B with Venus-LC3 (Figure 7D). Our current study also detected proteins reported as LC3 interacting in a previous proteomics analysis of human autophagy system from whole cell extracts (22), as indicated in Tables 3 and 4.
A number of additional proteins in the immunoprecipitated complexes were identified in addition to MAP1B and SQSTM1. Of the proteins identified in nuclear protein complexes of Venus-LC3 (Table 3), approximately 48% proteins are involved in regulation of gene expression; 46% in cellular response to stress including starvation, hypoxia, oxidative stress or unfolded protein response; 44% form oligomers, protein complexes or are involved in homophilic interactions; and 29% have transporter function including intracellular, ion or nuclear-cytoplasmic transport. Specific interacting proteins identified in the Venus-LC3 nuclear co-immunoprecipitated complexes include tubulin; 40S ribosomal proteins S27, S20, S5, and S18; proteasomal activator complex subunit 2 (PSME2/PA28β); NEDD8 conjugating enzyme Ubc12; and splicing factor proline and glutamine rich (SFPQ) (Table 3). Additional Venus-LC3 interacting proteins identified in the cytoplasmic fraction included ATG4B, ATG7, cysteine-rich protein 2, and glucose-6-phosphate 1-dehydrogenase (Table 4). As indicated in Table 4, most of these LC3 interacting proteins have been identified previously by mass spectrometry (22).
Given that LC3 was weakly enriched in nucleoli, we wondered whether it may interact with nucleolar proteins. To determine which of the Venus-LC3 interacting proteins are associated with nucleoli, we cross-referenced the list of nuclear proteins against several published databases of nucleolar proteins (45–48). We also tested for the presence of NoLS signals in all of the proteins identified in Tables 3 and 4 using published software (39, 40). As summarized in Tables 5 and 6, the results of this analysis showed that multiple proteins identified as putative LC3-interacting proteins are either known to be part of the nucleolar proteome or are predicted to associate with nucleoli (e.g. MAP1B, 40S ribosomal subunit proteins, etc.). Thus, protein-protein interactions could potentially help regulate LC3’s trafficking in and out of the nucleolus.
Table 5.
Nuclear Venus-LC3 interacting proteins that are part of the nucleolar proteome or that contain nucleolar localization signal (NoLS)
| Protein, ID* |
NoLS** | Sequence** | Reference*** |
|---|---|---|---|
| Proteasome activator complex subunit 2, Q9UL46 | aa 79–102 | ETDKQEKKEGKRDKRKGPEFHKCG | 1 |
| Sequestosome-1, Q13501 | aa 94–116 | IFRIYIKEKKECRRDHRPPCAQE | This study |
| Zinc finger protein 207, O43670, NP_001027464 | aa 1–22 | MGRKKKKQLKPWCWYCNRDFDD | 2 |
| 40S ribosomal protein S27, P42677 | aa 9–33 | HPSPEEEKRKHKKKRLVQSPNSYFM | This study |
| Voltage-dependent anion selective channel protein 1, P21796 | No | - | 2 |
| Protein LTV1 homolog, Q96GA3 | aa 1–20 | MPHRKKKPFIEKKKAVSFHL | This study |
| Microtubule associated protein 1B, P46821 | aa 634–659; 662–745; 2231–2263 | KEKTVKKETKVKPEDKKEEKEKPKKE; KKEDKTPIKKEEKPKKEEVKKEVKKEIKKEEKKEPKKEVKKETPPKEVKKEVKKEEKKEVKKEEKEPKKEIKKLPKDAKKSSTP; LGKALKKDLKEKTKTKKPGTKTKSSSPVKKSDG | This study |
| Thioredoxin reductase1, cytoplasmic, Q16881 | aa 17–36 (isoform 3) | VPAGPGRKPRPRRSSRLLAG | This study |
| Aspartyl/asparaginyl beta-hydroxylase, Q12797 | aa 29–48; 320–340 | SPGARRETKHGGHKNGRKGG; PEQKAKVKKKKPKLLNKFDKT | This study |
| Guanine nucleotide-binding protein subunit beta-2-like 1, P63244 | No | - | 2 |
| Splicing factor, proline-and glutamine-rich, P23246 | aa 56–105 | PKPPIPPPPPHQQQQQPPPQQPPPQQPPPHQPPPHPQPHQQQQPPPPPQD | 2,3,4,5 |
| 40S ribosomal protein S5, P46782 | No | - | 3,5 |
| 40S ribosomal protein S18, P62269 | No | - | 2 |
| Telomere-associated protein RIF1, Q5UIP0 | aa 1560–1581; 1714–1737 | KEEGSRKKRSGKWKNKSNESVD; QTLECQHKRSRRVRRSKGCDCCGE | This study |
| Transcription elongation regulator 1, O14776, IPI00247871 | aa 619–640 | EDEPVKAKKRKRDDNKDIDSEK | This study |
| Heterogeneous nuclear ribonucleoprotein A1, P09651 | No | - | 3,4,5 |
| Condensin-2 complex subunit D3, P42695 | aa 151–191; 1479–1498 | WPQESNLNRKRKKEQPKSSQANPGRHRKRGKPPRREDIEMD; KDTPACSRRSLRKTPLKTAN | This study |
| Serine/threonine-protein phosphatase PP1-alpha catalytic subunit, P62136 | No | - | 2 |
| Ras-related protein rab-13, P51153 | aa 183–203 | KPPSTDLKTCDKKNTNKCSLG | This study |
| Heterogenous nuclear ribonucleoprotein D0, Q14103 | No | - | 5 |
Uniprot/RefSeq/IPI accession number
Prediction of Nucleolar localization signal and sequence by freely available software http://www.compbio.dundee.ac.uk/www-nod/
References citing nucleolar localization of proteins.
1. Wójcik C, Tanaka K, Paweletz N, Naab U, Wilk S. Proteasome activator (PA28) subunits, alpha, beta and gamma (Ki antigen) in NT2 neuronal precursor cells and HeLa S3 cells. Eur J Cell Biol. 1998; 77(2):151–60.
2. Andersen JS, Lam YW, Leung AK, Ong SE, Lyon CE, Lamond AI, Mann M. Nucleolar proteome dynamics. Nature. 2005; 433(7021):77–83.
3. Andersen JS, Lyon CE, Fox AH, Leung AK, Lam YW, Steen H, Mann M, Lamond AI. Directed proteomic analysis of the human nucleolus. Curr Biol. 2002; 12(1):1–11.
4. Vollmer M, Hörth P, Rozing G, Couté Y, Grimm R, Hochstrasser D, Sanchez JC. Multi-dimensional HPLC/MS of the nucleolar proteome using HPLC-chip/MS. J Sep Sci. 2006; 29(4):499–509.
5. Scherl A, Couté Y, Déon C, Callé A, Kindbeiter K, Sanchez JC, Greco A, Hochstrasser D, Diaz JJ. Functional proteomic analysis of human nucleolus. Mol Biol Cell. 2002;13(11):4100–9.
Table 6.
Cytoplasmic Venus-LC3 interacting proteins that are part of the nucleolar proteome or that contain nucleolar localization signal (NoLS)
| Protein, ID* |
NoLS** | Sequence** | Reference |
|---|---|---|---|
| Cysteine protease ATG4B, Q9Y4P1 | aa 21–68 (isoform 2) aa 16–35 (isoform 3) aa 14–36 (isoform 4) aa 90–109 (isoform 6) |
AARGAPRGSRRPGRTPKWRLPRISARAPYRLRRLRRHTYWPPRRPVAA RHLGRDWRWTQRKRQPDSYF VCRHLGRDWRWTQRKRQPDSYFS RHLGRDWRWTQRKRQPDSYF |
This study |
| Microtubule-associated protein 1B, P46821 | aa 634–659; 662–745; 2231–2263 | KEKTVKKETKVKPEDKKEEKEKPKKE; KKEDKTPIKKEEKPKKEEVKKEVKKEIKKEEKKEPKKEVKKETPPKEVKKEVKKEEKKEVKKEEKEPKKEIKKLPKDAKKSSTP; LGKALKKDLKEKTKTKKPGTKTKSSSPVKKSDG | This study |
| Sequestosome-1, Q13501 | aa 94–116 | IFRIYIKEKKECRRDHRPPCAQE | This study |
Uniprot/RefSeq/IPI accession number
Prediction of Nucleolar localization signal and sequence by freely available software http://www.compbio.dundee.ac.uk/www-nod/
DISCUSSION
Despite growing evidence that LC3 is enriched in the nucleus and that nuclear LC3 plays critical roles in autophagy, the mechanisms by which LC3 is targeted to the nucleus and the nuclear components with which it interacts are poorly understood. In the current study, we investigated how LC3’s nuclear localization, trafficking into and out of the nucleus, intra-nuclear dynamics, and binding to nuclear components are regulated by residues on LC3 that are required for binding to proteins and RNA, and lipidation under nutrient rich conditions, and after nutrient starvation.
To carry out these studies, we used fluorescence microscopy to examine wild type LC3 and several well-studied mutants of LC3. These include (i) a double mutant (F52A L53A), which disrupts LC3’s hydrophobic binding interface that mediates binding to LIR-containing proteins; (ii) R70A and R68-70A mutants, which disrupt LC3’s triple arginine motif—a region of LC3 that is important for protein-protein interactions (22), LC3’s interactions with RNA (26, 27), and its C-terminal cleavage by Atg4 family members (28); and (iii) G120A, which disrupts LC3’s lipid modification. We focused primarily on the diffusely distributed population of LC3 in the nucleus, which presumably corresponds to LC3-I, although LC3-II has also been detected in the nucleus (3, 5, 9). We found that wild type Venus-LC3 was localized to both the nucleus and cytoplasm when transiently expressed in HeLa cells under nutrient rich conditions, placing LC3 within the ~17% of vertebrate proteins that partition approximately equally between the cytoplasm and nucleus, as opposed to being found predominantly in either the cytoplasm or nucleus (42). We consistently, however, found that the levels of nuclear Venus-LC3 were systematically higher than those found diffusely distributed in the cytoplasm. Disrupting LC3’s hydrophobic binding interface or LC3’s triple arginine motif, but not its lipidation site modestly decreased LC3’s nuclear enrichment, and we found that the overall nucleocytoplasmic transport rate constants, under basal conditions, for all of the Venus-LC3 mutants were indistinguishable from that of wild type Venus-LC3. Given that the overall nucleocytoplasmic transport rate constant is the sum of nuclear import and export rate constants, this suggests that the mutants with lower N/C ratios (e.g. R70A, and R68-70A) have slightly slower nuclear import rates relative to nuclear export rates as compared to wild-type Venus-LC3—an observation that is consistent with our conclusion that LC3’s triple arginine motif and hydrophobic binding interface, but not its lipidation site contributes to its steady-state nuclear enrichment.
Our previous work showed that LC3 diffuses as if it is part of a ~500 kDa complex in the cytoplasm, and its association with these complexes is disrupted by mutations to its triple arginine motif and hydrophobic binding interface, but not its lipidation site (17). Here, we hypothesized that nuclear LC3 associates with large complexes in the nucleus that may also depend on these residues. To test this hypothesis, we estimated the sizes of LC3 and LC3 mutants in the nucleus using a quantitative FRAP assay to measure D, a parameter that can be directly related to the size of the diffusing species. Under nutrient rich conditions, we found that D for nuclear G120A and F52A L53A mutants was similar to wild type Venus-LC3, suggesting that they all form similar sized complexes (Table 1), and hence are independent of its lipidation and canonical role in autophagosome formation. On the other hand, the diffusional mobility of nuclear Venus-LC3 substantially increased upon mutation of R70 or R68-R70, implying disrupting LC3’s triple arginine motif prevents LC3 from associating with large complexes in the nucleus. Interestingly, the diffusional mobility of the Venus-LC3 constructs in the nucleus was highly correlated with their diffusion in the cytoplasm. Thus we conclude that nuclear LC3 associates with slowly diffusing complexes whose apparent size depends strongly on R70 and R68-70 but not on F52 L53 or G120, and that the basis for LC3’s interaction with these complexes is similar in both the cytoplasm and nucleus.
We previously postulated the incorporation of GFP-LC3 into complexes in both the cytoplasm and nucleus that are too large to freely diffuse through nuclear pores may function as a mechanism that prevents LC3 from freely trafficking between the two compartments (4), and one of the objectives of this study was to test this hypothesis. A similar mechanism was recently proposed to maintain the nuclear and cytoplasmic proteomes (42). Based on our experiments examining the N/C ratios, N/C transport rate constants, and diffusion coefficients for the LC3 mutants in this study, we conclude that under steady-state conditions, LC3’s association with large complexes in the nucleus and cytoplasm is a mechanism that prevents its passive equilibration between the two compartments, and contributes to its nuclear enrichment under steady-state conditions. Interestingly, LC3 was recently shown to interact with transcriptionally inactive heterochromatin domains (14). This interaction could potentially contribute to the enrichment of LC3 in the nucleus observed in our studies.
The second objective of this study was to further investigate the nature of LC3’s interactions with nuclear bodies and other components of the nucleus. Thus we closely examined LC3’s sub-nuclear localization and found that LC3 is, in fact, present in the nucleolus. The nucleolus is a subnuclear body that self-assembles around actively transcribed ribosomal genes (49). Targeting of molecules to the nucleolus is thought to be a consequence of direct or indirect interactions with nucleolar building blocks (49). Thus, an inert reporter, such as GFP, is expected to be excluded from the nucleolus compared to the surrounding nucleoplasm, which was briefly noted in other studies (50–53), and was confirmed here. In contrast to Venus, we found that Venus-LC3 was uniformly distributed between the nucleoplasm and nucleoli suggesting that LC3 interacts specifically with nucleolar components, enabling it to gain access to this compartment. LC3’s association with the nucleolus, however, is relatively weak, explaining why it may have previously been overlooked in studies of GFP-tagged forms of LC3B. Although a number of protein components of nucleoli have been cataloged (46–48, 54), to our knowledge, LC3 has not yet been identified as a component of the nucleolar proteome, and was also not identified as a protein associated with nuclear bodies in a recent screen (55). These negative findings likely reflect the low degree of enrichment of LC3 in the nucleolus. Despite these previous negative findings, during the revision of this paper, another study showed that endogenous LC3B can be detected in the nucleolus using immunofluorescence (56). Thus, two complementary lines of evidence now suggest that the nucleolus is a nuclear body through which LC3 normally traffics, and potentially functions as well.
In addition to its interactions with components of the nucleolus, LC3 may also weakly bind to other nuclear structures. We noted, for example, that LC3 was also enriched in a small number of nuclear puncta. Although we did not further investigate the nature of these puncta in the current study, recent work suggests that such nuclear puncta do not represent autophagosomes (7). Rather, it is possible that they correspond to PML bodies, as suggested by recent findings that showed LC3 interacts with PML (8). Nuclear LC3 has also been shown to co-localize with phosphor-ERK in nuclear puncta (5).
In this study, we identified several residues that contribute to the nucleolar targeting of LC3. LC3 was partially excluded from the nucleolus upon mutation of LC3’s hydrophobic binding interface, suggesting interactions with other proteins within the nucleolus may help partition LC3 into the nucleolus. Mutation of R70 led to a more dramatic loss of nucleolar targeting of LC3. This residue has been implicated in LC3’s interaction with a number of proteins (22), and R70 is also part of a triple arginine motif in LC3. The primary sequence of LC3 in the region of its triple arginine motif shares similarities with nucleolar detention sequences that are rich in arginine residues (57, 58). This region of LC3 was previously identified as an RNA binding motif (26, 27), and it is thought that proteins with a general affinity for RNA will partition into the nucleolus due to interactions with the large amount of ribosomal RNA in this compartment (41). Consistent with the notion that LC3’s triple arginine motif plays an important role in LC3’s nucleolar localization, we found that the localization of LC3 to the nucleolus was completely disrupted by mutation of LC3’s triple arginine RNA binding motif. Thus, it is possible that LC3 may preferentially bind to RNA components of the nucleolus, such as ribosomal RNA. This is especially interesting considering that the RNA component of ribosomes has been reported to stimulate ATG12-ATG5 conjugation, a process required for LC3 to be conjugated to phosphatidylethanolamine (59). We conclude that LC3 associates with large complexes—via its triple arginine motif—that continuously survey the nucleolus.
To gain more insight into the possible composition of the LC3-associated complexes in the nucleus, we carried out subcellular fractionation. This was then followed by identification of Venus-LC3 interacting proteins from both cytoplasmic and nuclear extracts using shotgun proteomics and MudPIT. A state-of-the-art method for identification of protein-protein interactions in immunoprecipitated complex samples by mass spectrometry involving large scale high throughput data analysis, MudPIT is a very powerful strategy for large scale identification of protein complexes in subcellular compartments and to promote our understanding of in vivo processes involving these complexes (19) (20). Among the prospective nuclear LC3 interacting proteins are several known LC3 interacting proteins, including MAP1B and SQSTM1 (43, 44, 60), and tubulin (44, 61). Strikingly, tubulin beta 3 chain was one of the most abundant LC3 interacting proteins in the nucleus detected in our experiments. This was surprising given that tubulins are best known for their role in microtubule formation in the cytoplasm of interphase cells. Multiple studies, however, have also reported the presence of tubulin in the nucleus of cultured cells (62–66). It is thus possible that LC3, MAP1B, and tubulin form a complex that principally resides in the nucleus. LC3 interacts with tubulin via electrostatic interactions between LC3’s N-terminal sub-domain (rich in basic amino acids) and acidic residues in the C-terminus of α- and β-tubulin (61). LC3’s triple arginine motif and the N-terminal subdomain previously implicated in tubulin binding are, however, on opposite sides of the LC3 crystal structure, but the basicity of the triple arginine motif could partially contribute to electrostatic interactions with tubulin. MAP1B and SQSTM1 were also identified in cytoplasmic extracts of our MudPIT study and their interaction with LC3 in cytoplasm and role in autophagy is already reported (43, 67). Additionally, Gao et al. showed degradation of LC3 by 20S proteasomes is negatively regulated by SQSTM1 binding to the N- terminus domain of LC3 (68). Hence, SQSTM1 and possibly tubulin binding to the N-teminus of LC3 might prevent proteasomal degradation of nuclear LC3 in addition to facilitating nucleocytoplasmic shuttling of LC3 complexes.
We also identified several possible nuclear LC3 interacting proteins that were previously linked to autophagy. For example, heterogeneous nuclear ribonucleoprotein (hnRNP) A1 has been reported to form a complex with a microRNA that is degraded by autophagy (69). hnRNPs are RNA binding proteins and undergo nucleo-cytoplasmic shuttling in association with mRNA (70). In addition to their role in telomere biogenesis, hnRNP A1 is also involved in mRNA splicing and export while hnRNP D0 reportedly plays a role in mRNA stability and recombination (71). Hence, as a plausible interactor of these proteins, nuclear LC3 may function in nucleocytoplasmic shuttling of RNA.
Previous work demonstrates LC3 binds to fibronectin RNA and associates with the 60S ribosomal subunit in the cytoplasm (26, 72). Our current results show that nuclear LC3 associates with nuclear complexes that specifically localize to the nucleolus—a region rich with ribosomal RNA and ribosomal subunit proteins. The results of our MudPIT analysis on nuclear LC3 interacting proteins revealed at least 4 different 40S ribosomal subunit proteins (Table 3) and multiple 60S ribosomal subunit proteins (Supplementary Table 1) are part of the prospective nuclear LC3 interactome. All four 40S ribosomal proteins are crucial during either nucleolar initiation or later processing stages of 40S ribosome assembly in cytoplasm (73). It has already been reported that ribosomal proteins are synthesized in excess for ribosomal biogenesis, shuttle between nucleolus and nucleoplasm, and associate with slow moving complexes in the nucleoplasm (74). Hence the 40S ribosomal subunit proteins S27, S5, S18 and S20 identified in our MudPIT study could potentially be constituents of the slowly diffusing transient LC3 complexes observed in our FRAP study, serving as a mechanism to prevent their proteasomal degradation and channeling them for ribosomal biogenesis in the nucleolus. Furthermore, 40S ribosomal proteins have been reported to interact with the Mdm2-p53 regulatory axis and cause p53 activation resulting in cell cycle arrest and apoptosis in response to nucleolar stress (75, 76). The possible interaction of LC3 with these proteins under basal conditions might therefore serve as a mechanism to segregate ribosomal proteins from binding to Mdm2, thereby precluding p53 activation and downstream cell cycle disruption under basal steady state. We also identified Ltv1, a protein involved in 40S subunit biogenesis and export in yeast (77).
We found that a number of other nuclear LC3 interacting proteins identified in our current study are either known to be part of the nucleolar proteome or contain putative nucleolar localization signals (Table 5, 6). These included SFPQ, a nuclear protein with reported interactions with gene promoters, DNA repair proteins and long non-coding RNAs (78), and PSME2/PA28β, a regulator of 20S proteasome’s catalytic activity with a reported nucleolar localization in HeLa cells (79). Strikingly, ATG4B, SQSTM1 and MAP1B were among those proteins identified as containing putative NoLS motifs (Table 5, 6). Thus, both known and previously unidentified LC3 protein-protein interactions may play a role in building the LC3 associated complexes that regulate the nuclear enrichment and nucleolar trafficking of LC3. Given these findings, it will be important to more deeply investigate the mechanisms and functional consequences of RNA binding activity and ribosomal associations of LC3 in future studies.
Very recent evidence now indicates that LC3 interacts with lamin B1 and transcriptionally inactive heterochromatin domains referred to as lamin-associated domains (14). Interestingly, we also detected lamin B1 as a nuclear LC3 interacting protein by MudPIT (Supplementary Table 1). Prelamin-A/C and Lamina-associated polypeptide 2 isoform alpha were also identified as candidate nuclear LC3 interacting proteins (Supplementary Table 1). Clearly, much remains to be learned about the mechanisms that target LC3 to various regions of the nucleus, as well as the functions of each population of the protein.
In addition to LC3, a growing number of autophagy-related proteins are now recognized to localize to the nucleus. DOR cycles in and out of the nucleus (80), and is transported out of the nucleus in response to starvation (9, 81, 82). Recent work highlighted the importance of this mechanism for trafficking LC3 out of the nucleus, as nuclear, rather than cytoplasmic, LC3 appears to be targeted to autophagosomes in starved cells (9). SQSTM1, a well-studied selective autophagy receptor in the autophagy pathway, also shuttles in and out of the nucleus (83). Unlike LC3, however, SQSTM1 contains two nuclear localization signals as well as an NES, and nucleocytoplasmic shuttling of SQSTM1 is regulated in a CRM1-dependent manner (83, 84). Other examples of autophagy-related proteins that localize to the nucleus include Beclin-1 (85), ATG5 (86), Raptor (87), Alfy (88), ATG7, ATG5-ATG12, ATG16, ATG4B, and ULK1 (5). Finally, we note that although LC3 has consistently been associated with autophagy over recent years, the very first studies of LC3 proteins did not link them to autophagy (2). In addition to better understanding LC3’s role in autophagy, there is thus a need to study autophagy-independent functions of LC3. The LC3 interacting partners we identified here should represent a useful resource to generate and test new hypotheses regarding the functions of nuclear LC3 in future studies.
In summary, under nutrient-rich conditions, soluble nuclear LC3—regulated by LC3’s triple arginine motif, and to a lesser extent by its hydrophobic binding interface—associates with high-molecular weight complexes that are enriched in the nucleus and continuously survey the nucleolus. Dissociation of LC3 from these large complexes could potentially represent the rate-limiting step for the protein to traffic between the cytoplasm and nucleus. Prospective components of LC3 associated complexes in the nucleus and nucleolus include MAP1B, tubulin, and ribosomal subunit proteins, among others. Determining which of the candidate binding partners of nuclear LC3 are the most important regulators of its steady state localization, as well as the functional consequences of these interactions, will be an important goal for future studies.
MATERIALS AND METHODS
Cells and constructs
HeLa cells (American Type Culture Collection; CCL-2) were cultured in RPMI media (Life Technologies; 11875) containing 10% FBS (Life Technologies, 10437-028), 1% PenStrep and phenol red at 37°C and 5% CO2. Two days before experiments, the cells were plated in glass bottom dishes (Ashland, P35G-1.5-10-C). Fugene 6 (Promega Corp.; E2691) reagent was used to transfect the cells according to the manufacturer’s recommended protocol. Cerulean, Venus, Venus-LC3, and Venus-LC3 mutants were as recently described (17). Venus-LC3R68-70A was created using a site-directed mutagenesis kit (Agilent #200523). The forward primer was TGATCACGTGAATATGAGCGAACTCATCAAGATAATTGCAGCGGCCCTGCAGCTCAATGCTAAC and the reverse primer was GTTAGCATTGAGCTGCAGGGCCGCTGCAATTATCTTGATGAGTTCGCTCATATTCACGTGATCA The NES-Venus-LC3 construct was generated by PCR with forward primer AATTAACCGGTATGCTACCACCGCTTGAGAGACTTACTCTTGTGAGCAAGGGC and reverse primer TTAATTGTACAGCTCGTCCATGCCGAGAGTGATCCCGG. Subsequently, the amplified DNA was inserted into the Venus-C1 vector by digestion with BsrGI and AgeI in the standard fashion.
Imaging
Microscopy experiments were carried out using a Zeiss LSM 510 confocal microscope using a Zeiss 40X 1.3 NA NeoFluar oil immersion objective or 10X Plan-neofluar 0.3 NA objective and an Argon/2 30mW laser (458, 488, 514 nm) and HeNe 633 laser (Carl Zeiss Microscopy, Inc.; Thornwood, NY). Just prior to imaging, for most experiments the media on the cells was exchanged with DMEM without phenol red, containing 50 mM HEPES. Live cell experiments were carried out on a temperature controlled microscope stage set to 37°C.
Starvation and drug treatments
One day after transfection, HeLa cells were rinsed three times with 1X DPBS (Gibco, 14190-144) and subsequently incubated in either starvation media or complete growth media for 1 h, 37 ºC, in a 5% CO2 incubator. Starvation media was prepared by diluting 10 X stock of Earle’s Balanced Salt Solution (EBSS) (Sigma, E7510) in 1X PBS and supplemented with 25 mM HEPES (Corning, 25-060 Cl). After 1 h, nuclei were labeled with 5 mM DRAQ5 (Cell Signaling, 4084L) as per the manufacturer’s protocol. The cells were then imaged in phenol red free DMEM (Gibco, 21063-029) supplemented with 10% fetal bovine serum. Thus, cells were beginning to recover from starvation during imaging.
Where indicated, cells were incubated with 40 nM Leptomycin B (Sigma-Aldrich, L2913) for two hours prior to imaging. Cells were maintained in media containing LMB during imaging.
For chloroquine treatment assays, 100 mM stock of chloroquine (Sigma, C6228) in water was added to cells at a final concentration of 100 μM. Equivolume of water (vehicle) was added for the control treatment. The dishes were incubated for 2 h at 37 ºC prior to imaging in the continuous presence of chloroquine or vehicle. After imaging, dishes were rinsed with 1X DPBS and incubated on ice with 125 μl Cell Lytic M buffer (Sigma, C2978) containing protease inhibitor (Roche, 04693132001) and phosphatase inhibitor cocktail (Roche, 04906845001), for 15 minutes. Following lysis, cells were scraped and freeze-thawed two times. Further, they were spun at 12,000 g, 10 min at 4 ºC and supernatants collected. Equal amounts of protein for each lysate were loaded for SDS-Western blot analysis.
Image-based analysis of nucleocytoplasmic ratios
The nucleocytoplasmic ratio for a given construct of interest was determined by quantitative analysis of confocal images of live cells. Cerulean was co-expressed as an inert marker of both cytoplasm and nucleus. In addition, the cells were labeled with a far red DRAQ5 nuclear label according to the manufacturer’s directions. Confocal images (1 Airy unit pinhole) were acquired for the CFP, YFP, and far red channels. Masks for the cell and nucleus were generated using a manually defined threshold intensity in either the YFP or the far red channel respectively. Masks for the puncta were generated by first subtracting uneven diffuse cellular signal using a median filtering approach. A cytoplasmic mask was created by subtracting the nuclear and puncta masks from the whole cell mask. The nucleocytoplasmic ratio was then defined as the mean intensity of the puncta independent nucleus region divided by the mean intensity of the puncta independent cytoplasm region. All signals were background subtracted by the inverse of the cell mask. Our automated MATLAB image analysis routine to determine nucleocytoplasmic ratios is freely available online at: https://github.com/kraftlj/LocalizeLC3.
Confocal FRAP
To measure the diffusion coefficient of nuclear LC3, confocal FRAP measurements (1 Airy unit pinhole) were performed using a 40X objective as previously described (17) with the following modifications: As illustrated in Figure 4A, we selected a rectangular ROI encompassing a portion of the nucleus. We then photobleached a circular region of interest (10 iterations at 100% power) with a nominal radius (rn) of 1 μm within the nucleus and monitored the recovery over time (20 pre-bleach images, 600 post-bleach images, collected at 41.8 fps, no line-averaging). We fit the recovery profile for the first postbleach image to determine an effective bleach radius, re. Using re, we fit the first 150 data points of the recovery curves from the bleaching ROI to determine the diffusion coefficient, D, and mobile fraction, Mf according to a published equation for two dimensional diffusion (89):
| Equation 1 |
Before fitting, the FRAP data were corrected for photofading as previously described (16). Additional details about the data analysis can be found online at http:www.fraptoolbox.com, including our freely available software tool for FRAP data analysis.
Nucleocytoplasmic FRAP was performed using a 10X Plan-neofluar 0.3 NA objective with the pinhole open. After collecting 5 prebleach images, we photobleached the entire nucleus using a user defined bleaching ROI for 80 bleach iterations, then monitored the recovery by collecting 90 post-bleach images with a 10.4 s interval between images. Prebleach and postbleach images were collected using 4X line averaging using a digital zoom of 8X for 256×256 pixel 12-bit images (pixel size =0.44 μm). The intensity inside the bleach ROI was normalized by the intensity of the whole cell. In these experiments, multiple cells were often bleached and monitored simultaneously, as is shown in Figure 3. Nucleocytoplasmic FRAP curves were fit using a two component exponential model:
| Equation 2 |
The fast component was consistent with diffusion within the compartment, and the slow component was consistent with slower exchange between the nucleus and cytoplasm. For visual simplicity the nucleocytoplasmic transport data is transformed in the figure according to:
| Equation 3 |
The 95% confidence intervals presented in the nucleocytoplasmic transport plots are calculated using the asymptotic standard errors on the estimated parameters.
Nucleolar confocal FRAP experiments (1 Airy unit pinhole) were performed in cells co-transfected with Cerulean (as a marker for the nucleolus) and the indicated Venus-tagged constructs. A rectangular imaging region was selected as shown in Figure 6. FRAP experiments were performed as described above except that a 0.77 μm radius bleach ROI was selected and placed at the center of the nucleolus for nucleolar FRAP measurements. Control experiments were performed using a bleach region placed outside of the nucleolus (but still within the nuclear region) using a similar 0.77 μm radius bleach ROI. The FRAP curves were fit using the diffusion model described above.
Mobile fractions that are corrected for the loss of fluorescence in a compartment were calculated, after complete recovery, by difference between the mean fluorescence in the bleaching ROI, and an adjacent ROI outside of the bleach region.
Estimates of molecular weight of Venus-LC3 associated complexes
Diffusion coefficients were used to calculate effective molecular weights assuming a spherical geometry using the Stokes-Einstein equation:
| Equation 4 |
where kB is Boltzmann’s constant, T is temperature, r is the Stokes radius, and η is viscosity. The diffusion coefficient of an empty Venus control (27 kDa) was used to estimate the viscosity term.
Nucleolar ratio measurements
To quantify the nucleolar ratios, cells were co-transfected with Cerulean (to identify nucleoli) and the indicated Venus-tagged construct. Using ImageJ, ROIs were drawn manually around each nucleolus for a particular cell and the mean intensity was measured. The mean intensity of the nucleoplasm pool, outside of nucleoli, was likewise measured manually. The mean intensity values for both regions were background subtracted before calculating the ratio of nucleolus to nucleoplasm.
Immunostaining for nucleolar marker
HeLa cells expressing Cerulean were fixed in 2% PFA for 15 minutes at RT, blocked for 15 min at RT, and labeled with mouse anti-fibrillarin (Abcam, ab4566) for 30 min at 1:100 dilution in blocking solution. They were then rinsed several times in PBS, labeled with a Cy5 secondary antibody for 30 min at RT, and rinsed again. They were then fixed in 4% PFA for 15 minutes at RT and rinsed prior to mounting in ProLong (Thermo-Fisher Scientific).
Nuclear-Cytoplasmic fractionation
HeLa cells plated in 10 cm dish (Corning, 353003) at 50–70 % confluency were transfected with either Venus or Venus-LC3 as described above. The next day, cells were washed with 1X DPBS (Gibco, 14190-144) and trypsinized (Gibco, 25200056) for 2 min at 37 ºC. After neutralizing trypsin with complete growth media, cells from two 10 cm dishes transfected with the same construct were pooled and pelleted by centrifugation (500 RCF, 10 min, 4 ºC). Cell pellets were washed with 1X DPBS buffer twice (500 RCF, 5 min, 4 ºC). All subsequent steps were carried out in the cold.
Nuclear and cytoplasmic fractions for each construct were isolated using a modification of a published procedure (90). Cell pellets were re-suspended in 100 μl CLB buffer (10 mM HEPES, 10 mM NaCl, 1mM KH2PO4, 5 mM NaHCO3, 5 mM EDTA, 1mM CaCl2, 0.5 mM MgCl2, phosphatase inhibitor and protease inhibitor cocktail) and incubated for 5 min. After homogenizing the cells with a 27 G ½ needle (BD, 305109), 10 μl of 2.5 M sucrose was added followed by spinning at 6300 RCF for 5 min. The supernatant represents the cytoplasmic extract and was transferred to a fresh tube. The pellet was homogenized in 100 μl CLB-2.5 M sucrose and the supernatant obtained following centrifugation was pooled with previous cytoplasmic extract. The pellet was washed with 150 μl TSE (10 mM Tris, 300 mM sucrose, 1 mM EDTA, 0.1 % NP-40, pH 7.5) 3 times and supernatants were stored after centrifugation (4000 RCF, 5 min). The pellets represent purified nuclei and were re-suspended in 100 μl NEB (200 mM NaCl, 7 mM Na2HPO4, 3 mM NaH2PO4, pH 7.4) and incubated for 30 min, RT with brief vortexing every 5 min. Finally, the re-suspended nuclei pellet and cytoplasmic extract were centrifuged (14,000 RCF, 30 min) and supernatants representing clarified nuclear and cytoplasmic fraction were removed and stored in fresh tubes for immunoprecipitation.
As a quality control check, aliquots containing equal protein amounts from all nuclear and cytoplasmic fractions were blotted for positive nuclear (HDAC2, Thermo Scientific, PA1-861) and cytoplasmic (β Tubulin, DSHB, E7) markers.
Immunoprecipitation
Nuclear and cytoplasmic fractions for each construct were isolated and pooled separately. A total of 200 μg of protein (SM; starting material) was used for each IP. Lysates were cleared using centrifugation (10,000 RCF, 10 min, 4 ºC) and supernatants were subjected to immunoprecipitation with 40 μl of GFP binding Sepharose (Vanderbilt Antibody and Protein Resource, VAPR) resin (50 % slurry) for 2 h at 4 ºC with gentle inversion. After removing the unbound fraction, the resin containing the protein complexes was washed 4 times with 200 μl of ice cold 1X PBS and washouts (WO) were stored for SDS-western blot analysis. Protein complexes bound to the resin were eluted by incubating the resin in sample buffer containing 1X LDS (Novex, NP0007) and 1X reducing agent (Novex, NP0009) for 30 min at RT followed by a 10 min incubation at 70 ºC. Clear supernatant (elutions) were collected by centrifugation at 1000 RCF for 10 min at RT. All centrifugations for IP were performed at 1000 RCF for 2 min as per the manufacturer’s recommended protocol. A fraction of input, unbound fraction, washes and elutions were analyzed by SDS-PAGE followed by Western blotting. LC-MS/MS and MudPIT were carried out using the rest of the eluted samples.
Antibodies and dilutions for Western blotting
A combination of rabbit polyclonal anti-MAP1LC3B (Novus, NB100-2220) at 1:5000 and mouse monoclonal anti-β-Tubulin (DSHB, E7) at 1:2000 dilution was used for Western blotting of chloroquine treated cell lysates.
A combination of rabbit polyclonal anti-HDAC2 (Thermo Scientific, PA1-861) at 1:3000 and mouse monoclonal anti-β-Tubulin (DSHB, E7) at 1:2000 was used as positive controls for the nuclear and cytoplasmic fractions, respectively. A combination of mouse monoclonal anti-GFP (Clontech, 632381) at 1:2000 and rabbit polyclonal anti-MAP1LC3B (Novus, NB100-2220) at 1:5000 was used to analyze the IP fractions. For validation of the MudPIT results, Western blots were probed with either mouse monoclonal anti-SQSTM1 (BD, 610832) at 1:2000 dilution or goat polyclonal anti-MAP1B (Santa Cruz, sc-8970) at 1:100 dilution in combination with rabbit polyclonal anti-MAP1LC3B (Novus, NB100-2220) at 1:5000.
Secondary antibodies used for Western blotting included goat anti-rabbit IRDye-800CW (LI-COR, 926-32211), goat anti mouse IRDye 680 LT (LI-COR, 926-68020), donkey anti-goat IRDye-800CW (926-32214), donkey anti-rabbit IRDye 680 LT (926-68023).
Mass Spectrometry
Eluted IP fractions for nuclear and cytoplasmic Venus and Venus-LC3 were partly resolved by SDS electrophoresis on a 10 % Bis-tris gel (Novex, NW00100BOX) up to ~ 1.5 cm followed by Colloidal Coomassie staining (Life Technologies). Lanes containing protein bands were excised and digested with trypsin (Promega Gold) to yield peptides. The resulting peptides were analyzed via multi-dimensional protein identification technology (MudPIT) as described elsewhere (91). Briefly, digested peptides were loaded onto a biphasic pre-column consisting of 4 cm of C-18 reversed phase (RP) resin (Jupiter; Phenomenex) followed by 4 cm of strong cation exchange resin (Luna SCX; Phenomenex). Once loaded, this column was placed in line with a 100 μm X 20 cm C-18 RP analytical column (3 μm, 300Å, Jupiter C18, Phenomenex) packed into a nanospray emitter tip directly coupled to an LTQ linear ion trap mass spectrometer (Thermo Scientific, San Jose). A subset of peptides was eluted from the SCX material onto the RP analytical via a pulse of ammonium acetate in 0.1 % formic acid. Those peptides were separated by a 105 minute RP gradient (2–40 % acetonitrile gradient) run at 500 nl/minute, and then ionized and further separated according their m/z in the mass spectrometer. This proceeded for a total of eight salt elution steps over the course of approximately 16 hours of data acquisition. Both the intact masses (MS) and fragmentation spectra (MS/MS) of the peptides were collected and the peptide MS/MS spectral data searched against the human protein database to which common contaminating proteins had been appended using Sequest (92). A reversed version of each of the protein was also added to the database to allow for estimates of false discovery rate (FDR). Resulting identifications were collated and filtered using IDPicker3 (93) and Scaffold (http://www.proteomesoftware.com).
Identification of nucleolar localization sequences
Nucleolar localization sequences were identified using open access software (40).
Statistics
Values reported throughout the text are the mean ± 95% confidence intervals. Statistical comparisons were made using Bonferonni corrected t-tests where appropriate.
Supplementary Material
Figure S1 (associated with Figure 1). LC3 and its mutants show differential behavior in presence of the lysosomal inhibitor chloroquine under basal conditions. (A) Representative confocal images of HeLa cells expressing the \ indicated constructs under basal conditions (top) or following treatment with 100 μM Chloroquine for 2 h (bottom). Scale bar, 10 μm. (B) HeLa cells were transfected with the indicated constructs and either untreated or treated with chloroquine. Total cell lysates were prepared and analyzed by SDS-PAG followed by Western blotting with anti-MAP1LC3B and anti-tubulin antibodies. Recombinant Venus-LC3 runs as a band at ~42 kDa due to additional ~27 kDa Venus tag. LC3-I is detected as upper band and LC3-II as lower band.
Figure S2 (associated with Figure 1). LC3 and its mutants do not undergo CRM1-mediated active nuclear export under basal conditions. (A) Confocal images of HeLa cells expressing the indicated constructs under basal conditions or following treatment with Leptomycin B (LMB) for 2 h. Scale bar, 10 μm. (B) Quantification of the N/C ratios for the indicated constructs under basal conditions (light gray bars, taken from Figure 1C) or following 2 h of LMB treatment (dark gray bars). Error bars are 95% confidence intervals. N = 30 cells for Venus-LC3, Venus, and F52A L53A; 40 for R70A and G120A; 29 for R68-70A, and 10 for NES-LC3 under LMB conditions. One way ANOVA p<1×10⁻⁴. Bonferroni corrected t-tests for the N/C ratios of each construct under basal conditions compared to LMB conditions. ns p>0.05; *** p≤0.001.
Figure S3 (associated with Figure 5). Control experiments verifying that Cerulean is excluded from nucleoli whereas Venus-LC3 is not. HeLa cells expression Cerulean (A) or Venus-LC3 (B) were fixed and immunostained for endogenous fibrillarin, a marker of nucleoli. Scale bar, 10 μm. Note that the exclusion of Cerulean from nucleoliis more clearly apparent in live cells than in fixed cells.
Table S1 (associated with Tables 3 and 4). List of proteins co-immunoprecipitated with Venus or Venus-LC3 from nuclear and cytoplasmic fractions of HeLa cells under basal conditions as obtained by MudPIT analysis.
Synopsis.
A key component of the autophagy pathway, LC3 contributes to both autophagosome formation and cargo selection. LC3 is also present in the nucleus under basal conditions, but the mechanisms that facilitate the nuclear targeting and trafficking of LC3 between the nucleus and cytoplasm are poorly understood. Here, we show that LC3 is retained in the nucleus in association with high molecular weight complexes, and also accesses the nucleolus. In addition, we identify a series of candidate nuclear LC3 interacting proteins.
Acknowledgments
We thank Kimberly Drake for expert technical assistance, Hayes McDonald for advice regarding the mass spectrometry experiments, and Christian Behrends for helpful discussion during early stages of this study. This work was funded by grant NSF/DMS 0970008 from the National Science Foundation, VICTR resources (CTSA Award No. UL1TR000445 from NCATS), and utilized the core(s) of the Vanderbilt Diabetes Research and Training Center funded by grant DK020593 from the National Institute of Diabetes and Digestive and Kidney Disease. The funding sources had no role in the study design, collection, analysis or interpretation of data, writing the report, or the decision to submit the paper for publication.
References
- 1.Shpilka T, Weidberg H, Pietrokovski S, Elazar Z. Atg8: an autophagy-related ubiquitin-like protein family. Genome Biol. 2011;12(7):226. doi: 10.1186/gb-2011-12-7-226. [DOI] [PMC free article] [PubMed] [Google Scholar]
- 2.Wild P, McEwan DG, Dikic I. The LC3 interactome at a glance. J Cell Sci. 2014;127(Pt 1):3–9. doi: 10.1242/jcs.140426. [DOI] [PubMed] [Google Scholar]
- 3.Karim MR, Kanazawa T, Daigaku Y, Fujimura S, Miotto G, Kadowaki M. Cytosolic LC3 ratio as a sensitive index of macroautophagy in isolated rat hepatocytes and H4-II-E cells. Autophagy. 2007;3(6):553–560. doi: 10.4161/auto.4615. [DOI] [PubMed] [Google Scholar]
- 4.Drake KR, Kang M, Kenworthy AK. Nucleocytoplasmic distribution and dynamics of the autophagosome marker EGFP-LC3. PLoS ONE. 2010;5(3):e9806. doi: 10.1371/journal.pone.0009806. [DOI] [PMC free article] [PubMed] [Google Scholar]
- 5.Martinez-Lopez N, Athonvarangkul D, Mishall P, Sahu S, Singh R. Autophagy proteins regulate ERK phosphorylation. Nat Commun. 2013;4:2799. doi: 10.1038/ncomms3799. [DOI] [PMC free article] [PubMed] [Google Scholar]
- 6.Fujita N, Hayashi-Nishino M, Fukumoto H, Omori H, Yamamoto A, Noda T, Yoshimori T. An Atg4B mutant hampers the lipidation of LC3 paralogues and causes defects in autophagosome closure. Mol Biol Cell. 2008;19(11):4651–4659. doi: 10.1091/mbc.E08-03-0312. [DOI] [PMC free article] [PubMed] [Google Scholar]
- 7.Buckingham EM, Carpenter JE, Jackson W, Grose C. Nuclear LC3-positive puncta in stressed cells do not represent autophagosomes. Biotechniques. 2014;57(5):241–244. doi: 10.2144/000114226. [DOI] [PMC free article] [PubMed] [Google Scholar]
- 8.He W, Hu CX, Hou JK, Fan L, Xu YW, Liu MH, Yan SY, Chen GQ, Huang Y. Microtubule-associated protein 1 light chain 3 interacts with and contributes to growth inhibiting effect of PML. PLoS One. 2014;9(11):e113089. doi: 10.1371/journal.pone.0113089. [DOI] [PMC free article] [PubMed] [Google Scholar]
- 9.Huang R, Xu Y, Wan W, Shou X, Qian J, You Z, Liu B, Chang C, Zhou T, Lippincott-Schwartz J, Liu W. Deacetylation of Nuclear LC3 Drives Autophagy Initiation under Starvation. Mol Cell. 2015;57(3):456–466. doi: 10.1016/j.molcel.2014.12.013. [DOI] [PubMed] [Google Scholar]
- 10.Chen GY, Meng CL, Lin KC, Tuan HY, Yang HJ, Chen CL, Li KC, Chiang CS, Hu YC. Graphene oxide as a chemosensitizer: diverted autophagic flux, enhanced nuclear import, elevated necrosis and improved antitumor effects. Biomaterials. 2015;40:12–22. doi: 10.1016/j.biomaterials.2014.11.034. [DOI] [PubMed] [Google Scholar]
- 11.He H, Dang Y, Dai F, Guo Z, Wu J, She X, Pei Y, Chen Y, Ling W, Wu C, Zhao S, Liu JO, Yu L. Post-translational modifications of three members of the human MAP1LC3 family and detection of a novel type of modification for MAP1LC3B. J Biol Chem. 2003;278(31):29278–29287. doi: 10.1074/jbc.M303800200. [DOI] [PubMed] [Google Scholar]
- 12.Kabeya Y, Mizushima N, Yamamoto A, Oshitani-Okamoto S, Ohsumi Y, Yoshimori T. LC3, GABARAP and GATE16 localize to autophagosomal membrane depending on form-II formation. J Cell Sci. 2004;117(Pt 13):2805–2812. doi: 10.1242/jcs.01131. [DOI] [PubMed] [Google Scholar]
- 13.Geng J, Klionsky DJ. The Atg8 and Atg12 ubiquitin-like conjugation systems in macroautophagy. ‘Protein modifications: beyond the usual suspects’ review series. EMBO Rep. 2008;9(9):859–864. doi: 10.1038/embor.2008.163. [DOI] [PMC free article] [PubMed] [Google Scholar]
- 14.Dou Z, Xu C, Donahue G, Shimi T, Pan JA, Zhu J, Ivanov A, Capell BC, Drake AM, Shah PP, Catanzaro JM, Daniel Ricketts M, Lamark T, Adam SA, Marmorstein R, et al. Autophagy mediates degradation of nuclear lamina. Nature. 2015;527(7576):105–109. doi: 10.1038/nature15548. [DOI] [PMC free article] [PubMed] [Google Scholar]
- 15.Sugawara K, Suzuki NN, Fujioka Y, Mizushima N, Ohsumi Y, Inagaki F. The crystal structure of microtubule-associated protein light chain 3, a mammalian homologue of Saccharomyces cerevisiae Atg8. Genes Cells. 2004;9(7):611–618. doi: 10.1111/j.1356-9597.2004.00750.x. [DOI] [PubMed] [Google Scholar]
- 16.Kraft LJ, Kenworthy AK. Imaging protein complex formation in the autophagy pathway: analysis of the interaction of LC3 and Atg4B(C74A) in live cells using Forster resonance energy transfer and fluorescence recovery after photobleaching. J Biomed Opt. 2012;17(1):011008. doi: 10.1117/1.JBO.17.1.011008. [DOI] [PMC free article] [PubMed] [Google Scholar]
- 17.Kraft LJ, Nguyen TA, Vogel SS, Kenworthy AK. Size, stoichiometry, and organization of soluble LC3-associated complexes. Autophagy. 2014;10(5):861–877. doi: 10.4161/auto.28175. [DOI] [PMC free article] [PubMed] [Google Scholar]
- 18.Tanida I, Yamaji T, Ueno T, Ishiura S, Kominami E, Hanada K. Consideration about negative controls for LC3 and expression vectors for four colored fluorescent protein-LC3 negative controls. Autophagy. 2008;4(1):131–134. doi: 10.4161/auto.5233. [DOI] [PubMed] [Google Scholar]
- 19.Yates JR., 3rd The revolution and evolution of shotgun proteomics for large-scale proteome analysis. J Am Chem Soc. 2013;135(5):1629–1640. doi: 10.1021/ja3094313. [DOI] [PMC free article] [PubMed] [Google Scholar]
- 20.Banks CA, Kong SE, Washburn MP. Affinity purification of protein complexes for analysis by multidimensional protein identification technology. Protein Expr Purif. 2012;86(2):105–119. doi: 10.1016/j.pep.2012.09.007. [DOI] [PubMed] [Google Scholar]
- 21.Shvets E, Fass E, Scherz-Shouval R, Elazar Z. The N-terminus and Phe52 residue of LC3 recruit p62/SQSTM1 into autophagosomes. J Cell Sci. 2008;121(Pt 16):2685–2695. doi: 10.1242/jcs.026005. [DOI] [PubMed] [Google Scholar]
- 22.Behrends C, Sowa ME, Gygi SP, Harper JW. Network organization of the human autophagy system. Nature. 2010;466(7302):68–76. doi: 10.1038/nature09204. [DOI] [PMC free article] [PubMed] [Google Scholar]
- 23.Noda NN, Kumeta H, Nakatogawa H, Satoo K, Adachi W, Ishii J, Fujioka Y, Ohsumi Y, Inagaki F. Structural basis of target recognition by Atg8/LC3 during selective autophagy. Genes Cells. 2008;13(12):1211–1218. doi: 10.1111/j.1365-2443.2008.01238.x. [DOI] [PubMed] [Google Scholar]
- 24.Johansen T, Lamark T. Selective autophagy mediated by autophagic adapter proteins. Autophagy. 2011;7(3):279–296. doi: 10.4161/auto.7.3.14487. [DOI] [PMC free article] [PubMed] [Google Scholar]
- 25.Alemu EA, Lamark T, Torgersen KM, Birgisdottir AB, Larsen KB, Jain A, Olsvik H, Overvatn A, Kirkin V, Johansen T. ATG8 family proteins act as scaffolds for assembly of the ULK complex: sequence requirements for LC3-interacting region (LIR) motifs. J Biol Chem. 2012;287(47):39275–39290. doi: 10.1074/jbc.M112.378109. [DOI] [PMC free article] [PubMed] [Google Scholar]
- 26.Zhou B, Boudreau N, Coulber C, Hammarback J, Rabinovitch M. Microtubule-associated protein 1 light chain 3 is a fibronectin mRNA-binding protein linked to mRNA translation in lamb vascular smooth muscle cells. J Clin Invest. 1997;100(12):3070–3082. doi: 10.1172/JCI119862. [DOI] [PMC free article] [PubMed] [Google Scholar]
- 27.Ying L, Lau A, Alvira CM, West R, Cann GM, Zhou B, Kinnear C, Jan E, Sarnow P, Van de Rijn M, Rabinovitch M. LC3-mediated fibronectin mRNA translation induces fibrosarcoma growth by increasing connective tissue growth factor. J Cell Sci. 2009;122(Pt 9):1441–1451. doi: 10.1242/jcs.025957. [DOI] [PMC free article] [PubMed] [Google Scholar]
- 28.Liu C, Ma H, Wu J, Huang Q, Liu JO, Yu L. Arginine68 is an essential residue for the C-terminal cleavage of human Atg8 family proteins. BMC Cell Biol. 2013;14:27. doi: 10.1186/1471-2121-14-27. [DOI] [PMC free article] [PubMed] [Google Scholar]
- 29.Wei X, Henke VG, Strubing C, Brown EB, Clapham DE. Real-time imaging of nuclear permeation by EGFP in single intact cells. Biophys J. 2003;84(2 Pt 1):1317–1327. doi: 10.1016/S0006-3495(03)74947-9. [DOI] [PMC free article] [PubMed] [Google Scholar]
- 30.Paine PL, Moore LC, Horowitz SB. Nuclear envelope permeability. Nature. 1975;254(5496):109–114. doi: 10.1038/254109a0. [DOI] [PubMed] [Google Scholar]
- 31.Peters R. Nuclear envelope permeability measured by fluorescence microphotolysis of single liver cell nuclei. J Biol Chem. 1983;258(19):11427–11429. [PubMed] [Google Scholar]
- 32.Terry LJ, Shows EB, Wente SR. Crossing the nuclear envelope: hierarchical regulation of nucleocytoplasmic transport. Science. 2007;318(5855):1412–1416. doi: 10.1126/science.1142204. [DOI] [PubMed] [Google Scholar]
- 33.Kang M, Kenworthy AK. A closed-form analytic expression for FRAP formula for the binding diffusion model. Biophys J. 2008;95(2):L13–15. doi: 10.1529/biophysj.108.135913. [DOI] [PMC free article] [PubMed] [Google Scholar]
- 34.Sprague BL, McNally JG. FRAP analysis of binding: proper and fitting. Trends Cell Biol. 2005;15(2):84–91. doi: 10.1016/j.tcb.2004.12.001. [DOI] [PubMed] [Google Scholar]
- 35.Sprague BL, Pego RL, Stavreva DA, McNally JG. Analysis of binding reactions by fluorescence recovery after photobleaching. Biophys J. 2004;86(6):3473–3495. doi: 10.1529/biophysj.103.026765. [DOI] [PMC free article] [PubMed] [Google Scholar]
- 36.Kang M, Day CA, DiBenedetto E, Kenworthy AK. A quantitative approach to analyze binding diffusion kinetics by confocal FRAP. Biophys J. 2010;99(9):2737–2747. doi: 10.1016/j.bpj.2010.09.013. [DOI] [PMC free article] [PubMed] [Google Scholar]
- 37.McNally JG. Quantitative FRAP in analysis of molecular binding dynamics in vivo. Methods Cell Biol. 2008;85:329–351. doi: 10.1016/S0091-679X(08)85014-5. [DOI] [PubMed] [Google Scholar]
- 38.Leung AK, Andersen JS, Mann M, Lamond AI. Bioinformatic analysis of the nucleolus. Biochem J. 2003;376(Pt 3):553–569. doi: 10.1042/BJ20031169. [DOI] [PMC free article] [PubMed] [Google Scholar]
- 39.Scott MS, Boisvert FM, McDowall MD, Lamond AI, Barton GJ. Characterization and prediction of protein nucleolar localization sequences. Nucleic Acids Res. 2010;38(21):7388–7399. doi: 10.1093/nar/gkq653. [DOI] [PMC free article] [PubMed] [Google Scholar]
- 40.Scott MS, Troshin PV, Barton GJ. NoD: a Nucleolar localization sequence detector for eukaryotic and viral proteins. BMC Bioinformatics. 2011;12:317. doi: 10.1186/1471-2105-12-317. [DOI] [PMC free article] [PubMed] [Google Scholar]
- 41.Emmott E, Hiscox JA. Nucleolar targeting: the hub of the matter. EMBO Rep. 2009;10(3):231–238. doi: 10.1038/embor.2009.14. [DOI] [PMC free article] [PubMed] [Google Scholar]
- 42.Wuhr M, Guttler T, Peshkin L, McAlister GC, Sonnett M, Ishihara K, Groen AC, Presler M, Erickson BK, Mitchison TJ, Kirschner MW, Gygi SP. The nuclear proteome of a vertebrate. Curr Biol. 2015;25(20):2663–2671. doi: 10.1016/j.cub.2015.08.047. [DOI] [PMC free article] [PubMed] [Google Scholar]
- 43.Pankiv S, Clausen TH, Lamark T, Brech A, Bruun JA, Outzen H, Overvatn A, Bjorkoy G, Johansen T. p62/SQSTM1 binds directly to Atg8/LC3 to facilitate degradation of ubiquitinated protein aggregates by autophagy. J Biol Chem. 2007;282(33):24131–24145. doi: 10.1074/jbc.M702824200. [DOI] [PubMed] [Google Scholar]
- 44.Mann SS, Hammarback JA. Molecular characterization of light chain 3. A microtubule binding subunit of MAP1A and MAP1B. J Biol Chem. 1994;269(15):11492–11497. [PubMed] [Google Scholar]
- 45.Vollmer M, Horth P, Rozing G, Coute Y, Grimm R, Hochstrasser D, Sanchez JC. Multi-dimensional HPLC/MS of the nucleolar proteome using HPLC-chip/MS. J Sep Sci. 2006;29(4):499–509. doi: 10.1002/jssc.200500334. [DOI] [PubMed] [Google Scholar]
- 46.Scherl A, Coute Y, Deon C, Calle A, Kindbeiter K, Sanchez JC, Greco A, Hochstrasser D, Diaz JJ. Functional proteomic analysis of human nucleolus. Mol Biol Cell. 2002;13(11):4100–4109. doi: 10.1091/mbc.E02-05-0271. [DOI] [PMC free article] [PubMed] [Google Scholar]
- 47.Andersen JS, Lyon CE, Fox AH, Leung AK, Lam YW, Steen H, Mann M, Lamond AI. Directed proteomic analysis of the human nucleolus. Curr Biol. 2002;12(1):1–11. doi: 10.1016/s0960-9822(01)00650-9. [DOI] [PubMed] [Google Scholar]
- 48.Andersen JS, Lam YW, Leung AK, Ong SE, Lyon CE, Lamond AI, Mann M. Nucleolar proteome dynamics. Nature. 2005;433(7021):77–83. doi: 10.1038/nature03207. [DOI] [PubMed] [Google Scholar]
- 49.Carmo-Fonseca M, Mendes-Soares L, Campos I. To be or not to be in the nucleolus. Nat Cell Biol. 2000;2(6):E107–112. doi: 10.1038/35014078. [DOI] [PubMed] [Google Scholar]
- 50.Dross N, Spriet C, Zwerger M, Muller G, Waldeck W, Langowski J. Mapping eGFP oligomer mobility in living cell nuclei. PLoS ONE. 2009;4(4):e5041. doi: 10.1371/journal.pone.0005041. [DOI] [PMC free article] [PubMed] [Google Scholar]
- 51.Seibel NM, Eljouni J, Nalaskowski MM, Hampe W. Nuclear localization of enhanced green fluorescent protein homomultimers. Anal Biochem. 2007;368(1):95–99. doi: 10.1016/j.ab.2007.05.025. [DOI] [PubMed] [Google Scholar]
- 52.Pack C, Saito K, Tamura M, Kinjo M. Microenvironment and effect of energy depletion in the nucleus analyzed by mobility of multiple oligomeric EGFPs. Biophys J. 2006;91(10):3921–3936. doi: 10.1529/biophysj.105.079467. [DOI] [PMC free article] [PubMed] [Google Scholar]
- 53.Musinova YR, Lisitsyna OM, Golyshev SA, Tuzhikov AI, Polyakov VY, Sheval EV. Nucleolar localization/retention signal is responsible for transient accumulation of histone H2B in the nucleolus through electrostatic interactions. Biochim Biophys Acta. 2011;1813(1):27–38. doi: 10.1016/j.bbamcr.2010.11.003. [DOI] [PubMed] [Google Scholar]
- 54.Coute Y, Burgess JA, Diaz JJ, Chichester C, Lisacek F, Greco A, Sanchez JC. Deciphering the human nucleolar proteome. Mass Spectrom Rev. 2006;25(2):215–234. doi: 10.1002/mas.20067. [DOI] [PubMed] [Google Scholar]
- 55.Fong KW, Li Y, Wang W, Ma W, Li K, Qi RZ, Liu D, Songyang Z, Chen J. Whole-genome screening identifies proteins localized to distinct nuclear bodies. J Cell Biol. 2013;203(1):149–164. doi: 10.1083/jcb.201303145. [DOI] [PMC free article] [PubMed] [Google Scholar]
- 56.Koukourakis MI, Kalamida D, Giatromanolaki A, Zois CE, Sivridis E, Pouliliou S, Mitrakas A, Gatter KC, Harris AL. Autophagosome proteins LC3A, LC3B and LC3C have distinct subcellular distribution kinetics and expression in cancer cell lines. PLoS One. 2015;10(9):e0137675. doi: 10.1371/journal.pone.0137675. [DOI] [PMC free article] [PubMed] [Google Scholar]
- 57.Audas TE, Jacob MD, Lee S. Immobilization of proteins in the nucleolus by ribosomal intergenic spacer noncoding RNA. Mol Cell. 2012;45(2):147–157. doi: 10.1016/j.molcel.2011.12.012. [DOI] [PubMed] [Google Scholar]
- 58.Mekhail K, Rivero-Lopez L, Al-Masri A, Brandon C, Khacho M, Lee S. Identification of a common subnuclear localization signal. Mol Biol Cell. 2007;18(10):3966–3977. doi: 10.1091/mbc.E07-03-0295. [DOI] [PMC free article] [PubMed] [Google Scholar]
- 59.Shao Y, Gao Z, Feldman T, Jiang X. Stimulation of ATG12-ATG5 conjugation by ribonucleic acid. Autophagy. 2007;3(1):10–16. doi: 10.4161/auto.3270. [DOI] [PubMed] [Google Scholar]
- 60.Wang QJ, Ding Y, Kohtz DS, Mizushima N, Cristea IM, Rout MP, Chait BT, Zhong Y, Heintz N, Yue Z. Induction of autophagy in axonal dystrophy and degeneration. J Neurosci. 2006;26(31):8057–8068. doi: 10.1523/JNEUROSCI.2261-06.2006. [DOI] [PMC free article] [PubMed] [Google Scholar]
- 61.Kouno T, Mizuguchi M, Tanida I, Ueno T, Kanematsu T, Mori Y, Shinoda H, Hirata M, Kominami E, Kawano K. Solution structure of microtubule-associated protein light chain 3 and identification of its functional subdomains. J Biol Chem. 2005;280(26):24610–24617. doi: 10.1074/jbc.M413565200. [DOI] [PubMed] [Google Scholar]
- 62.Walss C, Kreisberg JI, Luduena RF. Presence of the betaII isotype of tubulin in the nuclei of cultured mesangial cells from rat kidney. Cell Motil Cytoskeleton. 1999;42(4):274–284. doi: 10.1002/(SICI)1097-0169(1999)42:4<274::AID-CM2>3.0.CO;2-5. [DOI] [PubMed] [Google Scholar]
- 63.Yanagida M, Hayano T, Yamauchi Y, Shinkawa T, Natsume T, Isobe T, Takahashi N. Human fibrillarin forms a sub-complex with splicing factor 2-associated p32, protein arginine methyltransferases, and tubulins alpha 3 and beta 1 that is independent of its association with preribosomal ribonucleoprotein complexes. J Biol Chem. 2004;279(3):1607–1614. doi: 10.1074/jbc.M305604200. [DOI] [PubMed] [Google Scholar]
- 64.Walss-Bass C, Xu K, David S, Fellous A, Luduena RF. Occurrence of nuclear beta(II)-tubulin in cultured cells. Cell Tissue Res. 2002;308(2):215–223. doi: 10.1007/s00441-002-0539-6. [DOI] [PubMed] [Google Scholar]
- 65.Goo YH, Sohn YC, Kim DH, Kim SW, Kang MJ, Jung DJ, Kwak E, Barlev NA, Berger SL, Chow VT, Roeder RG, Azorsa DO, Meltzer PS, Suh PG, Song EJ, et al. Activating signal cointegrator 2 belongs to a novel steady-state complex that contains a subset of trithorax group proteins. Mol Cell Biol. 2003;23(1):140–149. doi: 10.1128/MCB.23.1.140-149.2003. [DOI] [PMC free article] [PubMed] [Google Scholar]
- 66.Akoumianaki T, Kardassis D, Polioudaki H, Georgatos SD, Theodoropoulos PA. Nucleocytoplasmic shuttling of soluble tubulin in mammalian cells. J Cell Sci. 2009;122(Pt 8):1111–1118. doi: 10.1242/jcs.043034. [DOI] [PubMed] [Google Scholar]
- 67.Monastyrska I, Rieter E, Klionsky DJ, Reggiori F. Multiple roles of the cytoskeleton in autophagy. Biol Rev Camb Philos Soc. 2009;84(3):431–448. doi: 10.1111/j.1469-185X.2009.00082.x. [DOI] [PMC free article] [PubMed] [Google Scholar]
- 68.Gao Z, Gammoh N, Wong PM, Erdjument-Bromage H, Tempst P, Jiang X. Processing of autophagic protein LC3 by the 20S proteasome. Autophagy. 2010;6(1):126–137. doi: 10.4161/auto.6.1.10928. [DOI] [PubMed] [Google Scholar]
- 69.Fujiya M, Konishi H, Mohamed Kamel MK, Ueno N, Inaba Y, Moriichi K, Tanabe H, Ikuta K, Ohtake T, Kohgo Y. microRNA-18a induces apoptosis in colon cancer cells via the autophagolysosomal degradation of oncogenic heterogeneous nuclear ribonucleoprotein A1. Oncogene. 2014;33(40):4847–4856. doi: 10.1038/onc.2013.429. [DOI] [PubMed] [Google Scholar]
- 70.Dreyfuss G, Kim VN, Kataoka N. Messenger-RNA-binding proteins and the messages they carry. Nat Rev Mol Cell Biol. 2002;3(3):195–205. doi: 10.1038/nrm760. [DOI] [PubMed] [Google Scholar]
- 71.Chaudhury A, Chander P, Howe PH. Heterogeneous nuclear ribonucleoproteins (hnRNPs) in cellular processes: Focus on hnRNP E1’s multifunctional regulatory roles. RNA. 2010;16(8):1449–1462. doi: 10.1261/rna.2254110. [DOI] [PMC free article] [PubMed] [Google Scholar]
- 72.Zhou B, Rabinovitch M. Microtubule involvement in translational regulation of fibronectin expression by light chain 3 of microtubule-associated protein 1 in vascular smooth muscle cells. Circ Res. 1998;83(5):481–489. doi: 10.1161/01.res.83.5.481. [DOI] [PubMed] [Google Scholar]
- 73.O’Donohue MF, Choesmel V, Faubladier M, Fichant G, Gleizes PE. Functional dichotomy of ribosomal proteins during the synthesis of mammalian 40S ribosomal subunits. J Cell Biol. 2010;190(5):853–866. doi: 10.1083/jcb.201005117. [DOI] [PMC free article] [PubMed] [Google Scholar]
- 74.Lam YW, Lamond AI, Mann M, Andersen JS. Analysis of nucleolar protein dynamics reveals the nuclear degradation of ribosomal proteins. Curr Biol. 2007;17(9):749–760. doi: 10.1016/j.cub.2007.03.064. [DOI] [PMC free article] [PubMed] [Google Scholar]
- 75.Daftuar L, Zhu Y, Jacq X, Prives C. Ribosomal proteins RPL37, RPS15 and RPS20 regulate the Mdm2-p53-MdmX network. PLoS One. 2013;8(7):e68667. doi: 10.1371/journal.pone.0068667. [DOI] [PMC free article] [PubMed] [Google Scholar]
- 76.Xiong X, Zhao Y, He H, Sun Y. Ribosomal protein S27-like and S27 interplay with p53-MDM2 axis as a target, a substrate and a regulator. Oncogene. 2011;30(15):1798–1811. doi: 10.1038/onc.2010.569. [DOI] [PMC free article] [PubMed] [Google Scholar]
- 77.Seiser RM, Sundberg AE, Wollam BJ, Zobel-Thropp P, Baldwin K, Spector MD, Lycan DE. Ltv1 is required for efficient nuclear export of the ribosomal small subunit in Saccharomyces cerevisiae. Genetics. 2006;174(2):679–691. doi: 10.1534/genetics.106.062117. [DOI] [PMC free article] [PubMed] [Google Scholar]
- 78.Lee M, Sadowska A, Bekere I, Ho D, Gully BS, Lu Y, Iyer KS, Trewhella J, Fox AH, Bond CS. The structure of human SFPQ reveals a coiled-coil mediated polymer essential for functional aggregation in gene regulation. Nucleic Acids Res. 2015;43(7):3826–3840. doi: 10.1093/nar/gkv156. [DOI] [PMC free article] [PubMed] [Google Scholar]
- 79.Wojcik C, Tanaka K, Paweletz N, Naab U, Wilk S. Proteasome activator (PA28) subunits, alpha, beta and gamma (Ki antigen) in NT2 neuronal precursor cells and HeLa S3 cells. Eur J Cell Biol. 1998;77(2):151–160. doi: 10.1016/s0171-9335(98)80083-6. [DOI] [PubMed] [Google Scholar]
- 80.Mauvezin C, Sancho A, Ivanova S, Palacin M, Zorzano A. DOR undergoes nucleo-cytoplasmic shuttling, which involves passage through the nucleolus. FEBS Lett. 2012;586:3179–3186. doi: 10.1016/j.febslet.2012.06.032. [DOI] [PubMed] [Google Scholar]
- 81.Mauvezin C, Orpinell M, Francis VA, Mansilla F, Duran J, Ribas V, Palacin M, Boya P, Teleman AA, Zorzano A. The nuclear cofactor DOR regulates autophagy in mammalian and Drosophila cells. EMBO Rep. 2010;11(1):37–44. doi: 10.1038/embor.2009.242. [DOI] [PMC free article] [PubMed] [Google Scholar]
- 82.Nowak J, Archange C, Tardivel-Lacombe J, Pontarotti P, Pebusque MJ, Vaccaro MI, Velasco G, Dagorn JC, Iovanna JL. The TP53INP2 protein is required for autophagy in mammalian cells. Mol Biol Cell. 2009;20(3):870–881. doi: 10.1091/mbc.E08-07-0671. [DOI] [PMC free article] [PubMed] [Google Scholar]
- 83.Pankiv S, Lamark T, Bruun JA, Overvatn A, Bjorkoy G, Johansen T. Nucleocytoplasmic shuttling of p62/SQSTM1 and its role in recruitment of nuclear polyubiquitinated proteins to promyelocytic leukemia bodies. J Biol Chem. 2010;285(8):5941–5953. doi: 10.1074/jbc.M109.039925. [DOI] [PMC free article] [PubMed] [Google Scholar]
- 84.Thakar K, Karaca S, Port SA, Urlaub H, Kehlenbach RH. Identification of CRM1-dependent nuclear export cargos using quantitative mass spectrometry. Mol Cell Proteomics. 2013;12(3):664–678. doi: 10.1074/mcp.M112.024877. [DOI] [PMC free article] [PubMed] [Google Scholar]
- 85.Liang XH, Yu J, Brown K, Levine B. Beclin 1 contains a leucine-rich nuclear export signal that is required for its autophagy and tumor suppressor function. Cancer Res. 2001;61(8):3443–3449. [PubMed] [Google Scholar]
- 86.Maskey D, Yousefi S, Schmid I, Zlobec I, Perren A, Friis R, Simon HU. ATG5 is induced by DNA-damaging agents and promotes mitotic catastrophe independent of autophagy. Nat Commun. 2013;4:2130. doi: 10.1038/ncomms3130. [DOI] [PMC free article] [PubMed] [Google Scholar]
- 87.Rosner M, Hengstschlager M. Detection of cytoplasmic and nuclear functions of mTOR by fractionation. Methods Mol Biol. 2012;821:105–124. doi: 10.1007/978-1-61779-430-8_8. [DOI] [PubMed] [Google Scholar]
- 88.Clausen TH, Lamark T, Isakson P, Finley K, Larsen KB, Brech A, Overvatn A, Stenmark H, Bjorkoy G, Simonsen A, Johansen T. p62/SQSTM1 and ALFY interact to facilitate the formation of p62 bodies/ALIS and their degradation by autophagy. Autophagy. 2010;6(3):330–344. doi: 10.4161/auto.6.3.11226. [DOI] [PubMed] [Google Scholar]
- 89.Kang M, Day CA, Drake K, Kenworthy AK, DiBenedetto E. A generalization of theory for two-dimensional fluorescence recovery after photobleaching applicable to confocal laser scanning microscopes. Biophys J. 2009;97(5):1501–1511. doi: 10.1016/j.bpj.2009.06.017. [DOI] [PMC free article] [PubMed] [Google Scholar]
- 90.Nothwang HG, Guillemin I, Schindler J. Subcellular fractionation of small sample amounts. In: Walker JM, editor. The Protein Protocols Handbook. New Your, N.Y: Humana Press; 2009. pp. 165–170. [Google Scholar]
- 91.MacCoss MJ, McDonald WH, Saraf A, Sadygov R, Clark JM, Tasto JJ, Gould KL, Wolters D, Washburn M, Weiss A, Clark JI, Yates JR., 3rd Shotgun identification of protein modifications from protein complexes and lens tissue. Proc Natl Acad Sci U S A. 2002;99(12):7900–7905. doi: 10.1073/pnas.122231399. [DOI] [PMC free article] [PubMed] [Google Scholar]
- 92.Yates JR, 3rd, Eng JK, McCormack AL, Schieltz D. Method to correlate tandem mass spectra of modified peptides to amino acid sequences in the protein database. Anal Chem. 1995;67(8):1426–1436. doi: 10.1021/ac00104a020. [DOI] [PubMed] [Google Scholar]
- 93.Ma ZQ, Dasari S, Chambers MC, Litton MD, Sobecki SM, Zimmerman LJ, Halvey PJ, Schilling B, Drake PM, Gibson BW, Tabb DL. IDPicker 2.0: Improved protein assembly with high discrimination peptide identification filtering. J Proteome Res. 2009;8(8):3872–3881. doi: 10.1021/pr900360j. [DOI] [PMC free article] [PubMed] [Google Scholar]
Associated Data
This section collects any data citations, data availability statements, or supplementary materials included in this article.
Supplementary Materials
Figure S1 (associated with Figure 1). LC3 and its mutants show differential behavior in presence of the lysosomal inhibitor chloroquine under basal conditions. (A) Representative confocal images of HeLa cells expressing the \ indicated constructs under basal conditions (top) or following treatment with 100 μM Chloroquine for 2 h (bottom). Scale bar, 10 μm. (B) HeLa cells were transfected with the indicated constructs and either untreated or treated with chloroquine. Total cell lysates were prepared and analyzed by SDS-PAG followed by Western blotting with anti-MAP1LC3B and anti-tubulin antibodies. Recombinant Venus-LC3 runs as a band at ~42 kDa due to additional ~27 kDa Venus tag. LC3-I is detected as upper band and LC3-II as lower band.
Figure S2 (associated with Figure 1). LC3 and its mutants do not undergo CRM1-mediated active nuclear export under basal conditions. (A) Confocal images of HeLa cells expressing the indicated constructs under basal conditions or following treatment with Leptomycin B (LMB) for 2 h. Scale bar, 10 μm. (B) Quantification of the N/C ratios for the indicated constructs under basal conditions (light gray bars, taken from Figure 1C) or following 2 h of LMB treatment (dark gray bars). Error bars are 95% confidence intervals. N = 30 cells for Venus-LC3, Venus, and F52A L53A; 40 for R70A and G120A; 29 for R68-70A, and 10 for NES-LC3 under LMB conditions. One way ANOVA p<1×10⁻⁴. Bonferroni corrected t-tests for the N/C ratios of each construct under basal conditions compared to LMB conditions. ns p>0.05; *** p≤0.001.
Figure S3 (associated with Figure 5). Control experiments verifying that Cerulean is excluded from nucleoli whereas Venus-LC3 is not. HeLa cells expression Cerulean (A) or Venus-LC3 (B) were fixed and immunostained for endogenous fibrillarin, a marker of nucleoli. Scale bar, 10 μm. Note that the exclusion of Cerulean from nucleoliis more clearly apparent in live cells than in fixed cells.
Table S1 (associated with Tables 3 and 4). List of proteins co-immunoprecipitated with Venus or Venus-LC3 from nuclear and cytoplasmic fractions of HeLa cells under basal conditions as obtained by MudPIT analysis.