

Abstract
E-cadherin and p120 catenin (p120) are essential for epithelial homeostasis, but can also exert pro-tumorigenic activities. Here, we resolve this apparent paradox by identifying two spatially and functionally distinct junctional complexes in non-transformed polarized epithelial cells: one growth suppressing at the apical zonula adherens (ZA), defined by the p120 partner PLEKHA7 and a non-nuclear subset of the core microprocessor components DROSHA and DGCR8, and one growth promoting at basolateral areas of cell–cell contact containing tyrosine-phosphorylated p120 and active Src. Recruitment of DROSHA and DGCR8 to the ZA is PLEKHA7 dependent. The PLEKHA7–microprocessor complex co-precipitates with primary microRNAs (pri-miRNAs) and possesses pri-miRNA processing activity. PLEKHA7 regulates the levels of select miRNAs, in particular processing of miR-30b, to suppress expression of cell transforming markers promoted by the basolateral complex, including SNAI1, MYC and CCND1. Our work identifies a mechanism through which adhesion complexes regulate cellular behaviour and reveals their surprising association with the microprocessor.
p120 catenin (p120) was identified as a tyrosine phosphorylation substrate of the Src oncogene1 and an essential component of the cadherin complex2. The interaction with p120 stabilizes E-cadherin junctional complexes by preventing E-cadherin endocytosis2–5. p120 also regulates the activity of Rho-GTPases, and thus the organization of the actomyosin cytoskeleton6–9. By stabilizing E-cadherin, p120 is expected to act as a tumour suppressor, and mouse knockout studies support this notion10. However, p120 also exhibits tumour-promoting activities, as an essential mediator of anchorage-independent growth and cell migration induced by EGFR, HER2, Rac1 or Src (refs 11–13). This was partly attributed to the expression of different cadherin family members14,15; however, p120 can induce tumour growth even in the presence of E-cadherin13,16 and is the essential intermediate for E-cadherin-mediated Rac1 activation and subsequent proliferation induction17. Consistent with this, E-cadherin is still expressed in several types of aggressive and metastatic cancer18–20. Therefore, despite their significance in epithelial adhesion and cellular regulation, present knowledge on the role of E-cadherin and p120 in cancer is conflicting and inconclusive.
In the present study, we sought to reconcile the apparently contradictory observations and clarify the roles of p120 and E-cadherin in epithelial cell behaviour. Recently, the p120 binding partner PLEKHA7 was shown to specifically localize at the apical zonula adherens (ZA) but not along lateral surfaces of epithelial cells, as for p120 or E-cadherin21,22. By using PLEKHA7 as a marker of the apical ZA in mature epithelial cells, we characterize two distinct p120-associated complexes with antagonistic functions and we describe a microRNA (miRNA)-mediated mechanism through which the ZA suppresses transformed cell growth.
RESULTS
Two distinct p120-associated populations exist at epithelial junctions
Double immunofluorescence (IF) carried out in intestinal (Caco2) and renal (MDCK) polarized monolayers confirmed previous results that PLEKHA7 co-localizes with p120 or E-cadherin only in a narrow area apically at the junctions, whereas p120 and E-cadherin are also found basolaterally (Fig. 1a and Supplementary Fig. 1a–c; refs 21, 22). The ZA markers afadin, circumferential actin and myosin IIA (refs 23,24) co-localized precisely with PLEKHA7 (Supplementary Fig. 1d), as previously shown22, verifying that PLEKHA7 labels the ZA in these monolayers.
Figure 1.
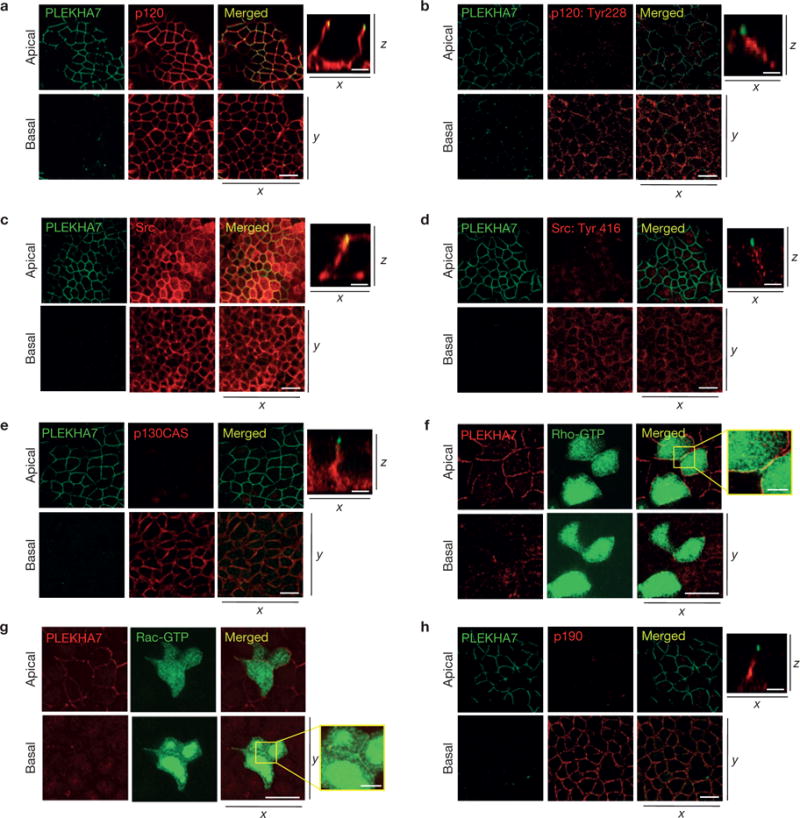
Polarized epithelial cells show distinct p120-associated populations at the junctions. Caco2 cells were grown for 21 days to polarize and subjected to IF for PLEKHA7 and (a) p120, (b) phosphorylated p120 Tyr 228, (c) Src, (d) phosphorylated Src Tyr 416; (e) p130CAS and (h) p190RhoGAP. Also, Caco2 cells were transfected with (f) a green fluorescent protein (GFP)–rGBD (rhotekin RhoA-binding domain) construct to detect active Rho (Rho-GTP) or (g) a yellow fluorescent protein (YFP)– PBD (PAK-binding domain) construct to detect active Rac (Rac-GTP), and co-stained with PLEKHA7. In all cases, stained cells were imaged by confocal microscopy and image stacks were acquired, covering the entire polarized monolayer between the basal and the apical level. Representative x–y image stacks and merged composite x–z images are shown. Enlarged parts of merged images in f and g indicate areas of cell–cell contact. Scale bars for x–y images, 20 μm; for x–z images, 5 μm; for enlarged parts of f and g, 3 μm. PLEKHA7 background staining in f and g is an artefact of paraformaldehyde fixation.
Unlike PLEKHA7, tyrosine phosphorylation of p120 at the Src-targeted sites Tyr 96 and Tyr 228 (ref. 25), which has been associated with cancer11,26,27, was abundant basolaterally but not apically (Fig. 1b and Supplementary Fig. 1e,f). In contrast, phosphorylation of p120 at the non-Src-targeted Thr 310 site was both apical and basolateral (Supplementary Fig. 1g). Total Src was distributed both basolaterally and apically (Fig. 1c), although active Src, denoted by auto-phosphorylation at Tyr 416, was absent from the ZA but present at basolateral areas of cell–cell contact (Fig. 1d), mirroring the distribution of tyrosine-phosphorylated p120. Furthermore, p130CAS, a Src target associated with increased cell mobility and decreased junction stability28, was excluded from the ZA and was abundant basolaterally (Fig. 1e).
We also examined the localization of total and active Rho and Rac by co-staining with PLEKHA7. Total RhoA and Rho-GTP were restricted at the ZA, whereas total Rac1 and Rac-GTP were excluded from the ZA and were detected along basolateral cell– cell contacts (Fig. 1f,g and Supplementary Fig. 1h–j). p190RhoGAP, a Src substrate that suppresses RhoA activity29, was also excluded from the ZA (Fig. 1h), further indicating that Rac1 and RhoA activities are mutually exclusive along areas of cell–cell contact. Together, the data suggest the presence of an apical p120 complex at the ZA associated with PLEKHA7, and a basolateral complex lacking PLEKHA7 and encompassing markers associated with a more aggressive cellular phenotype.
Proteomics identify two distinct junctional complexes in polarized epithelial cells
To obtain further evidence for the existence of two distinct junctional complexes, we biochemically separated them on the basis of the strictly ZA-specific PLEKHA7 localization and the p120 localization throughout cell–cell contacts in polarized cells (Fig. 1a and Supplementary Fig. 1a–c; ref. 22). Fully polarized Caco2 monolayers were subjected to intracellular chemical cross linking to maintain the interactions and then to either direct p120 immunoprecipitation (IP) to isolate total p120, or a two-step IP, initially with PLEKHA7 to isolate the apical complex, followed by a sequential p120 IP to isolate the remaining p120 complexes (Fig. 2a). Western blot and silver staining of these IPs indicated an efficient separation of the immunoprecipitated proteins into two fractions (Fig. 2b). Mass spectrometry analysis revealed 114 putative interactions, of which 47 were uniquely associated with the apical fraction, 35 with the basolateral and 32 were common (Fig. 2c and Supplementary Table 1). The apical complex was enriched in structural and cytoskeletal proteins, such as actin (ACTB), CKAP5, IQGAP1, ANXA2, MYL6, FLNA and ACTN1. In contrast, the basolateral complex contained proteins involved in cell cycle progression (CCAR1, CDC7, CDK5RAP2), signalling (S100A7, S100A8), endocytosis (VPS33B, VIPAR) and cancer (MCC; Fig. 2c and Supplementary Table 1).
Figure 2.
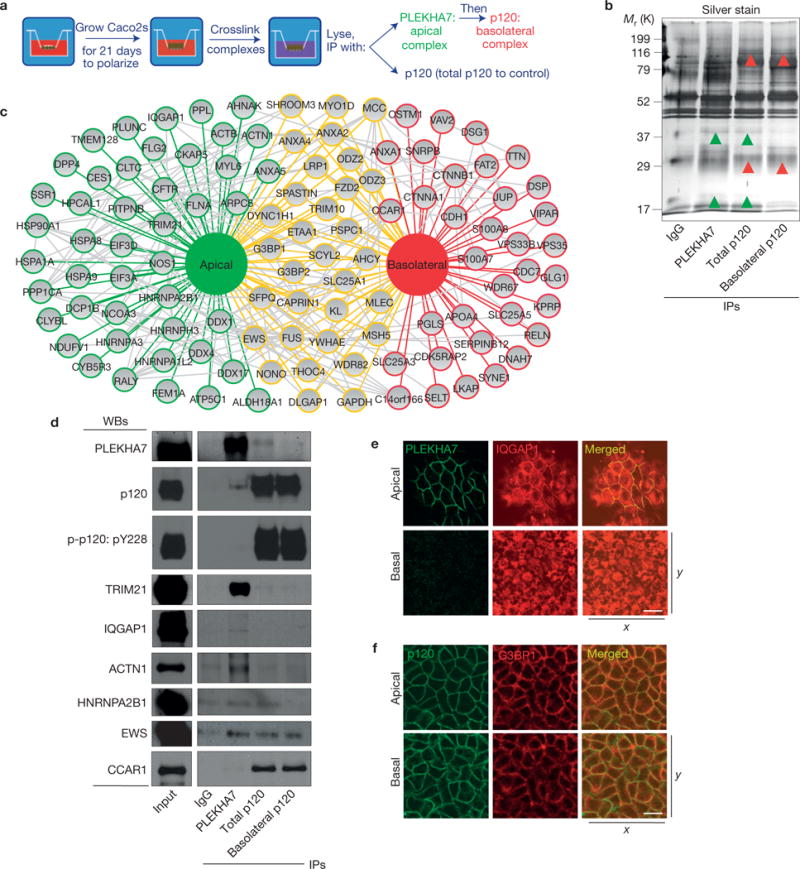
Biochemical separation of two distinct junctional complexes by proteomics. (a) Outline of the methodology to isolate the apical and basolateral complexes from polarized Caco2 cells. (b) SDS–polyacrylamide gel electrophoresis (SDS–PAGE) and silver stain of the isolated junctional fractions; green arrowheads indicate examples of apical-specific bands, whereas red arrowheads indicate basolateral-specific bands. (c) Schematic representation of the proteins identified after mass spectrometry of the isolated junctional fractions, identified in the apical (green outlines), the basolateral (red) or both fractions (yellow). Grey connections indicate known protein–protein interactions. See Supplementary Table 1 for the list of proteins and mass spectrometry peptide counts. (d) Western blot (WB) of the lysates from the separated fractions for PLEKHA7, p120 and markers identified in the apical (TRIM21, IQGAP1, ACTN1, HNRNPA2B1), the basolateral (CCAR1) and both fractions (EWS). The isolated fractions were also blotted for phosphorylated p120 Tyr 228 (p-p120: pY228), another basolateral marker (Fig. 1b). See Supplementary Fig. 8 for unprocessed blot scans. (e,f) Polarized Caco2 cells were stained and imaged as in Fig. 1 for PLEKHA7 and IQGAP1 (e) and for p120 and G3BP1 (f). All scale bars: 20 μm.
Western blot of the isolated lysates confirmed the efficient depletion of PLEKHA7 from the basolateral complex and the successful IP of p120 by PLEKHA7 in the apical fraction (Fig. 2d). pY228-p120 was absent from the apical complex lysates but abundant in the basolateral ones (Fig. 2d), in agreement with the IF data (Fig. 1b and Supplementary Fig. 1e). Western blot of the separated fractions also confirmed that E-cadherin, together with α- and β-catenin, co-precipitates with the apical complex (Supplementary Fig. 2a), as suggested by our IF data (Supplementary Fig. 1b,c) and previously published results21. Indeed, PLEKHA7 localization to the junctions is E-cadherin and p120 dependent, as indicated by loss of junctional PLEKHA7 after E-cadherin or p120 knockdown (Supplementary Fig. 2b,c). Furthermore, only full-length murine mp120-1A (1A), but not the mp120-4A (4A) isoform that lacks the amino-terminal PLEKHA7-binding domain2,21, was able to rescue junctional localization of PLEKHA7 in p120-depleted cells (Supplementary Fig. 2c).
In full agreement with the proteomics data, TRIM21, IQGAP1, ACTN1 and HNRNPA2B1 were detected only in the apical or total p120 lysates, EWS in all lysates and CCAR1 solely in the basolateral (Fig. 2d). In addition, IF of polarized cells showed strict apical junctional co-localization of IQGAP1 with PLEKHA7 (Fig. 2e) and co-localization of G3BP1 with p120 along both apical and basolateral junctions (Fig. 2f), further validating the proteomics results (Fig. 2c). Together, the data confirm the existence of two distinct junctional complexes in polarized epithelial cells.
PLEKHA7 suppresses anchorage-independent growth and expression of transformation-related markers
To define the functional role of the apical complex, we carried out short hairpin RNA (shRNA)-mediated knockdown of PLEKHA7 (Supplementary Fig. 3a). Impedance measurements during junction assembly of PLEKHA7-depleted cells showed both a delay in resistance development and an overall lower transepithelial resistance of the mature monolayer (Fig. 3a). PLEKHA7 knockdown also resulted in fragmented circumferential actin (Fig. 3b) and a more flattened cellular phenotype (Supplementary Fig. 3b). These results show that depletion of PLEKHA7 compromises the integrity of the apical ZA, as reported earlier21.
Figure 3.
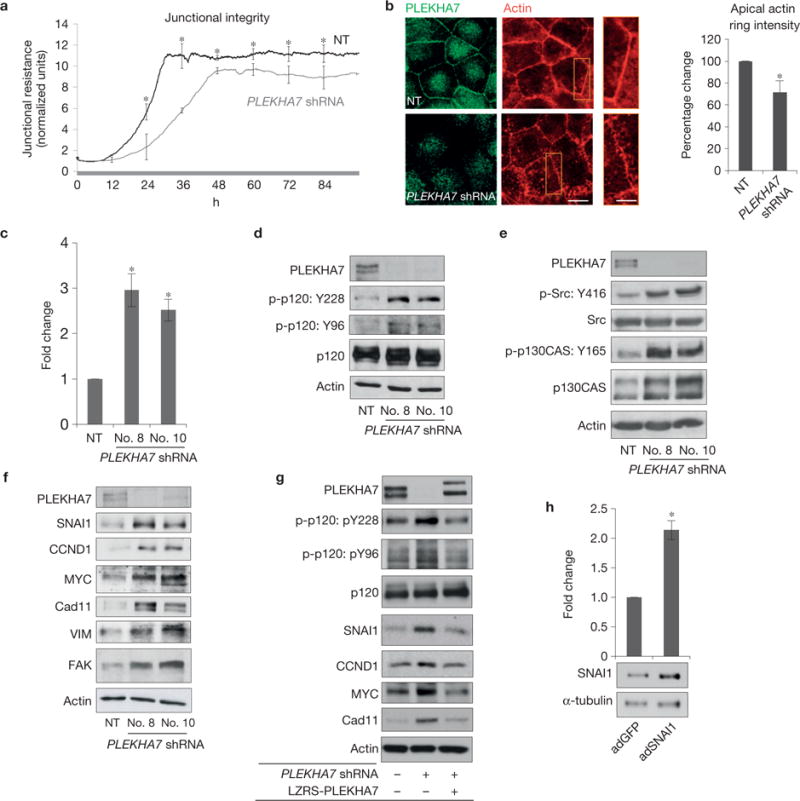
PLEKHA7 suppresses anchorage-independent growth and expression of transformation-related markers. (a) Caco2 non-target control shRNA (NT) and PLEKHA7 shRNA knockdown cells were measured for cell impedance using the ECIS apparatus to assess junctional resistance (mean ± s.d. from n = 3 independent experiments calculated for 96 h and ~7,000 continuous time points from 40,000 cells per condition, NT or PLEKHA7 shRNA, per experiment; *P <0.03 is shown for every 12 h interval, Student’s two-tailed t -test). (b) Caco2 control (NT) and PLEKHA7 knockdown (PLEKHA7 shRNA) cells co-stained for PLEKHA7 and actin (phalloidin) and quantified (right panel) for apical ring phalloidin intensity (mean ± s.d. from n = 3 independent experiments, assessing 40 cells in total per condition, NT or PLEKHA7 shRNA, *P = 0.01, Student’s two-tailed t -test; PLEKHA7 background staining is an artefact of paraformaldehyde fixation for actin). Scale bar for full images, 20 μm; for enlarged parts, 10 μm. (c) Caco2 control (NT) and PLEKHA7 knockdown cells using two shRNAs (PLEKHA7 shRNA no. 8, no. 10) were quantified for colony formation on soft agar (mean ± s.d. from n =3 independent experiments; *P <0.003, Student’s two-tailed t -test; see Supplementary Fig. 3c for representative scan). (d–f) Caco2 control (NT) and PLEKHA7 knockdown cells using two shRNAs (no. 8, no. 10) analysed by western blot for the indicated markers. Phosphorylation sites are denoted by p-. Actin is the loading control. (g) Western blot of PLEKHA7 knockdown Caco2 cells (PLEKHA7 shRNA) after ectopic re-expression of PLEKHA7 (LZRS-PLEKHA7) for the markers shown. Actin is the loading control. (h) Western blot and soft agar assay quantification of Caco2 cells infected with either vector control (adGFP) or a SNAI1-expressing construct (adSNAI1) (mean ± s.d. from n = 3 independent experiments; *P = 0.006 Student’s two-tailed t -test; see Supplementary Fig. 3e for representative scan). α-tubulin is the loading control. Source data for a–c,h are provided in Supplementary Table 2. See Supplementary Fig. 8 for unprocessed blot scans of d–g.
We then examined the effects of disrupting the ZA on the ability of Caco2 cells to form colonies on soft agar, an established assay for anchorage-independent growth. PLEKHA7-depleted cells showed a threefold increase in colony formation (Fig. 3c and Supplementary Fig. 3c). Furthermore, PLEKHA7 knockdown increased p120 phosphorylation at Tyr 96 and Tyr 228, Src phosphorylation at Tyr 416, and p130CAS phosphorylation at Tyr 165 (Fig. 3d,e and Supplementary Fig. 3d). To account for the morphological changes and induction of growth on PLEKHA7 depletion, we also examined the levels of transformation-related and mesenchymal markers15,30,31. PLEKHA7 knockdown resulted in increased expression of SNAI1, cadherin 11 (Cad11), cyclin D1 (CCND1), MYC, FAK and VIM (Fig. 3f and Supplementary Fig. 3d), whereas re-expression of PLEKHA7 reversed these effects and suppressed p120 phosphorylation (Fig. 3g). Indeed, ectopic overexpression of SNAI1 in Caco2 cells at modest levels was adequate to induce a twofold increase in soft agar colony formation (Fig. 3h and Supplementary Fig. 3e).
Knockdown of NEZHA, the intermediate link between PLEKHA7 and the microtubules21, retained PLEKHA7 at the ZA but failed to phenocopy the effects of PLEKHA7 depletion on marker expression (Supplementary Fig. 3f,g), suggesting that microtubules are not involved in the observed effects. Next, we tested whether the effects of PLEKHA7 knockdown are due to its loss from the ZA, by removing PLEKHA7 from the junctions but retaining its total levels in the cells. To do this, we transfected Caco2 cells with a p120 mutant that cannot bind E-cadherin and is cytoplasmic, because it lacks the first armadillo repeat (mp120-ΔARM1; ref. 2), but can bind PLEKHA7, because it contains the N-terminal PLEKHA7-binding domain21. Expression of this construct sequestered PLEKHA7 to the cytoplasm without altering its total levels and phenocopied the effects of PLEKHA7 depletion on the levels of the same markers examined above (Supplementary Fig. 3h,i). Therefore, it is the disruption of the PLEKHA7-associated apical ZA complex that results in induction of growth-related signalling. Consistent with this, examination of the expression and localization of PLEKHA7, p120 and E-cadherin in normal and cancer samples of breast and kidney revealed that PLEKHA7 is either mislocalized or lost in the tumour tissues, although p120 and E-cadherin are still expressed and junctional to a high percentage in the same samples (Supplementary Fig. 4a,b). These data indicate the selective disruption of the ZA in tumour tissues, in agreement with our in vitro findings.
The basolateral complex promotes cell growth and expression of related markers
Next, we examined whether the events induced by disruption of the apical complex are due to the activity of the basolateral complex. In agreement, both the increased growth and the elevated levels of transformation-related markers in PLEKHA7-depleted cells were abolished when p120 was simultaneously knocked down (Fig. 4a,b and Supplementary Fig. 4c). PLEKHA7 knockdown did not affect E-cadherin levels; however, p120 depletion reduced E-cadherin levels, as expected2,5 (Supplementary Fig. 4d). Interestingly, simultaneous knockdown of E-cadherin decreased the levels of SNAI1, CCND1, MYC and phosphorylation of p130CAS in PLEKHA7-depleted cells (Fig. 4c), indicating that the effects observed in the absence of PLEKHA7 depend on E-cadherin-based junctions. Furthermore, suppression of Src activity using the PP2 inhibitor abolished p120 and p130CAS phosphorylation and also reversed the increased expression of SNAI1, CCND1, MYC and cadherin 11 after PLEKHA7 knockdown (Fig. 4d and Supplementary Fig. 4e). Re-expression of wild-type murine p120 (mp120-1A; ref. 25) in p120 knockdown cells partially restored p120 phosphorylation as well as SNAI1 and cadherin 11 levels, whereas expression of a non-phosphorylatable p120 construct (mp120-8F; ref. 25) at similar levels failed to reproduce these effects (Fig. 4e).
Figure 4.
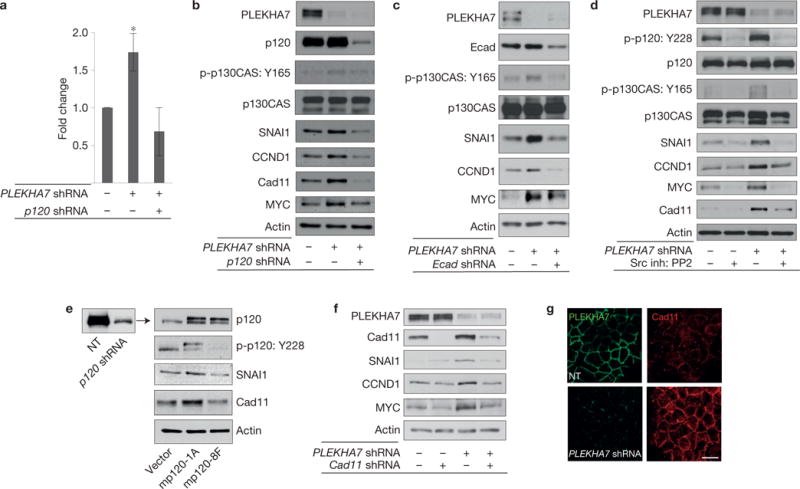
The basolateral junctional complex promotes anchorage-independent growth and expression of transformation-related markers. (a) Caco2 control, PLEKHA7 knockdown (PLEKHA7 shRNA) and PLEKHA7– p120 double knockdown (PLEKHA7 shRNA, p120 shRNA) cells were grown on soft agar and quantified for colony formation (mean ± s.d. from n = 3 independent experiments; *P = 0.0008 Student’s two-tailed t-test; see Supplementary Fig. 4c for representative scan). Source data are provided in Supplementary Table 2. (b) Control, PLEKHA7 knockdown (PLEKHA7 shRNA) and PLEKHA7–p120 double knockdown (PLEKHA7 shRNA, p120 shRNA) Caco2 cells were analysed by western blot for the markers shown. Actin is the loading control (see also Supplementary Fig. 4d). (c) Control, PLEKHA7 knockdown (PLEKHA7 shRNA) and PLEKHA7/E-cadherin (PLEKHA7 shRNA, Ecad shRNA) double knockdown Caco2 cells were analysed by western blot for the markers shown. Actin is the loading control. (d) Western blot of Caco2 control or PLEKHA7 knockdown (PLEKHA7 shRNA) cells after treatment with vehicle control (dimethylsulphoxide, DMSO) or 10 μM Src inhibitor PP2; actin is the loading control (see also Supplementary Fig. 4e). (e) Western blot of p120 knockdown Caco2 cells (p120 shRNA) after ectopic expression of either vector control (vector), murine full-length (isoform 1A) wild-type p120 (mp120-1A) or murine full-length non-phosphorylatable p120 (mp120-8F) for the markers shown. Actin is the loading control. (f) Western blot of single and double PLEKHA7 (PLEKHA7 shRNA) and cadherin 11 (Cad11 shRNA) knockdown Caco2 cells for the markers shown. Actin is the loading control. (g) IF of control (NT) or PLEKHA7 knockdown (PLEKHA7 shRNA) cells for PLEKHA7 and cadherin 11 (Cad11). Scale bar: 20 μm. See Supplementary Fig. 8 for unprocessed blot scans of b–f.
Depletion of cadherin 11, which was previously implicated in p120-mediated growth and migration signalling14,15, also reversed the increased levels of SNAI1, CCND1 and MYC on PLEKHA7 depletion (Fig. 4f). As E-cadherin levels are unaltered in the PLEKHA7-depleted cells (Fig. 4c and Supplementary Fig. 4d), the data do not suggest a cadherin switch, but rather that the effects of PLEKHA7 depletion are mediated by the cadherin-based basolateral junctions. Indeed, p120 tyrosine phosphorylation occurs only at the junctions (Fig. 1b and Supplementary Figs 1e,f and 4e; refs 32,33), and cadherin 11 exhibits strong junctional staining after PLEKHA7 knockdown (Fig. 4g). Collectively, the results indicate that the basolateral complex acts through E-cadherin, cadherin 11, Src and p120 to promote transformation-related signalling, after disruption of the apical complex.
PLEKHA7 suppresses expression of SNAI1, MYC and CCND1 through miRNAs
PLEKHA7 knockdown did not significantly alter the messenger RNA (mRNA) levels of the examined markers (Supplementary Fig. 5a), did not prolong protein stability after cycloheximide treatment (Supplementary Fig. 5b) and did not alter the rate of stabilization after MG-132 treatment (Supplementary Fig. 5c). PLEKHA7 knockdown also did not affect the phosphorylation of GSK3B, a dominant regulator of SNAI1 stability34,35 (Supplementary Fig. 5d). These results suggest that PLEKHA7 is not affecting the examined markers transcriptionally or post-translationally, but imply that it may suppress mRNA expression. A core such mechanism is RNA interference (RNAi), which involves the miRNA-mediated silencing of mRNA expression36–39 and is commonly deregulated in cancer40,41. To examine this, we used the NanoString platform and found significant changes in the levels of 29 miRNAs out of 735 examined in PLEKHA7-depleted cells: 15 of them were decreased and 14 miRNAs increased (Fig. 5a). The strongest decrease was observed for miR-24, miR-30a and let-7g, and the strongest increase for miR-19a. We also focused on the most abundant of the affected miRNAs, namely miR-30b, which was among those decreased (Fig. 5a). Quantitative PCRs with reverse transcription (qRT–PCRs) confirmed the NanoString results (Fig. 5b), whereas PLEKHA7 re-expression rescued the altered miRNA levels (Supplementary Fig. 5e,f).
Figure 5.
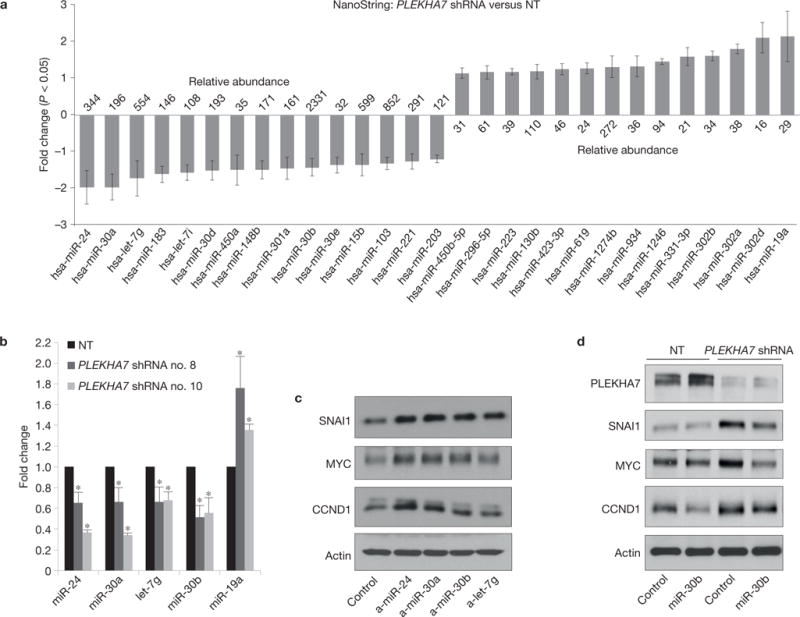
PLEKHA7 suppresses protein expression through miRNAs. (a) Caco2 control (NT) and PLEKHA7 knockdown (PLEKHA7 shRNA) cells analysed for miRNA expression using NanoString. Results shown are statistically significant changes (mean ± s.d. from n = 3 independent experiments; P < 0.05, Student’s two-tailed = 3 t -test) shown as average fold change of PLEKHA7 shRNA versus control cells. Numbers on each bar are NanoString counts indicating relative abundance of the respected miRNAs (see also Methods). Source data are deposited at Gene Expression Omnibus, accession number GSE61593. (b) qRT–PCR analysis of Caco2 control (NT) or PLEKHA7 knockdown (PLEKHA7 shRNA no. 8, no. 10) cells for the indicated miRNAs (mean ± s.d. from n = 3 independent experiments; *P < 0.01, Student’s two-tailed t -test). Source data are provided in Supplementary Table 2. (c) Western blot of Caco2 cells transfected with the indicated anti-miRNAs for the markers shown; actin is the loading control. (d) Caco2 control (NT) and PLEKHA7 knockdown (PLEKHA7 shRNA) cells were transfected with either control or miR-30b mimic and blotted for the markers shown; actin is the loading control. See Supplementary Fig. 8 for unprocessed blot scans of b–d.
We then used anti-miRNAs to target miR-24, miR-30a, miR-30b and let-7g in wild-type PLEKHA7-containing cells, to mimic the effect of PLEKHA7 knockdown on their expression. Indeed, the anti-miRNA transfections resulted in increased levels of SNAI1, MYC and CCND1 (Fig. 5c), similar to the effect of PLEKHA7 depletion (Fig. 3f). The miR-30 and let-7 miRNA families are validated suppressors of SNAI1 (refs 42–44), whereas miR-24 and the let-7 family are also verified suppressors of MYC (refs 45–47). Re-expression of miR-30b in PLEKHA7-depleted cells using a miR-30b mimic construct reversed the increase of SNAI1, MYC and CCND1 (Fig. 5d), confirming that miR-30b is a mediator of PLEKHA7’s growth-suppressing signalling. Interestingly, anti-miR-30a and anti-miR-30b also increased Src and p120 phosphorylation, whereas the miR-30b mimic reversed their increase in PLEKHA7-depleted cells (Supplementary Fig. 5g,h). In addition, ectopic SNAI1 overexpression (Fig. 3h) induced p120 phosphorylation at Tyr 228 (Supplementary Fig. 5i), suggesting that the effect of miR-30b on p120 phosphorylation is mediated by SNAI1. In summary the data reveal that a specific subset of miRNAs, and in particular miR-30b, are regulated by PLEKHA7 and mediate its effects on proteins involved in transformed cell growth.
The ZA associates with the microprocessor complex
Although PLEKHA7 knockdown decreased levels of mature miR-30b (Fig. 5a,b), it did not affect expression of the primary miR-30b (pri-miR-30b) transcript (Fig. 6a); however, it resulted in decreased levels of the next precursor, pre-miR-30b (Fig. 6a and Supplementary Fig. 6a). This suggested that PLEKHA7 affects pri-miR-30b processing to pre-miR-30b, a step in miRNA biogenesis catalysed by the microprocessor complex and its two essential components DROSHA and DGCR8 (refs 48–51). We tested whether PLEKHA7 depletion affects either the total levels of DROSHA or DGCR8, or their localization, because the microprocessor is thought to function in the nucleus. Whereas both the overall levels of the two proteins and their subcellular distribution remained unchanged, cell fractionation assays revealed the existence of a non-nuclear fraction of both DROSHA and DGCR8 (Fig. 6b). IF and confocal microscopy confirmed their presence outside the nucleus, particularly at areas of cell–cell contact (Fig. 6c), and revealed their co-localization with PLEKHA7 and p120 strictly at the apical ZA of polarized epithelial cells (Fig. 6d–g and Supplementary Fig. 6b–e). The use of alternative antibodies for DROSHA and DGCR8 (Supplementary Fig. 6b,c) as well as elimination of their staining after knockdown by short interfering RNAs (siRNAs) (Supplementary Fig. 6f,g) confirmed the specificity of their junctional localization. In agreement, DROSHA and DGCR8 co-precipitated with PLEKHA7 (Fig. 6h,i), p120 (Fig. 6i and Supplementary Fig. 6h) and E-cadherin (Supplementary Fig. 6h). Notably, the interaction of PLEKHA7 with the microprocessor is RNA independent (Fig. 6j), excluding the possibility that these interactions are due to non-specific isolation of large ribonucleoprotein granules from the cells. Proximity ligation assay confirmed that the interaction of DROSHA and PLEKHA7 occurs only at the junctions (Fig. 6k).
Figure 6.
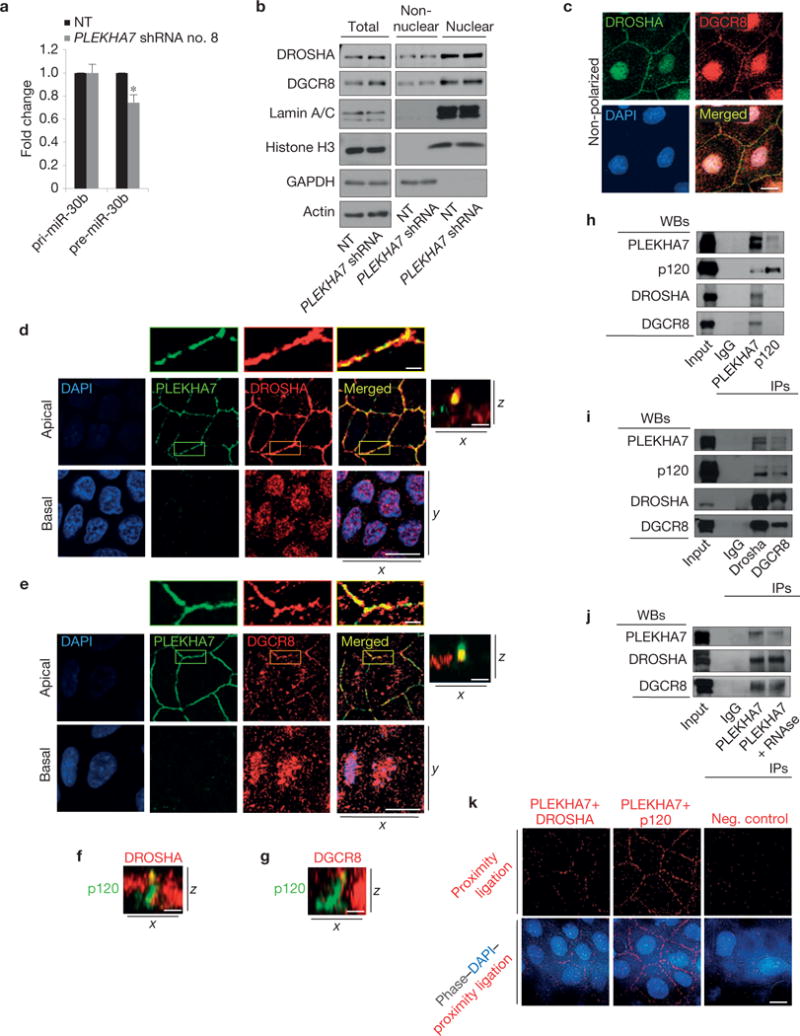
PLEKHA7 associates with DROSHA and DGCR8 at the ZA. (a) qRT–PCR analysis of pri-miR-30b and pre-miR-30b in Caco2 control (NT) or PLEKHA7 knockdown (PLEKHA7 shRNA) cells (mean ± s.d. from n = 3 independent experiments; *P = 0.02, Student’s two-tailed t -test). Source data are provided in Supplementary Table 2. (b) Western blot of either total cell lysates or of nuclear and non-nuclear lysates after subcellular fractionation of Caco2 NT or PLEKHA7 shRNA cells for the indicated markers. Lamin A/C and histone H3 are the nuclear and GAPDH the cytoplasmic markers; actin is the total loading control. (c) IF of non-polarized Caco2 cells, co-stained for DROSHA and DGCR8; 4,6-diamidino-2-phenylindole (DAPI) is the nuclear stain. (d,e) IF of polarized Caco2 cells co-stained for PLEKHA7 and DROSHA or DGCR8. Enlarged details in boxes are shown above the apical fields; a composite x–z merged image is shown at the side of the x–y image stack (antibodies used here: DROSHA, Abcam; DGCR8, Abcam; see also Supplementary Fig. 6b–e for a second set of antibodies used and Supplementary Table 3 for antibody details). DAPI is the nuclear stain. (f,g) Composite x–z images of polarized Caco2 cells co-stained by IF for p120 and DROSHA or DGCR8 (see Supplementary Fig. 6b,c, respectively, for x–y set of image stacks). (h,i) Western blots of PLEKHA7, p120, DROSHA and DGCR8 IPs for the markers shown. IgG is the negative IP control. (j) Western blot of PLEKHA7 IPs with and without RNAse treatment; IgG is the negative control. (k) Proximity ligation assay using PLEKHA7 and DROSHA antibodies, PLEKHA7 and p120 antibodies (assay positive control) or a p120 antibody only (assay negative control); the composite phase contrast–DAPI–proximity ligation images are also shown. Scale bars for x–y images, 20 μm; for x–z images, 5 μm; for enlarged parts of d and e, 3 μm. See Supplementary Fig. 8 for unprocessed blot scans of b,h–j.
The junctional localization of DROSHA and DGCR8 was disrupted in PLEKHA7-depleted cells, indicating that it is PLEKHA7 dependent (Fig. 7a,b). Removal of PLEKHA7 from the junctions by the mp120-ΔARM1 mutant also resulted in compromised junctional localization of DROSHA and DGCR8 (Supplementary Fig. 7a–c). Furthermore, depletion of p120, which is required for PLEKHA7 recruitment to the junctions (Supplementary Fig. 2c), also negatively affected DROSHA junctional localization (Supplementary Fig. 7d) and decreased the levels of the examined miRNAs (Supplementary Fig. 7e), mimicking the effects of PLEKHA7 depletion. Conversely, strengthening of the junctions by Src inhibition33 increased junctional localization of PLEKHA7, DROSHA and DGCR8 (Fig. 7c–e). As PLEKHA7 tethers the ZA to the microtubules21, we examined whether the localization of DROSHA and DGCR8 at the ZA is microtubule dependent. Calcium switch assays showed that the junctional localization of PLEKHA7, DROSHA and DGCR8 recovers rapidly after re-addition of calcium, and is not affected by dissolution of microtubules by nocodazole (Fig. 7f–i). Similarly, neither prolonged nocodazole treatment (Supplementary Fig. 7f), nor NEZHA knockdown (Supplementary Fig. 7g,h) affected the junctional localization of PLEKHA7, DROSHA or DGCR8. Although both miR-30b (Fig. 5d) and p120 or cadherin 11 knockdown (Fig. 4b,f) rescue the levels of pro-tumorigenic markers in PLEKHA7-depleted cells, simultaneous knockdown of either p120 or cadherin 11 with PLEKHA7 did not reverse either the decreased miRNA levels (Supplementary Fig. 7i) or the compromised junctional localization of DROSHA and DGCR8 (Supplementary Fig. 7j–m), indicating that these events are PLEKHA7 specific and that p120 and cadherin 11 induce cell transforming markers through a separate pathway. Taken together, the data reveal the association of the microprocessor complex with the apical ZA in non-transformed epithelial cells, in a PLEKHA7-dependent manner.
Figure 7.
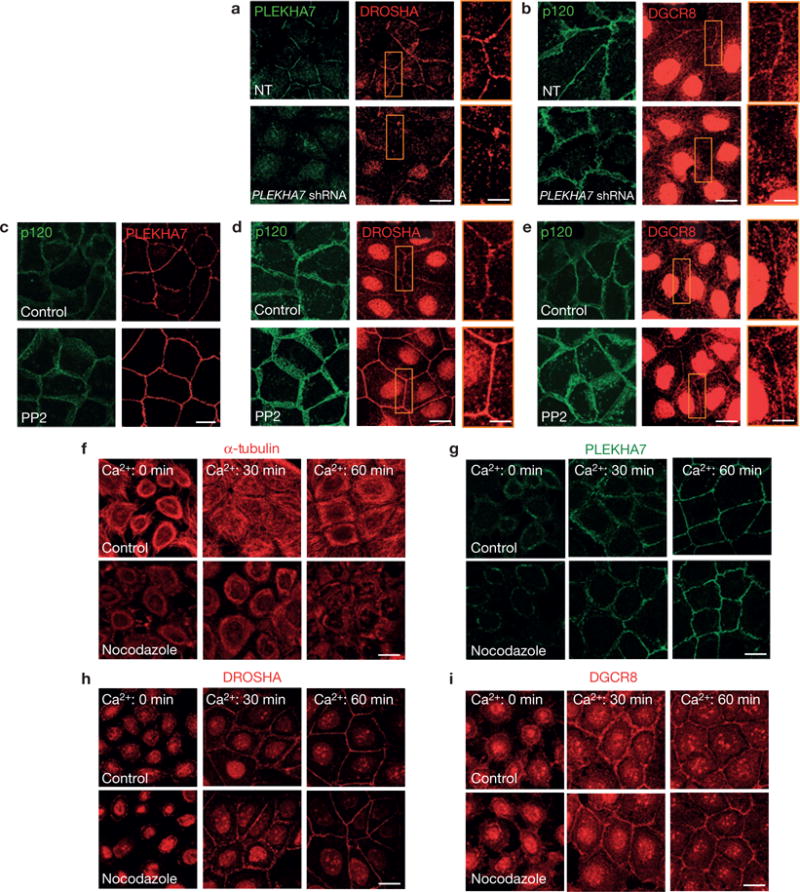
Localization of DROSHA and DGCR8 at the ZA is PLEKHA7 dependent. (a,b) IF of control (NT) or PLEKHA7 knockdown (PLEKHA7 shRNA) Caco2 cells for DROSHA and DGCR8, co-stained for PLEKHA7 or p120. PLEKHA7 background intracellular staining in a is an artefact of paraformaldehyde fixation. (c–e) Caco2 cells treated either with vehicle control (DMSO) or the Src inhibitor PP2 (10 μM) were stained by IF for PLEKHA7, DROSHA and DGCR8 and co-stained with p120. (f–i) Calcium switch assay of Caco2 cells for the indicated times after Ca2+ re-addition (Ca2+: 0 min indicates Ca2+ depleted cells immediately before Ca2+ re-addition), treated with vehicle (control) or with 10 μM nocodazole, and stained by IF for α-tubulin, PLEKHA7, DROSHA and DGCR8. Enlarged image details are shown in yellow boxes on the right-hand side of the image stacks in a, b, d and e. Scale bars for full images, 20 μm; for enlarged parts, 8 μm.
PLEKHA7 regulates processing of pri-miR-30b at the junctions
Subcellular fractionation revealed the existence of at least three pri-miRNAs, pri-miR-30b, pri-let-7g and pri-miR-19a, outside the nucleus (Fig. 8a), and RNA-IPs indicated that PLEKHA7 is enriched in these pri-miRNAs (Fig. 8b). In vitro processing assays using pri-miR-30b as a template showed that the PLEKHA7-associated complex possesses pri-miRNA processing activity (Fig. 8c). PLEKHA7 depletion decreased in vitro processing of pri-miR-30b by about 30% (Fig. 8d,e), similar to the decrease observed in endogenous pri-miR-30b processing after PLEKHA7 knockdown (Fig. 6a). Finally, in situ hybridization (ISH) confirmed the localization of pri-miR-30b at the junctions (Fig. 8f). Collectively, our results demonstrate that the ZA-localized microprocessor complex is active and that PLEKHA7 regulates processing at least of pri-miR-30b at the ZA.
Figure 8.
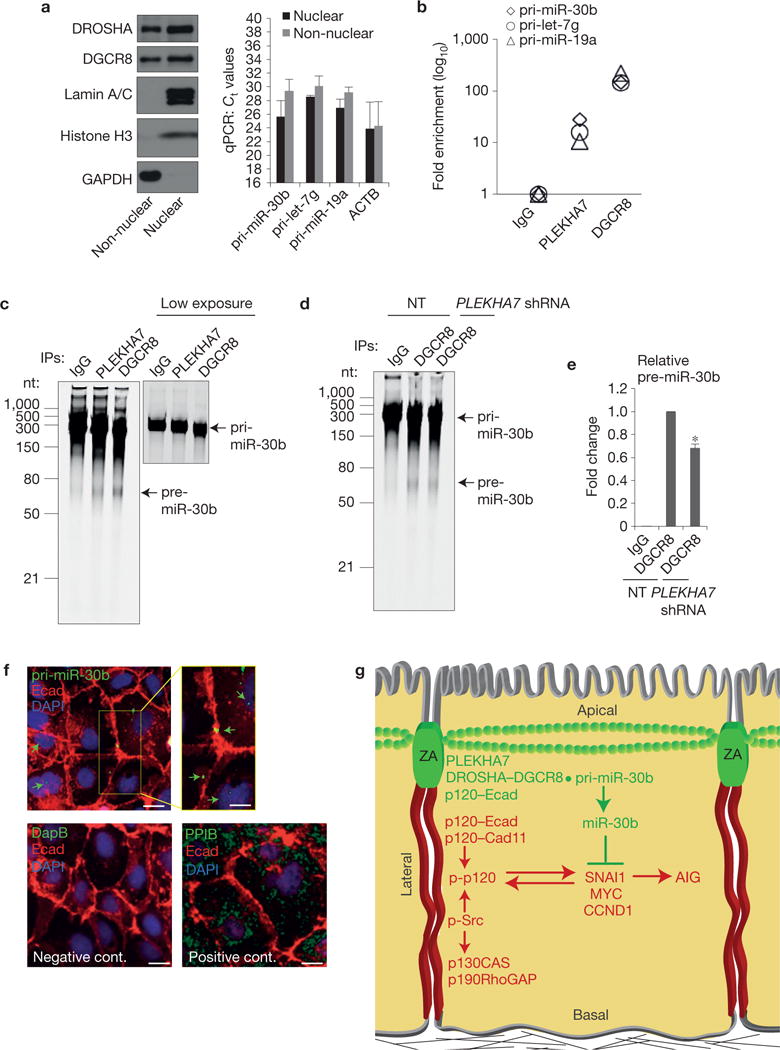
PLEKHA7 regulates pri-miR-30b processing at the junctions. (a) qRT–PCR of isolated nuclear and non-nuclear subcellular fractions of Caco2 cells for the indicated pri-miRNAs (right panel). Successful fractionation is demonstrated by western blot for the indicated markers (left panel). Ct values are shown (mean ± s.d. from n = 3 independent experiments); actin (ACTB) is the positive qRT–PCR control. Lamin A/C and histone H3 are the nuclear and GAPDH the cytoplasmic markers for the western blot. See Supplementary Fig. 8 for unprocessed blot scans. (b) qRT– PCR of the eluates from the IgG (negative control), PLEKHA7 and DGCR8 (positive control) RNA-IPs for the indicated pri-miRNAs (a representative is shown from two independent experiments). (c) In vitro pri-miR-30b processing activity assay of Caco2 lysates for PLEKHA7, DGCR8 (positive control) and IgG (negative control) IPs. A lower exposure image of the pri-miR-30b template is presented to show the actual loading amount. nt, nucleotides. (d) In vitro pri-miR-30b processing activity assay for DGCR8 IPs of NT or PLEKHA7 shRNA Caco2 cells; IgG is the negative control. (e) Quantification of pre-miR-30b band intensities from n =3 independent in vitro processing activity assays, carried out as in d (mean ± s.d.; *P <0.001, Student’s two-tailed t -test). (f) ISH of Caco2 cells for pri-miR-30b; a bacterial DapB RNA probe was used as the negative and the endoplasmic-reticulum-specific PPIB as the positive control. Merged images are shown. An enlarged area in the yellow box in the top right panel is shown for the pri-miR-30b ISH. Arrows indicate hybridization signals. Scale bars for full images, 20 μm; for enlarged part, 12 μm. Source data are provided in Supplementary Table 2 for a,b and e. (g) Schematic diagram summarizing the findings of the present study. Two distinct junctional complexes exist in polarized epithelial cells: a basolateral complex lacking PLEKHA7 promotes growth signalling and anchorage-independent growth (AIG) through cadherins, Src and p120 activity, whereas an apical ZA complex suppresses these events through PLEKHA7, by locally recruiting the microprocessor at the ZA to regulate processing of miR-30b.
In summary, the data support a model whereby the apical ZA complex recruits the microprocessor through PLEKHA7 to suppress growth-related signalling promoted by the basolateral junctional complex, hence maintaining the normal epithelial architecture and behaviour (Fig. 8g).
DISCUSSION
Our work shows that the dual p120 and E-cadherin behaviour in epithelial cell growth can be explained by the existence of two distinct p120 complexes with opposing functions: an apical complex at the ZA that suppresses growth-related signalling through PLEKHA7-mediated regulation of select miRNAs and a basolateral complex that promotes anchorage-independent growth and increased expression of markers such as SNAI1, MYC and CCND1 through activated Src and tyrosine-phosphorylated p120 (Fig. 8g).
DROSHA and DGCR8 are thought to regulate miRNA processing in the nucleus48–50. However, these proteins have not been studied in the context of non-transformed, polarized mammalian epithelial cells. Our data reveal that, in these cells, a functional subset of the microprocessor is recruited by PLEKHA7 to the ZA (Figs 6d–k and 7a,b). PLEKHA7 does not globally regulate miRNA expression in the cells examined, but affects only a specific subset of miRNAs (29 out of 735 examined; Fig. 5a) in a confluence-independent manner, because all experiments herein were carried out in fully confluent epithelial monolayers. Importantly, the interaction of PLEKHA7 with DROSHA (Fig. 6k) or pri-miR-30b (Fig. 8b,f) occurs exclusively at the ZA, whereas depletion of PLEKHA7 dissociates DROSHA and DGCR8 from the ZA and reduces miR-30b processing, without affecting nuclear DROSHA and DGCR8 levels (Figs 6b, 7a,b and 8d,e). Therefore, the present study does not dispute the general model of miRNA biogenesis, but uncovers a mechanism whereby PLEKHA7 recruits a subpopulation of the microprocessor to the ZA and regulates processing of select miRNAs to suppress the expression of markers involved in transformed cell growth.
The miRNAs regulated by PLEKHA7 provide a mechanistic link to the essential function of the ZA in maintaining epithelial homeostasis. The miR-30 and let-7 families are well established guardians of the epithelial phenotype and epithelial–mesenchymal transition suppressors42–44. In contrast, the most strongly increased miR-19a after PLEKHA7 depletion is a key component of the polycistronic miR-17-92 miRNA oncogene52,53. Our data support a model whereby individual cells within an epithelial monolayer sense the status of their apical ZA by regulating the levels of a subset of miRNAs to accordingly suppress or promote growth (Fig. 8g).
Co-localization of phosphorylated p120 with activated Src and Rac1 was observed specifically at the basolateral complex, similar to the case of p190RhoGAP, which suppresses RhoA signalling and induces transformed cell growth in a Rac1- and Src-dependent manner7,13 (Figs 1b,d,g,h, 2d, and Supplementary Fig. 1e,f,h,i). Therefore, it is the basolateral complex that exerts the previously described Src- and Rac1-induced transforming activity of p120 (refs 13,15). In agreement, we show that E-cadherin, Src activation and p120 tyrosine phosphorylation are required for increased growth signalling in the absence of PLEKHA7 (Fig. 4b–e). Therefore, the growth-suppressing or growth-promoting functions of p120 and E-cadherin are fine-tuned by binding to PLEKHA7. Further interactions of PLEKHA7 with paracingulin54, afadin55, ZO-1 and cingulin56, may also play a role in PLEKHA7 function, although the interaction with p120 is essential for modulating cell behaviour by regulating miRNA processing.
Taken together, our data untangle the complicated roles of E-cadherin and p120 in the context of distinct junctional complexes, spatially separating their functions and providing an explanation for their conflicting behaviour in cell growth. In addition, they identify PLEKHA7 as a specific marker of ZA that mediates suppression of growth-related signalling. Finally, they reveal an interaction of the ZA with the microprocessor complex, and uncover a mechanism whereby the ZA regulates a set of miRNAs to suppress cellular transformation and maintain the epithelial phenotype.
METHODS
Methods and any associated references are available in the online version of the paper.
METHODS
Cell culture, reagents and chemicals
In all comparisons, cells were used strictly at the same confluences. All cell lines were obtained from ATCC, used at low passage (<20), and tested negative for mycoplasma contamination. Caco2 colon epithelial cells were cultured in MEM (Cellgro) supplemented with 10% FBS (Invitrogen), 1 mM sodium pyruvate (Invitrogen) and 1× non-essential amino-acid supplement (Mediatech). MDCK canine kidney epithelial cells, HEK 293FT human embryonic kidney cells, and Phoenix-Ampho cells were cultured in DMEM supplemented with heat-inactivated 10% FBS. PP2 was obtained from Calbiochem; nocodazole, cycloheximide and MG-132 from Sigma.
Constructs
Full-length human PLEKHA7 was cloned in the XbaI–HindII sites of pcDNA3.1myc–His and then the PLEKHA7–Myc fragment was cut out by PmeI and sub-cloned to the AfeI site of the retroviral LZRS vector to obtain the LZRS-PLEKHA7–Myc construct. The PLEKHA7–GFP construct was a gift of the M. Takeichi laboratory (RIKEN, Japan; ref. 21). The mp120-1A, mp120-4A, mp120-8F and mp120-ΔARM1 constructs have been previously described2,25. The adSNAI1 and adGFP adenoviruses were a gift of the D. Radisky laboratory (Mayo Clinic, FL, USA). The YFP–PBD (plasmid 11407) and GFP–rGBD (plasmid 26732) constructs were obtained from Addgene.
shRNAs, siRNAs, anti-miRNAs and miR-mimics
Cells were transfected using Lipofectamine 2000 (Invitrogen) or Lipofectamine RNAiMAX (Invitrogen) for anti-miRNA, miR-mimic and siRNA transfection, according to the manufacturer’s protocols. Lentiviral shRNAs were derived from the pLKO.1-based TRC1 (Sigma–RNAi Consortium) shRNA library (pLKO.1-puro non-target shRNA control, SHC016; PLEKHA7 no. 8, TRCN0000146289; PLEKHA7 no. 10, TRCN0000127584; Cad11, TRCN0000054334; Ecad no. 21, TRCN0000039664; Ecad no. 23, TRCN0000039667) and the pLKO.5-based TRC2 library (pLKO.5-puro non-target shRNA control, SHC216; NEZHA no. 72, TRCN0000268676; NEZHA, no. 73: TRCN0000283758). Lentiviruses were produced in HEK 293FT cells and used to infect cells according to standard protocols. Retroviruses were prepared in Phoenix-Ampho cells, as described previously15. SMARTpool (Dharmacon) siRNAs used: DROSHA, M-016996-02-0005; DGCR8, M-015713-01-0005; non-target, D-001206-14-05 mirVana (Life Technologies catalogue no. 4464084). Anti-miRNAs used: anti-hsa-miR-30a, ID MH11062; anti-hsa-let-7g, ID MH11758; anti-hsa-miR-30b, ID MH10986; anti-hsa-miR-24, ID MH10737; negative control no. 1, catalogue no. 4464076. MISSION (Sigma) miR-mimics used: miR-30b, catalogue no. HMI0456; negative control 1 (catalogue no. HMC0002).
Antibodies
For detailed information on all the antibodies used in the study, as well as working dilutions for each assay, see Supplementary Table 3.
Immunofluorescence
MDCK and Caco2 cells were grown on Transwell inserts (Costar 3413) for 7 or 21 days respectively, until they polarized, or on sterile glass coverslips until they reached full confluence. Cells were washed once with PBS and then fixed with either 100% methanol (Fisher) for 7 min; or 4% formaldehyde (EMS) for 20 min, followed by 0.02% Triton X-100 permeabilization for 10 min; or 10% TCA (Sigma) for 15 min on ice, particularly for RhoA co-staining, and permeabilized as above. Cells were blocked with either 3% non-fat milk (Carnation) in PBS or Protein-Block reagent (Dako, X090930-2) for 30 min and stained with primary antibodies diluted either in milk or antibody diluent (Dako, S302281-2) for 1 h. Cells were then washed three times with PBS, stained with the fluorescent-labelled secondary antibodies for 1 h, washed three times with PBS, co-stained with DAPI (Sigma) to visualize the nuclei, mounted (Aqua Poly/Mount, Polysciences) and imaged using a Zeiss LSM 510 META laser confocal microscope, under a × 63 objective, with a further ×1.6 zoom. z-stacks were acquired at 0.5 μm intervals. Images, stacks and x–z representations of the image stacks were processed using the Zen software (Zeiss).
Immunoblotting
Whole-cell extracts were obtained using RIPA buffer (Tris, pH 7.4, 50 mM NaCl, 150 mM, 1% NP-40, 0.5% deoxycholic acid, 0.1% SDS) supplemented with protease (Cocktail III, RPI) and phosphatase inhibitors (Pierce). Lysates were homogenized through a 29 g needle and cleared by full-speed centrifugation for 5 min. Protein extracts were mixed with LSB and separated by SDS–PAGE, transferred to nitrocellulose membranes (Bio-Rad), blotted according to standard protocols, detected by luminescence using ECL (GE Healthcare) and imaged using X-ray films (Pierce). See Supplementary Fig. 8 for original scans of western blots.
Immunohistochemistry—ethics statements
Breast tissue samples were initially collected under protocol MC0033, with the approval of the Mayo Clinic Institutional Review Board. Written informed consent for the use of these tissues in research was obtained from all participants. Generation of the tissue micro-arrays was carried out under protocol 09-001642. All unique patient identifiers and confidential data were removed and tissue samples were de-identified. The Mayo Clinic Institutional Review Board assessed the protocol 09-001642 as minimal risk and waived the need for further consent. Renal tissue samples were collected for the Mayo Clinic Renal Tissue Registry under protocol 14-03, with the approval of the Mayo Clinic Institutional Review Board. Written informed consent for the use of these tissues in research was obtained from all participants to the Registry. Renal tissue samples used here were obtained from the Renal Tissue Registry under the Mayo Clinic Institutional Review Board protocol 675-05. All unique patient identifiers and confidential data were removed and tissue samples were de-identified. The Mayo Clinic Institutional Review Board assessed the 675-05 protocol as minimal risk and waived the need for further consent. All data were analysed anonymously. Paraffin-embedded tissues on slides were placed in xylene and rehydrated in a graded ethanol series, rinsed in water, subjected to heat antigen retrieval according to the manufacturer’s instructions (Dako), incubated with primary antibody and finally with either anti-rabbit (for PLEKHA7) or anti-mouse (for Ecad, p120) labelled polymer horseradish peroxidase (Dako). Slides were scanned using Aperio ScanScope XT and viewed using Aperio ImageScope v11.1.2.752.
Junction resistance measurements
ECIS Z (Electric Cell-substrate Impedance System, Applied Biophysics) was used to measure impedance of Caco2 cells. 4 × 10⁴ cells were plated on electrode arrays (8W10E, Applied Biophysics). Measurements were made every 180 s at the 4,000 Hz frequency that measures junctional impedance and at 64,000 Hz that corresponds to cell density. The 4,000 Hz values were normalized to the 64,000 Hz values to account for cell density variations.
Soft agar assay
Six-well plates (Costar 3516) were first covered with a layer of 0.75% agarose, prepared by mixing 1.5% of sterile agarose (Seakem) in a 1:1 ratio with ×2 concentrated Caco2 culture medium made from powder MEM (Invitrogen, catalogue no. 61100061) and double addition of each supplement (see above). The basal layer was left to solidify for 30 min. Cells were trypsinized, counted and resuspended in ×2 Caco2 medium. The cell suspension was mixed in a 1:1 ratio with 0.7% sterile agarose to make a final layer of 0.35% agarose, which was added on top of the basal layer. 5×10⁴ Caco2 cells were seeded per well. The top layer was left to solidify for another 30 min and was covered with 1 × Caco2 culture medium. Cultures were maintained for 4 weeks with medium renewal on top of agar every three days until colonies were visible, and then stained with 0.02% crystal violet (Fisher) in 20% ethanol and PBS, washed three times with distilled H2O, scanned and counted for colonies.
Calcium switch assay
Caco2 cells were grown on coverslips until confluency, pretreated with either DMSO (control) or 10 μM nocodazole for 1 h to dissolve microtubules, then washed three times with calcium-free PBS and incubated in calcium-free Caco2 medium (Life, 11380-037, supplemented with glutamine, 10%FBS, sodium pyruvate and MEM) containing 4 mM EGTA for 30 min, until cells were rounded, while being kept in either DMSO or 10 μM nocodazole, respectively. Cells were then washed three times with PBS, returned to regular Caco2 medium, again with DMSO or nocodazole respectively, and fixed for IF, for the indicated times.
IPs
Cells were grown on 10 cm plates until fully confluent, washed twice with PBS and lysed using a Triton X-100 lysis buffer (150 mM NaCl, 1 mM EDTA, 50 mM Tris pH 7.4, 1% Triton X-100) containing twice the amount of protease (Cocktail III, RPI) and phosphatase inhibitors (Pierce). Four 10 cm plates (~3–4 × 10⁶ cells) were used per IP. In parallel, 4 μg of antibody or IgG control (Jackson ImmunoResearch, 011-000-003) was incubated with 40 μl Protein G Dynabeads (Invitrogen) overnight and then washed three times with IP lysis buffer. Cell lysates were incubated with the bead-conjugated antibodies overnight. Beads were then washed three times with IP lysis buffer and eluted using 50 mM dithiothreitol (Sigma) in lysis buffer at 37 °C for 45 min, with constant agitation. For RNAse-treated IPs, beads were distributed equally after the final wash into two tubes with either 1.5 ml PBS or PBS containing 100 mg ml−1 RNAse A (Sigma). After incubation at 4 °C for 1.5 h, beads were washed three times with PBS, and proteins were eluted as above.
Proteomics
Caco2 cells were grown on 10 cm Transwell inserts (Costar 3419) for 21 days to polarize. Cells were then washed twice with PBS and proteins were cross linked as previously described57, using 0.75 mM of the reversible cross linker DSP (Lomant’s reagent; Pierce) for 3 min at room temperature, which was then neutralized using 20 mM Tris pH 7.5 for 15 min. Cells were finally lysed using RIPA (see recipe above, immunoblotting section) containing twice the amount of protease (Cocktail III, RPI) and phosphatase inhibitors (Pierce) and 1 mM EDTA. Four 10 cm Transwells (~3–4 × 10⁶ cells) were used per IP. In parallel, 4 μg of antibody or IgG control (Jackson ImmunoResearch, 011-000-003) was incubated with 40 μl protein G Dynabeads (Invitrogen) overnight and cross linked to the beads using 5 mM BS (ref. 3; Pierce) according to the manufacturer’s protocol. Cross linked lysates were incubated with the bead-conjugated antibodies overnight. Beads were then washed three times with lysis buffer and proteins were eluted as described above and separated by SDS–PAGE. Gels were silver-stained (Pierce SilverSnap kit), according to the manufacturer’s protocol. Gel slices were selected and excised using sterile scalpels and destained, reduced and alkylated before digestion with trypsin (Promega). Samples were analysed using nanoHPLC-electrospray tandem mass spectrometry (nanoLC-ESI-MS/MS) in a ThermoFinnigan LTQ Orbitrap hybrid mass spectrometer (ThermoElectron Bremen). Mascot (Matrix Sciences London) was used to search the Swissprot database to identify isolated peptides. Common contaminants such as trypsin, casein, keratin and microbial-specific proteins were removed from analysis. Results were visualized using Cytoscape 2.8.2 (ref. 58).
Total RNA isolation and qRT–PCR
Cells were lysed using Trizol (Invitrogen) and subjected to the Trizol Plus total transcriptome isolation protocol of the PureLink RNA mini kit (Ambion—Life Technologies) specified to isolate both mRNAs and miRNAs. Final RNA concentrations were determined using a NanoDrop spectrophotometer. RNA was converted to complementary DNA using a high capacity cDNA reverse transcriptase kit (Applied Biosystems). qPCR reactions were carried out using the TaqMan FAST Universal PCR master mix (Applied Biosystems), in a 7900 HT or ViiA 7 thermocycler (Applied Biosystems). Data were analysed using RQ Manager (Applied Biosystems). U6 was used as a control for miRNA expression normalization and GAPDH, β-actin for mRNA and pri/pre-miRNA normalization. Taq-Man assays used for miRNAs (Applied Biosystems, catalogue no. 4427975): hsa-miR-24, 000402; hsa-miR-30a, 000417; hsa-miR-30b, 000602; hsa-let-7g, 002282; hsa-miR-19a, 000395; U6, 001973. TaqMan assays for miRNA precursors: pri-miR-30b, Applied Biosystems, catalogue no. 4427012, Hs03303066_pri; pre-miR-30b, Custom Plus TaqMan RNA assay catalogue no. 4441114, assay ID AJN1E56, context sequence 5′-CTGTAATACATGGATTGGCTGGGAG-3′. TaqMan assays for mRNAs (Applied Biosystems, catalogue no. 4331182): PLEKHA7, Hs00697762_m1; SNAI1, Hs00195591_m1; MYC, Hs00153408_m1; CCND1, Hs00277039_m1; GAPDH, Hs99999905_m1; actin (ACTB), Hs99999903_m1.
RNA-IPs
RNA-IPs were carried out as described above for standard IPs, but with the addition of 100 U ml−1 RNAse inhibitor (Promega) in the lysis buffer. After the final wash, RNA was eluted from the beads using Trizol (Invitrogen) and purified as described above. qRT–PCRs were then carried out as above and the results were analysed using the Sigma RIP-qRT–PCR data analysis calculation shell, associated with the Sigma Imprint RIP kit (http://www.sigmaaldrich.com/life-science/epigenetics/imprint-rna.html and references therein).
Cell fractionation
To separate the nuclear fraction, cells were first lysed using a buffer containing 25 mM Tris pH 7.4, 150 mM NaCl, 5 mM MgCl2, 0.5% NP-40, protease (Cocktail III, RPI), phosphatase (Pierce) and RNAse (100 U ml−1; Promega) inhibitors for 10 min on ice. The lysates were centrifuged at 300g for 5 min at 4 °C to pellet the nuclei and the supernatant was carefully transferred to a fresh tube. The nuclear pellet was lysed using RIPA (see recipe above, immunoblotting section) with protease, phosphatase and RNAse inhibitors for 10 min on ice, homogenized through a 29 g needle and cleared by centrifugation for 5 min at 12,000g. Half of each lysate was used for SDS–PAGE, whereas the other half was mixed with Trizol and used to extract total RNA and cary out qRT–PCRs, as described above.
Proximity ligation
The Duolink In Situ Red Starter Kit Mouse/Rabbit (Sigma) was used according to the manufacturer’s instructions.
In vitro pri-miRNA processing assay
Total cDNA from Caco2 cells was obtained as described above (qRT–PCR section) and was used to amplify the pri-miR-30b transcript. The pri-miR-30b cDNA was then subcloned into the pBluescript SK+ vector, downstream of the T7 promoter, between the EcoRI and XhoI sites. Primers used: pri-30bF-XhoI, 5′-ATTAACTCGAGGTGAATGCTGTGCCTGTT C-3′; pri-30bR-EcoRI, 5′-ACGTTGAATTCGCCTCTGTATACTATTCTTGC-3′. The cloned pri-miR-30b sequence is as follows (the pre-mRNA sequence is shown in capital letters): 5′-gtgaatgctgtgcctgttctttttttcaacagagtcttacgtaaagaaccgtacaaactta gtaaagagtttaagtcctgctttaaACCAAGTTTCAGTTCATGTAAACATCCTACACTC AGCTGTAATACATGGATTGGCTGGGAGGTGGATGTTTACTTCAGCTGAC TTGGAatgtcaaccaattaacattgataaaagatttggcaagaatagtatacagaggc-3′. The pri-miR-30b construct was linearized using SmaI and in vitro transcription was carried out using T7 polymerase (Roche) and fluorescein isothiocyanate (FITC) RNA labelling mix (Roche), according to the manufacturer’s instructions. The FITC-labelled pri-miR-30b was gel-purified and stored at −20 °C in the dark for no more than a week. For the in vitro processing assay, IPs on Caco2 lysates were carried out as described above using IgG (negative control), a PLEKHA7 (Sigma) or a DGCR8 (Sigma) (positive control) antibody. For the PLEKHA7 knockdown experiment, control (NT) or PLEKHA7 shRNA cells were used and IPs were carried out using an IgG (negative control), or a DGCR8 (Sigma) antibody. After the final wash, the beads were mixed with a reaction mixture containing 20 mM Tris at pH 8.0, 100 mM KCl, 7 mM MgCl2, 20 mM creatine phosphate, 1 mM ATP, 0.2 mM phenylmethyl sulphonyl fluoride, 5 mM dithiothreitol, 10% glycerol, 2 U μl−1 RNAse inhibitor and 3 μg FITC-labelled pri-miR-30b. The labelled probe was denatured for 2 min at 95 °C and left to gradually cool down and refold before the assay. The processing assay was carried out for 90 min at 37 °C in the dark with constant gentle rocking. RNA was eluted with RNA elution buffer (2% SDS, 0.3 M NaOAc pH 5.2) purified with phenol–chloroform–IAA (25:24:1) pH 5.5 (Fisher), and precipitated overnight at −80°C using NaOAc 0.3 M pH 5.2, 1 μl glycogen (Invitrogen) and 4:1 100% EtOH. The RNA was recovered by full-speed centrifugation for 30 min at 4 °C, washed with 75% EtOH, resuspended in 7.5 μl DEPC–H2O, denatured in 1:1 Gel Loading Buffer II (Life Technologies) for 5 min at 95 °C, and loaded onto a 12% denaturing PAGE RNA gel (SequaGel; National Diagnostics). The gel was scanned using a Typhoon 9400 (GE Healthcare) and quantification of bands was carried out using ImageJ.
ISH
For ISH of pri-miR-30b, Caco2 cells were grown on slides, fixed with 10% formalin (Protocol; Fisher), dehydrated and rehydrated in a series of 50–70– 100–70–50% EtOH solutions, pretreated with protease and hybridized using the RNAscope 2.0 HD Brown assay (Advanced Cell Diagnostics, ACD), according to the manufacturer’s instructions. Probes used: human pri-miR-30b, ACD, 415331; positive control probe Hs-PPIB, ACD, 313906; negative control probe DapB, ACD, 310048. After ISH, cells were rinsed twice with PBS and blocked with Protein-Block reagent (Dako, X090930-2) for 10 min, and IF was carried out with an Ecad antibody (BD) diluted in antibody diluent (Dako, S302281-2) for 30 min; Ecad was the junctional marker used here because it resisted protease treatment and did not produce background due to formalin fixation. Cells were then washed three times with PBS and stained with a fluorescent-labelled secondary antibody and DAPI for 30 min. Cells were finally washed three times with PBS, mounted (Aqua Poly/Mount, Polysciences) and imaged using a Leica DM5000B microscope under bright (ISH) and fluorescent light (protein IF). All images were pseudocoloured and merged images were created using the microscope’s Leica suite software.
NanoString miRNA analysis
Total RNA was isolated as above and global miRNA analysis was carried out using the nCounter Human v2 miRNA expression assay (NanoString) containing 735 miRNAs. Data were collected using the nCounter Digital Analyzer (NanoString). miRNAs were first elongated by a sequence-specific ligation and were then hybridized with specific, barcoded probes. The raw units that result from the NanoString reaction reflect the number of times each probe is counted in a sample of the total hybridization reaction and represent the frequency of each miRNA, without amplification of starting material. The raw units were then normalized for RNA input and background noise to internal positive and negative controls according to the manufacturer’s instructions. miRNAs with low counts at the level of the negative controls were excluded.
Northern blot
10–20 μg of total RNA or the Low Range ssRNA Ladder (NEB) were mixed in a 1:1 volume ratio with Gel Loading Buffer II (Life Technologies), denatured at 95 °C for 5 min and loaded onto 12% denaturing PAGE RNA gels (SequaGel; National Diagnostics). RNAs were then transferred to Hybond N+ membranes (Amersham, GE Healthcare) for 2 h at 250 mA using a semidry apparatus (Hoefer TE70) and cross linked using a Stratalinker (Stratagene). Northern blot was carried out using the DIG Northern Starter Kit (Roche) and the DIG Wash and Block Buffer Set (Roche) according to the manufacturer’s protocol. Hybridization and stringent washes were carried out at 50 °C; probes were used at 5 nM final concentration. Probes used: hsa-miR-30b miRCURY LNA Detection probe, DIG labelled, Exiqon, 18143-15; U6 hsa/mmu/rno control, miRCURY LNA detection probe, DIG Labelled, Exiqon, 99002-01.
Statistics and reproducibility
For all quantitative experiments, averages and s.d. were calculated and presented as error bars, whereas the number of independent experiments carried out and the related statistics are indicated in each figure legend. Student’s two-tailed t-test was employed for P-value calculations because all comparisons were between two groups, control and experimental condition. For all other experiments, at least three independent experiments were carried out and a representative is shown in Figs 1a–h, 2b,d–f, 3b (left panel), 3d–g, 4b–g, 5c,d, 6b–k, 7a–i and 8a,c,d,f; and Supplementary Figs 1a–j, 2a–c, 3b–i, 4c–e, 5b–d,g–i, 6a–h and 7a–d,f–h,j–m.
Accession numbers
The NanoString data generated for this manuscript were submitted to the Gene Expression Omnibus database, accession number GSE61593.
Supplementary Material
Supplementary Table 1 The proteins identified by proteomics of junctional fractions.
Supplementary Table 2 The source data file.
Supplementary Table 3 The antibodies used in the study.
Acknowledgments
This work was supported by NIH R01 CA100467, R01 NS069753, P50 CA116201 (P.Z.A.); NIH R01 GM086435, Florida Department of Health, Bankhead-Coley 10BG11 (P.S.); NIH/NCI R01CA104505, R01CA136665 (J.A.C.); BCRF (E.A.P.); the Swiss Cancer League (S.C., Project KLS-2878-02-2012). A.K. is supported by the Jay and Deanie Stein Career Development Award for Cancer Research at Mayo Clinic. We thank Mayo Clinic’s Proteomics Core and B. Madden for assistance with mass spectrometry, B. Edenfield for immunohistochemistry, M. Takeichi, D. Radisky and M. Cichon for constructs, and D. Radisky, L. Lewis-Tuffin, J. C. Dachsel, B. Necela and the late G. Hayes for suggestions and comments.
Footnotes
Note: Supplementary Information is available in the online version of the paper
AUTHOR CONTRIBUTIONS
A.K. designed the study, conceived and designed experiments, carried out all experiments except those described below, analysed the data and wrote the manuscript. S.P.N. made constructs. P.P. and S.C. developed antibodies and constructs. R.W.F. provided technical support. L.R.C. assisted with IF. T.R.B., J.M.C. and E.A.T. carried out the NanoString experiment and assisted with qRT–PCRs. I.K.Y. and T.P. assisted with the ISH assay. E.A.P., P.S., S.B. and J.A.C. developed and provided tissue micro-arrays. P.Z.A. conceived and designed the study, conceived and designed experiments and wrote the manuscript.
COMPETING FINANCIAL INTERESTS
The authors declare no competing financial interests.
References
- 1.Reynolds AB, Roesel DJ, Kanner SB, Parsons JT. Transformation-specific tyrosine phosphorylation of a novel cellular protein in chicken cells expressing oncogenic variants of the avian cellular src gene. Mol Cell Biol. 1989;9:629–638. doi: 10.1128/mcb.9.2.629. [DOI] [PMC free article] [PubMed] [Google Scholar]
- 2.Ireton RC, et al. A novel role for p120 catenin in E-cadherin function. J Cell Biol. 2002;159:465–476. doi: 10.1083/jcb.200205115. [DOI] [PMC free article] [PubMed] [Google Scholar]
- 3.Ishiyama N, et al. Dynamic and static interactions between p120 catenin and E-cadherin regulate the stability of cell–cell adhesion. Cell. 2010;141:117–128. doi: 10.1016/j.cell.2010.01.017. [DOI] [PubMed] [Google Scholar]
- 4.Yap AS, Niessen CM, Gumbiner BM. The juxtamembrane region of the cadherin cytoplasmic tail supports lateral clustering, adhesive strengthening, and interaction with p120ctn. J Cell Biol. 1998;141:779–789. doi: 10.1083/jcb.141.3.779. [DOI] [PMC free article] [PubMed] [Google Scholar]
- 5.Davis MA, Ireton RC, Reynolds AB. A core function for p120-catenin in cadherin turnover. J Cell Biol. 2003;163:525–534. doi: 10.1083/jcb.200307111. [DOI] [PMC free article] [PubMed] [Google Scholar]
- 6.Anastasiadis PZ. p120-ctn: A nexus for contextual signaling via Rho GTPases. Biochim Biophys Acta. 2007;1773:34–46. doi: 10.1016/j.bbamcr.2006.08.040. [DOI] [PubMed] [Google Scholar]
- 7.Wildenberg GA, et al. p120-catenin and p190RhoGAP regulate cell–cell adhesion by coordinating antagonism between Rac and Rho. Cell. 2006;127:1027–1039. doi: 10.1016/j.cell.2006.09.046. [DOI] [PubMed] [Google Scholar]
- 8.Smith AL, Dohn MR, Brown MV, Reynolds AB. Association of Rho-associated protein kinase 1 with E-cadherin complexes is mediated by p120-catenin. Mol Biol Cell. 2012;23:99–110. doi: 10.1091/mbc.E11-06-0497. [DOI] [PMC free article] [PubMed] [Google Scholar]
- 9.Schackmann RC, et al. Cytosolic p120-catenin regulates growth of metastatic lobular carcinoma through Rock1-mediated anoikis resistance. J Clin Invest. 2011;121:3176–3188. doi: 10.1172/JCI41695. [DOI] [PMC free article] [PubMed] [Google Scholar]
- 10.Stairs DB, et al. Deletion of p120-catenin results in a tumor microenvironment with inflammation and cancer that establishes it as a tumor suppressor gene. Cancer Cell. 2011;19:470–483. doi: 10.1016/j.ccr.2011.02.007. [DOI] [PMC free article] [PubMed] [Google Scholar]
- 11.Mariner DJ, Davis MA, Reynolds AB. EGFR signaling to p120-catenin through phosphorylation at Y228. J Cell Sci. 2004;117:1339–1350. doi: 10.1242/jcs.01001. [DOI] [PubMed] [Google Scholar]
- 12.Johnson E, et al. HER2/ErbB2-induced breast cancer cell migration and invasion require p120 catenin activation of Rac1 and Cdc42. J Biol Chem. 2010;285:29491–29501. doi: 10.1074/jbc.M110.136770. [DOI] [PMC free article] [PubMed] [Google Scholar]
- 13.Dohn MR, Brown MV, Reynolds AB. An essential role for p120-catenin in Src- and Rac1-mediated anchorage-independent cell growth. J Cell Biol. 2009;184:437–450. doi: 10.1083/jcb.200807096. [DOI] [PMC free article] [PubMed] [Google Scholar]
- 14.Yanagisawa M, Anastasiadis PZ. p120 catenin is essential for mesenchymal cadherin-mediated regulation of cell motility and invasiveness. J Cell Biol. 2006;174:1087–1096. doi: 10.1083/jcb.200605022. [DOI] [PMC free article] [PubMed] [Google Scholar]
- 15.Soto E, et al. p120 catenin induces opposing effects on tumor cell growth depending on E-cadherin expression. J Cell Biol. 2008;183:737–749. doi: 10.1083/jcb.200805113. [DOI] [PMC free article] [PubMed] [Google Scholar]
- 16.Silvera D, et al. Essential role for eIF4GI overexpression in the pathogenesis of inflammatory breast cancer. Nat Cell Biol. 2009;11:903–908. doi: 10.1038/ncb1900. [DOI] [PubMed] [Google Scholar]
- 17.Liu WF, Nelson CM, Pirone DM, Chen CS. E-cadherin engagement stimulates proliferation via Rac1. J Cell Biol. 2006;173:431–441. doi: 10.1083/jcb.200510087. [DOI] [PMC free article] [PubMed] [Google Scholar]
- 18.Lewis-Tuffin LJ, et al. Misregulated E-cadherin expression associated with an aggressive brain tumor phenotype. PLoS ONE. 2010;5:e13665. doi: 10.1371/journal.pone.0013665. [DOI] [PMC free article] [PubMed] [Google Scholar]
- 19.Rodriguez FJ, Lewis-Tuffin LJ, Anastasiadis PZ. E-cadherin’s dark side: Possible role in tumor progression. Biochim Biophys Acta. 2012;1826:23–31. doi: 10.1016/j.bbcan.2012.03.002. [DOI] [PMC free article] [PubMed] [Google Scholar]
- 20.Kuphal S, Bosserhoff AK. E-cadherin cell–cell communication in melanogenesis and during development of malignant melanoma. Arch Biochem Biophys. 2012;524:43–47. doi: 10.1016/j.abb.2011.10.020. [DOI] [PubMed] [Google Scholar]
- 21.Meng W, Mushika Y, Ichii T, Takeichi M. Anchorage of microtubule minus ends to adherens junctions regulates epithelial cell–cell contacts. Cell. 2008;135:948–959. doi: 10.1016/j.cell.2008.09.040. [DOI] [PubMed] [Google Scholar]
- 22.Pulimeno P, Bauer C, Stutz J, Citi S. PLEKHA7 is an adherens junction protein with a tissue distribution and subcellular localization distinct from ZO-1 and E-cadherin. PLoS ONE. 2010;5:e12207. doi: 10.1371/journal.pone.0012207. [DOI] [PMC free article] [PubMed] [Google Scholar]
- 23.Miyoshi J, Takai Y. Structural and functional associations of apical junctions with cytoskeleton. Biochim Biophys Acta. 2008;1778:670–691. doi: 10.1016/j.bbamem.2007.12.014. [DOI] [PubMed] [Google Scholar]
- 24.Smutny M, et al. Myosin II isoforms identify distinct functional modules that support integrity of the epithelial zonula adherens. Nat Cell Biol. 2010;12:696–702. doi: 10.1038/ncb2072. [DOI] [PMC free article] [PubMed] [Google Scholar]
- 25.Mariner DJ, et al. Identification of Src phosphorylation sites in the catenin p120ctn. J Biol Chem. 2001;276:28006–28013. doi: 10.1074/jbc.M102443200. [DOI] [PubMed] [Google Scholar]
- 26.Ma LW, Zhou ZT, He QB, Jiang WW. Phosphorylated p120-catenin expression has predictive value for oral cancer progression. J Clin Pathol. 2012;65:315–319. doi: 10.1136/jclinpath-2011-200516. [DOI] [PubMed] [Google Scholar]
- 27.Kourtidis A, Ngok SP, Anastasiadis PZ. p120 catenin: an essential regulator of cadherin stability, adhesion-induced signaling, and cancer progression. Prog Mol Biol Transl Sci. 2013;116:409–432. doi: 10.1016/B978-0-12-394311-8.00018-2. [DOI] [PMC free article] [PubMed] [Google Scholar]
- 28.Tikhmyanova N, Golemis EA. NEDD9 and BCAR1 negatively regulate E-cadherin membrane localization, and promote E-cadherin degradation. PLoS ONE. 2011;6:e22102. doi: 10.1371/journal.pone.0022102. [DOI] [PMC free article] [PubMed] [Google Scholar]
- 29.Chang JH, Gill S, Settleman J, Parsons SJ. c-Src regulates the simultaneous rearrangement of actin cytoskeleton, p190RhoGAP, and p120RasGAP following epidermal growth factor stimulation. J Cell Biol. 1995;130:355–368. doi: 10.1083/jcb.130.2.355. [DOI] [PMC free article] [PubMed] [Google Scholar]
- 30.Wang Y, et al. Synergistic effect of cyclin D1 and c-Myc leads to more aggressive and invasive mammary tumors in severe combined immunodeficient mice. Cancer Res. 2007;67:3698–3707. doi: 10.1158/0008-5472.CAN-06-4000. [DOI] [PubMed] [Google Scholar]
- 31.Eiseler T, et al. Protein kinase D1 mediates anchorage-dependent and -independent growth of tumor cells via the zinc finger transcription factor Snail1. J Biol Chem. 2012;287:32367–32380. doi: 10.1074/jbc.M112.370999. [DOI] [PMC free article] [PubMed] [Google Scholar]
- 32.Thoreson MA, et al. Selective uncoupling of p120(ctn) from E-cadherin disrupts strong adhesion. J Cell Biol. 2000;148:189–202. doi: 10.1083/jcb.148.1.189. [DOI] [PMC free article] [PubMed] [Google Scholar]
- 33.Ozawa M, Ohkubo T. Tyrosine phosphorylation of p120(ctn) in v-Src transfected L cells depends on its association with E-cadherin and reduces adhesion activity. J Cell Sci. 2001;114:503–512. doi: 10.1242/jcs.114.3.503. [DOI] [PubMed] [Google Scholar]
- 34.Zhou BP, et al. Dual regulation of Snail by GSK-3β-mediated phosphorylation in control of epithelial-mesenchymal transition. Nat Cell Biol. 2004;6:931–940. doi: 10.1038/ncb1173. [DOI] [PubMed] [Google Scholar]
- 35.Yook JI, et al. A Wnt-Axin2-GSK3β cascade regulates Snail1 activity in breast cancer cells. Nat Cell Biol. 2006;8:1398–1406. doi: 10.1038/ncb1508. [DOI] [PubMed] [Google Scholar]
- 36.Fabian MR, Sonenberg N, Filipowicz W. Regulation of mRNA translation and stability by microRNAs. Annu Rev Biochem. 2010;79:351–379. doi: 10.1146/annurev-biochem-060308-103103. [DOI] [PubMed] [Google Scholar]
- 37.Krol J, Loedige I, Filipowicz W. The widespread regulation of microRNA biogenesis, function and decay. Nat Rev Genet. 2010;11:597–610. doi: 10.1038/nrg2843. [DOI] [PubMed] [Google Scholar]
- 38.Meijer HA, et al. Translational repression and eIF4A2 activity are critical for microRNA-mediated gene regulation. Science. 2013;340:82–85. doi: 10.1126/science.1231197. [DOI] [PubMed] [Google Scholar]
- 39.Pillai RS, et al. Inhibition of translational initiation by Let-7 MicroRNA in human cells. Science. 2005;309:1573–1576. doi: 10.1126/science.1115079. [DOI] [PubMed] [Google Scholar]
- 40.Croce CM. Causes and consequences of microRNA dysregulation in cancer. Nat Rev Genet. 2009;10:704–714. doi: 10.1038/nrg2634. [DOI] [PMC free article] [PubMed] [Google Scholar]
- 41.Adams BD, Kasinski AL, Slack FJ. Aberrant regulation and function of MicroRNAs in cancer. Curr Biol. 2014;24:R762–R776. doi: 10.1016/j.cub.2014.06.043. [DOI] [PMC free article] [PubMed] [Google Scholar]
- 42.Joglekar MV, et al. The miR-30 family microRNAs confer epithelial phenotype to human pancreatic cells. Islets. 2009;1:137–147. doi: 10.4161/isl.1.2.9578. [DOI] [PubMed] [Google Scholar]
- 43.Watanabe S, et al. HMGA2 maintains oncogenic RAS-induced epithelial-mesenchymal transition in human pancreatic cancer cells. Am J Pathol. 2009;174:854–868. doi: 10.2353/ajpath.2009.080523. [DOI] [PMC free article] [PubMed] [Google Scholar]
- 44.Zhang J, et al. miR-30 inhibits TGF-β1-induced epithelial-to-mesenchymal transition in hepatocyte by targeting Snail1. Biochem Biophys Res Commun. 2012;417:1100–1105. doi: 10.1016/j.bbrc.2011.12.121. [DOI] [PubMed] [Google Scholar]
- 45.Buechner J, et al. Tumour-suppressor microRNAs let-7 and mir-101 target the proto-oncogene MYCN and inhibit cell proliferation in MYCN-amplified neuroblastoma. Br J Cancer. 2011;105:296–303. doi: 10.1038/bjc.2011.220. [DOI] [PMC free article] [PubMed] [Google Scholar]
- 46.Lan FF, et al. Hsa-let-7g inhibits proliferation of hepatocellular carcinoma cells by downregulation of c-Myc and upregulation of p16(INK4A) Int J Cancer. 2011;128:319–331. doi: 10.1002/ijc.25336. [DOI] [PubMed] [Google Scholar]
- 47.Lal A, et al. miR-24 Inhibits cell proliferation by targeting E2F2, MYC, and other cell-cycle genes via binding to “seedless” 3′UTR microRNA recognition elements. Mol Cell. 2009;35:610–625. doi: 10.1016/j.molcel.2009.08.020. [DOI] [PMC free article] [PubMed] [Google Scholar]
- 48.Ha M, Kim VN. Regulation of microRNA biogenesis. Nat Rev Mol Cell Biol. 2014;15:509–524. doi: 10.1038/nrm3838. [DOI] [PubMed] [Google Scholar]
- 49.Gregory RI, et al. The microprocessor complex mediates the genesis of microRNAs. Nature. 2004;432:235–240. doi: 10.1038/nature03120. [DOI] [PubMed] [Google Scholar]
- 50.Lee Y, et al. The nuclear RNase III Drosha initiates microRNA processing. Nature. 2003;425:415–419. doi: 10.1038/nature01957. [DOI] [PubMed] [Google Scholar]
- 51.Han J, et al. The Drosha-DGCR8 complex in primary microRNA processing. Genes Dev. 2004;18:3016–3027. doi: 10.1101/gad.1262504. [DOI] [PMC free article] [PubMed] [Google Scholar]
- 52.He L, et al. A microRNA polycistron as a potential human oncogene. Nature. 2005;435:828–833. doi: 10.1038/nature03552. [DOI] [PMC free article] [PubMed] [Google Scholar]
- 53.Olive V, et al. miR-19 is a key oncogenic component of mir-17–92. Genes Dev. 2009;23:2839–2849. doi: 10.1101/gad.1861409. [DOI] [PMC free article] [PubMed] [Google Scholar]
- 54.Pulimeno P, Paschoud S, Citi S. A role for ZO-1 and PLEKHA7 in recruiting paracingulin to tight and adherens junctions of epithelial cells. J Biol Chem. 2011;286:16743–16750. doi: 10.1074/jbc.M111.230862. [DOI] [PMC free article] [PubMed] [Google Scholar]
- 55.Kurita S, Yamada T, Rikitsu E, Ikeda W, Takai Y. Binding between the junctional proteins afadin and PLEKHA7 and implication in the formation of adherens junction in epithelial cells. J Biol Chem. 2013;288:29356–29368. doi: 10.1074/jbc.M113.453464. [DOI] [PMC free article] [PubMed] [Google Scholar]
- 56.Paschoud S, Jond L, Guerrera D, Citi S. PLEKHA7 modulates epithelial tight junction barrier function. Tissue Barriers. 2014;2:e28755. doi: 10.4161/tisb.28755. [DOI] [PMC free article] [PubMed] [Google Scholar]
- 57.Smith AL, Friedman DB, Yu H, Carnahan RH, Reynolds AB. ReCLIP (reversible cross-link immuno-precipitation): an efficient method for interrogation of labile protein complexes. PLoS ONE. 2011;6:e16206. doi: 10.1371/journal.pone.0016206. [DOI] [PMC free article] [PubMed] [Google Scholar]
- 58.Smoot ME, Ono K, Ruscheinski J, Wang PL, Ideker T. Cytoscape 2.8: new features for data integration and network visualization. Bioinformatics. 2011;27:431–432. doi: 10.1093/bioinformatics/btq675. [DOI] [PMC free article] [PubMed] [Google Scholar]
Associated Data
This section collects any data citations, data availability statements, or supplementary materials included in this article.
Supplementary Materials
Supplementary Table 1 The proteins identified by proteomics of junctional fractions.
Supplementary Table 2 The source data file.
Supplementary Table 3 The antibodies used in the study.