Abstract
Creatine (Cr) is a guanidino compound required for rapid replenishment of ATP in cells with a high-energy demand. In humans, mutations in the Cr transporter (CRT;SLC6A8) prevent Cr entry into tissue and result in significant intellectual impairment, epilepsy, and aphasia. The lack of Cr on both whole body and cellular metabolism was evaluated in Crt knockout (Crt−/y) mice, a high-fidelity model of human CRT deficiency. Crt−/y mice have reduced body mass however show a two-fold increase in body fat. There was increased energy expenditure in a homecage environment and during treadmill running in Crt−/y mice. Consistent with the increases in whole-body metabolic function, Crt−/y mice show increases in cellular metabolism as well. Mitochondrial respiration increased in skeletal muscle fibers and hippocampal lysates from Crt−/y mice. In addition, Crt−/y mice had increased citrate synthase activity, suggesting a higher number of mitochondria instead of an increase in mitochondrial activity. In order to determine if the increase in respiration was due to increased mitochondrial numbers, we measured oxygen consumption in an equal number of mitochondria from Crt+/y and Crt−/y mice. There were no changes in mitochondrial respiration when normalized to mitochondrial number, suggesting that the increase in respiration observed could be to higher mitochondrial content in Crt−/y mice.
Introduction
The creatine transporter (CrT; SLC6A8) is a member of the solute carrier 6 family of sodium and chloride dependent transporters and is required for cellular uptake of creatine (Cr). Mutations in the CrT lead to Creatine Transporter Deficiency (CTD), which is characterized by moderate to severe intellectual disability, aphasia and controllable epilepsy (deGrauw et al. 2003; DeGrauw et al. 2002). SLC6A8 is located on the X-chromosome with CTD showing an X-linked pattern of inheritance (Gregor et al. 1995; deGrauw et al. 2003). CTD is a leading cause of X-linked intellectual disability (XLID), responsible for 1–3% of all XLID (Rosenberg et al. 2004; Clark et al. 2006). To date no treatment is available for CTD.
There are three known types of Cr deficiency syndromes (CDS) characterized by diminished Cr levels in the brain and periphery, and additionally, decreased bioavailability of ATP to maintain normal cellular function. Cr deficiency syndromes (CDS) are a result of errors of Cr biosynthesis (AGAT and GAMT deficiency) or a global lack of Cr transporter (CTD) (Alcaide et al. 2011; Braissant et al. 2011; Schulze 2003; Stockler et al. 2007). Regardless of origin, CDS leads to severe developmental delay, epilepsy, and an overall diminished quality of life. Oral Cr supplementation has been shown to ameliorate motor deficits in CDS resulting from defective biosynthesis (Morris et al. 2007); however, Cr supplementation has been ineffective in the treatment of CTD (van de Kamp et al. 2012). Of specific interest to the current study is the latter form of CDS, and in particular how a lack of CrT effects overall metabolic function.
The primary role of creatine (Cr) is buffering ATP levels in high-energy tissues such as brain and muscle. Cr kinase (CK) phosphorylates Cr to form readily available phosphate pools. Upon consumption of ATP, CK takes the phosphate group from phosphor-Cr and donates it to ADP. It has been estimated that in many high-energy cells, the majority of ATP generated by the mitochondria are used to make P-Cr that then diffuses into the cytoplasm (Wallimann et al. 2011). Acute loss of Cr using pharmacological agents that block the CrT in the heart leads to mitochondrial impairment and, ultimately, insufficient ATP to carry out normal cellular processes, suggesting perturbed energy metabolism in CTD (O'Gorman et al. 1996). Interestingly, GPA administration increased mitochondrial density in the striatum of mice (Horvath et al. 2011).
Evidence of mitochondrial dysfunction in other models of Cr deficiency suggests that mitochondrial function may also be abnormal in CTD. Neurons lacking creatine kinase have increased mitochondrial motility as compared to normal neurons (Kuiper et al. 2008). While overall mitochondrial number was similar in CK deficient neurons, there was an increase in motile mitochondria compared with neurons from wild-type animals. In an attempt to replenish ATP to areas with high-energy demands, CK deficient cells may need to distribute mitochondria differently than normal cells. This increase in motility may reflect a compensatory response to energy shortages in CK deficient neurons. Additionally, in a mouse model of deficient Cr biosynthesis, increased ATP synthase activity in brain and muscle points to adaptive mechanisms in response to ATP shortages (Schmidt et al. 2004), further supporting a role for metabolic dysfunction in CDS.
In order to better understand and to develop treatments for CTD, we have developed the CrT knockout (Crt−/y) mouse that shows significant impairments in a battery of cognitive tests, suggesting that this mouse is a high-fidelity model of CTD (Skelton et al. 2011). The purpose of this study was to characterize the metabolic phenotype of Crt−/y mice by examining whole body metabolism,
Methods
Subjects
Crt+/y and Crt−/y mice were derived from breeding CrT+/− females to Crt+/y males (Skelton et al. 2011). To control for litter effects, each experiment only used one Crt+/y and Crt−/y mouse from each litter. Mice were kept on a 14:10 light:dark cycle in the CCRF vivarium which is fully accredited by AAALAC and all experiments were approved by CCRF IACUC prior to the beginning of the experiment.
Whole body calorimetry
Calorimetry was performed using the Oxymax system from Columbus Instruments (Columbus, OH) as previously described (Powers et al. 2013). Calorimetry was evaluated for 9h during the initial light phase, 10 h for the dark phase and 4 h during the morning light phase. Resting oxygen consumption and carbon dioxide production rates (VO2 and VCO2 respectively) were measured every 10 minutes and normalized to body weight. Animals were given free access to water and food during testing. Food was weighed following testing. A total of 8 Crt+/y and 10 Crt−/y mice were used.
The following day, mice were exercised on a motorized treadmill placed inside of a sealed chamber. The initial speed of the treadmill was 5 m/min and was increased stepwise by 5 m/min every 5 min until a final speed of 25 m/min was reached. VO2 and VCO2 were sampled every 30 sec and normalized to the body weight of the animal. Respiratory exchange ratio (RER), a measure that determines if carbohydrates, fatty acids, or protein are being utilized for energy (Simonson and DeFronzo 1990), and energy expenditure were calculated using CLAX software from Columbus Instruments.
Body composition analysis
Body composition was determined using EchoMRI (Houston, TX). Briefly, animals were placed into the EchoMRI and total body fat, lean body mass, and water content were derived for each animal. Body fat percentage was calculated by dividing body fat by mass.
ATP assay
Crt+/y and Crt−/y mice were decapitated following brief isofluorane anesthesia. The brain, heart and gastrocnemius muscle were dissected and rapidly frozen in dry ice-cooled isopentane. Samples were weighed and homogenized in an equal volume of perchloric acid. ATP levels were analyzed using a commercially available fluorescence kit (Abcam Cambridge, MA). ATP levels were normalized to tissue weight. Percent control levels were determined by dividing all samples by the mean of the Crt+/y mice for the specific tissue studied.
High-resolution respirometry
Mitochondrial respiration was analyzed using the Oroboros Oxygraph-2K (Oroboros Instruments, Innsbruck, Austria). Muscle fibers from the quadriceps and hippocampal lysates from Crt+/y and Crt−/y mice were prepared in MiR05 buffer (Gnaiger et al. 2000). Approximately 2 mg of wet-weight tissue was used in each preparation. Samples from Crt+/y and Crt−/y mice were run in the side-by-side chambers in order to minimize any ambient effects on mitochondrial respiration. Oxygen consumption and oxygen flux were monitored in real-time using DatLab4.3 software from Oroboros.
For hippocampal lysates, a substrate/uncoupler/inhibitor titration (SUIT) protocol was performed to assess mitochondrial respiration (Karlsson et al. 2013). Tissue was allowed to stabilize for approximately 15 min prior to the addition of substrates. Malate (5 mM) and pyruvate (5 mM) were added followed by ADP (1 mM) and glutamate (5 mM) to assess the NADH-related oxidative phosphorylation (OXPHOS) capacity of CI (OXPHOS CI). Maximal OXPHOS was stimulated by the addition of 10 mM succinate (OXPHOS CI+CII). Oligomycin was added to determine mitochondrial respiration independent of ATP-production (LEAK CI+CII). A titration of carbonyl cyanide p-(trifluoromethoxy) phenylhydrazone (FCCP) was added until no further increase in OXPHOS capacity was observed (ETC CI+CII). Rotenone was added to assess ETC capacity through CII (ETC CII). Antimycin-A was added to inhibit electron flow through the ETC. Control ratios for OXPHOS CI+CII and ETC CI+CII were derived by dividing the respective rates by the LEAK respiration rate. Data were normalized to total protein levels as determined by the Bradford protein assay.
Muscle fibers were excised from Crt+/y and Crt−/y mice, permeabilized with 50 µg/ml of saponin, and placed into the Oxygraph in a similar manner as the hippocampi. To assess OXPHOS CI, 2.5 mM ADP and 5 mM glutamate were added sequentially. OXPHOS CI+CII was assessed by adding succinate and 5 mM ADP followed by the addition of cytochrome c (CytC) to assess the integrity of the outer membrane of the mitochondria. ETS CI+CII was determined using FCCP and rotenone was added to evaluate ETS CII. Data were normalized to the wet weight of the fibers.
Seahorse XF24 assay
To assess the individual contribution of Complex I and Complex II in the respiratory increases in Crt−/y mice, mitochondrial function was assessed using equivalent amounts of mitochondrial protein in a Seahorse XF24e analyzer. Hippocampi from Crt+/y and Crt−/y mice (n=4) were dissected on ice and homogenized in mitochondrial isolation buffer (320 mM sucrose, 10 mM Tris, 1 mM K+ EDTA, and 2.5 g/L BSA, pH=7.4) using a Teflon-glass homogenizer. Samples were centrifuged for 10 min at 1,000g to remove cellular debris. The lysate was collected and centrifuged for 10 minutes at 6,400g. The lysate was removed and the pellet containing the crude mitochondrial preparation was resuspended in mitochondrial activation solution (MAS) without BSA (70 mM sucrose, 210 mM mannitol, 1mM EGTA, pH 7.2). An aliquot was removed from the sample for protein level determination and BSA was added to the remaining sample for a final concentration of 0.5% (w/V). Mitochondria were kept on ice while protein levels were determined using a Bradford assay according to the manufacturers suggestion. Samples were adjusted for mitochondrial protein levels and 10 µg of mitochondrial protein in 50 µl of MAS solution from each subject were loaded onto the XF24 plate. The plate was centrifuged for 20 minutes at 2,000g using a swinging bucket rotor. The total volume in each well was then raised to 500 µl by adding warmed (37°) MAS solution containing either a) malate (2 mM) and pyruvate (10 mM) or b) rotenone (2 µM) and succinate (10 mM). The plate was then transferred to the XF24 analyzer and the experiment was initiated. The XF24 samples oxygen consumption every 10 min and compounds were injected from the pre-loaded ports every 30 min. Injections were as follows (final concentration): A) ADP (4 mM); B) Oligiomycin (2.5 µg/mL); C) FCCP (4 µM); and D) antimycin A (4 µM). Following completion of the assay, protein levels were re-determined by Bradford assay and the data were normalized to protein levels. Samples were run in duplicate for each combination of sample and substrate.
Western blotting
Mitochondria from the hippocampus of Crt−/y and Crt+/y mice were isolated as described above and separated on 12% Mini-PROTEAN® TGX pre-cast gels. Proteins were transferred to PVDF membranes and blocked using Odyssey blocking buffer (Li-Cor, Lincoln, Nebraska). Membranes were incubated with a Total OXPHOS Rodent WB Antibody Cocktail (Abcam, Cambridge, MA) at a 1:1000 dilution for 18 h at 4° C. This cocktail contains 5 antibodies, each directed at a specific protein in the OXPHOS complex. Complex 1 is probed using NDUF88, Complex II is represented by SDHB, Complex III by UQCRC2, Complex IV by MTCO1, and Complex V by ATP5A. The blot was concurrently probed with an Actin antibody (Abcam) at a concentration of 1:500 as a loading control. Following washing of the primary antibody, the blot was incubated with 1:10,000 dilution of IRDye 680RD Donkey anti-mouse secondary antibody (Li-Cor, Lincoln Nebraska) for the OXPHOS proteins and a IRDye 800CW Donkey anti-goat antibody for actin (Li-Cor). Fluorescent images were acquired on an Odyssey CLx (Li-Cor) imager and fluorescence was quantified using the software from the manufacturer. OXPHOS signals were normalized to the actin signal.
Statistical Analysis
Mitochondrial respiration and whole body calorimetry data were analyzed using 2-way repeated measures ANOVA with gene and time as factors (Graphpad Prism, La Jolla, CA). Significant interactions were examined using Sidak correction and data were considered significant if p<0.05. ATP, weight, food consumption and body composition were analyzed by two-tailed t test. Data are presented as mean+/−SEM.
Results
Body composition
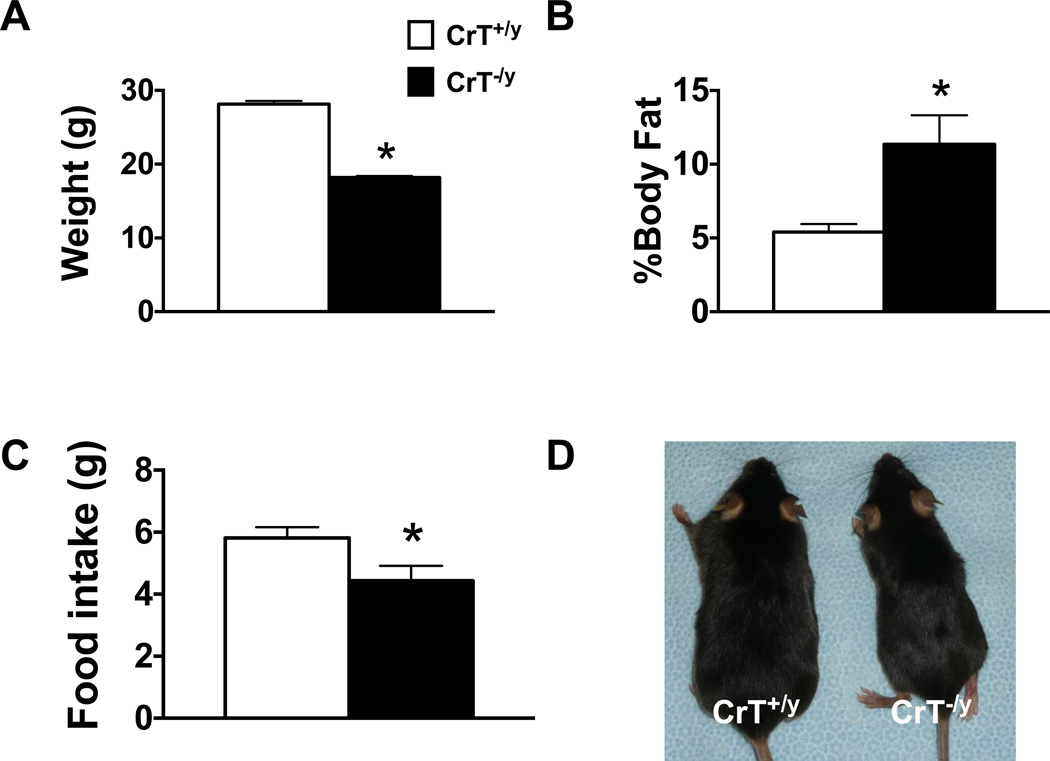
In agreement with previous data Crt−/y mice weighed less than their Crt+/y counterparts did (t10=21.7, p<0.001; Figure 1A). Body composition analysis showed that Crt−/y mice have an increase in body fat percentage when compared with Crt+/y mice (t10=2.23, p<0.05; Figure 1B). Over 23h, Crt−/y mice consumed less food than Crt+/y mice (t10=3.90, p<0.05; Figure 1C) however no differences were observed when adjusted for the body weight of the animal.
Figure 1.
Crt−/y mice show reductions in body weight (A) and food intake (C) compared with Crt+/y mice. Interestingly, Crt−/y mice had a higher body fat percentage (B) compared with Crt+/y mice. (D) Shows a representative image of Crt+/y (left) and Crt−/y (right) mice. Values are mean +/− SEM. *p<0.05 n=6–13 per group
ATP levels
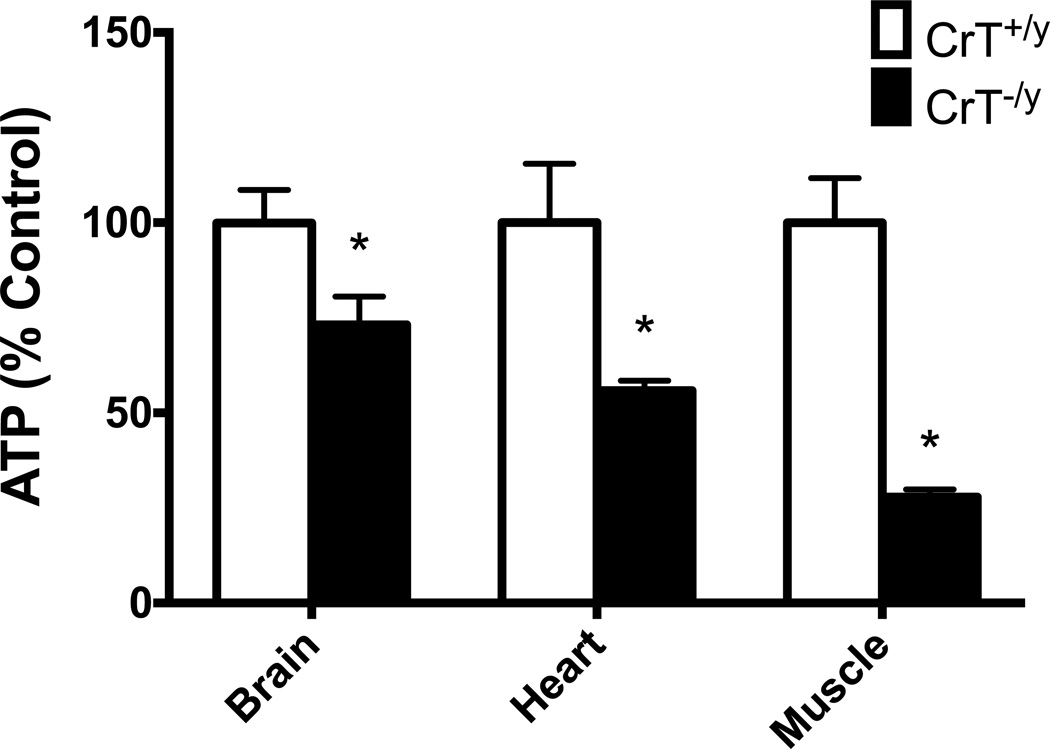
CrT−/y mice showed ATP reductions in the brain (t10=2.3, p<0.05), heart (t10=2.91, p<0.05) and gastrocnemius muscle (t9=6.7, p<0.001) compared with CrT+/y mice (Figure 2).
Figure 2.
Crt−/y mice have reduced ATP levels in the brain, heart and muscle compared with Crt+/y mice. Values are mean +/− SEM. *p<0.05 n=6 per group
Whole body calorimetry-Home Cage
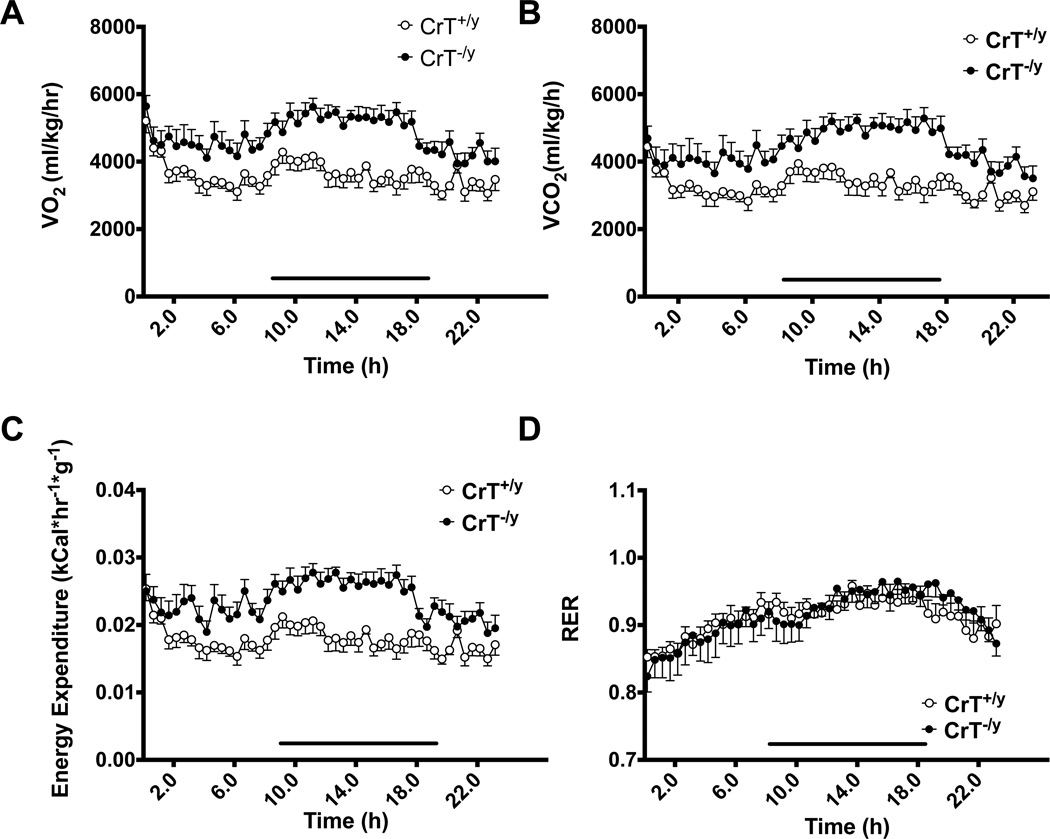
Crt−/y mice had increased oxygen consumption (VO2) (gene: (F(1,16)=18.6, p<0.001; Figure 3A) at rest compared with Crt+/y mice. Interactions between time and gene were observed; however, there were no consistent differences between individual time points. Crt−/y mice had increased CO2 production (F(1,16)=16.91, p<0.001; Figure 3B) compared with Crt+/y mice. When looking at energy expenditure, Crt−/y mice consumed more calories per body weight when compared with Crt+/y mice (F(1,16)=17.32, p<0.001; Figure 3C). No significant difference in RER was observed (Figure 3D).
Figure 3.
Crt−/y mice show increased calorie use, oxygen consumption and carbon dioxide release compared with Crt+/y mice. Line above x-axis denotes dark cycle of testing. n=8–10 per group Values are mean +/− SEM.
Whole body calorimetry-forced exercise
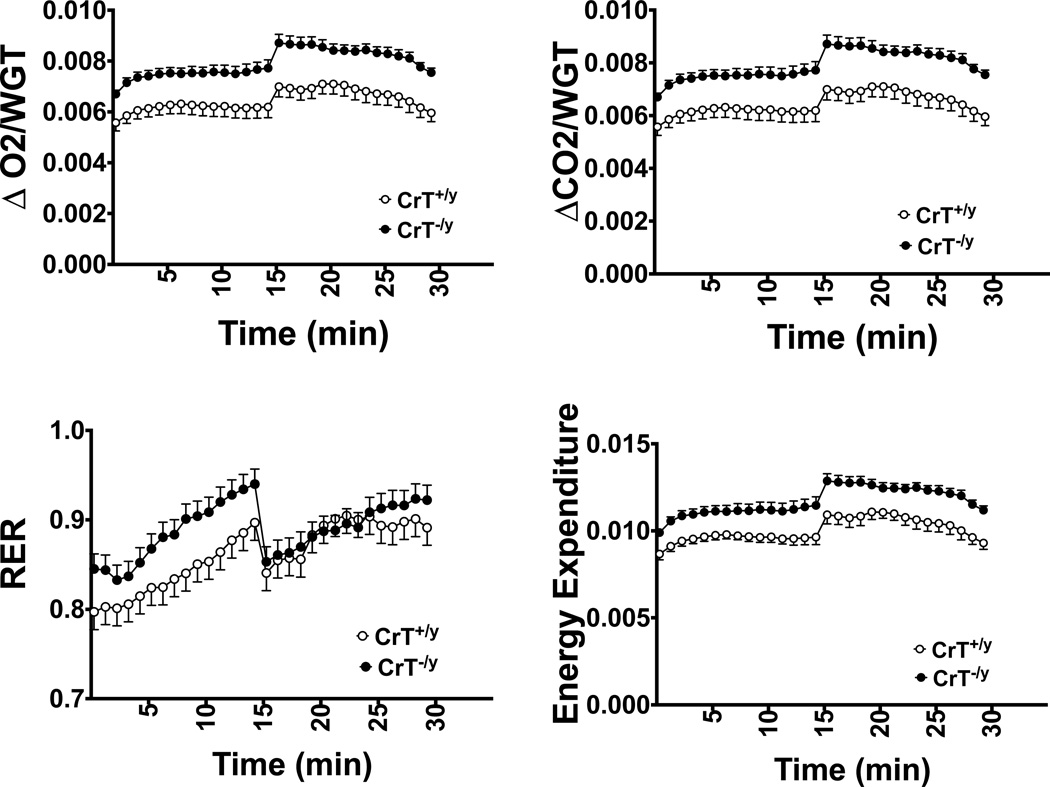
During treadmill running, Crt−/y mice consumed more oxygen (F(1,10)=7.74, p<0.05), produced more CO2 (F(1,10)=8.79, p<0.05) and utilized more energy (F(1,10)=8.16, p<0.05) compared with Crt+/y mice (Figure 4). There were no differences in RER.
Figure 4.
Crt−/y mice show increased calorie use, oxygen consumption and carbon dioxide release compared with Crt+/y mice when exercising on a treadmill. As time progressed, speed was increased. The increase in gas exchange observed at ~15 min likely reflects a switch to alternate fuel sources. *p<0.05 n=4–6 per group. Values are mean +/− SEM.
Mitochondrial function
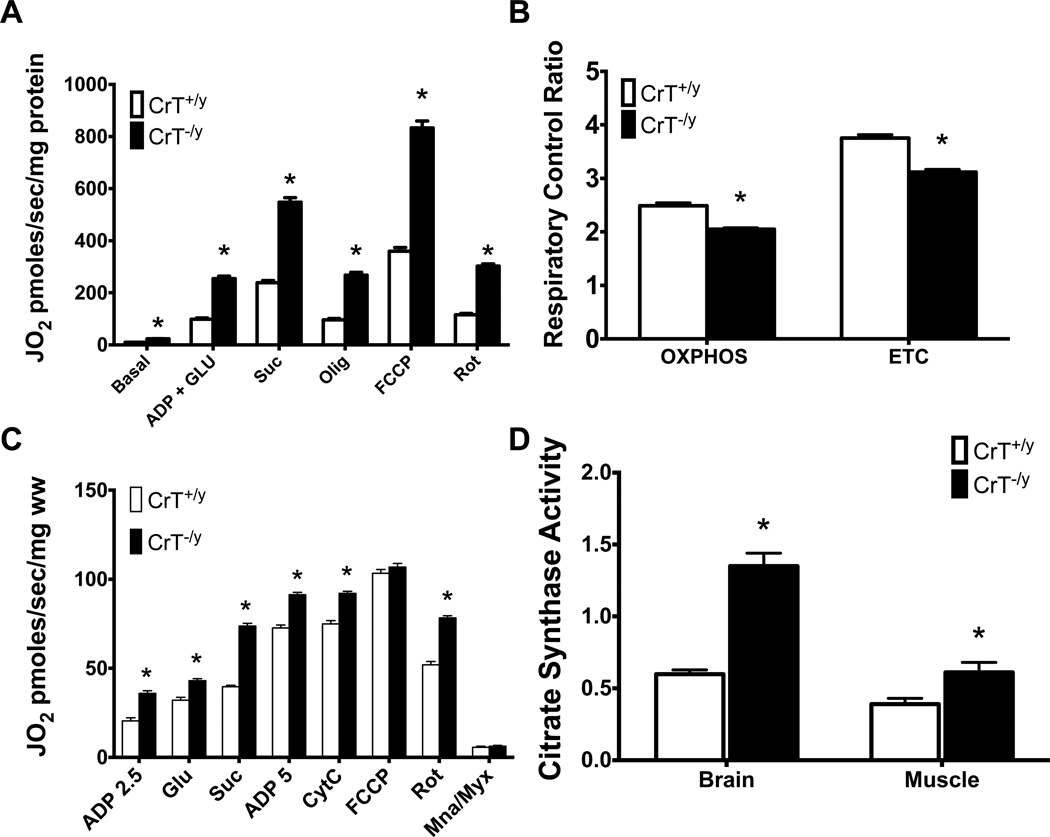
Increased mitochondrial respiration was observed in the hippocampus of Crt−/y mice compared with Crt+/y (main effect of gene: F(1,11)=290.4; p<0.001; Figure 5A). A gene by substrate interaction was also observed (F(5,55)=1601, p<0.001). Increased respiration in response to stimulation of OXPHOS CI, OXPHOS CI+CII, LEAK CI+CII, ETC CI+CII, and ETC CII were observed in Crt−/y mice compared with controls (p<0.001 for all measures). Respiratory control ratios for OXPHOS and the ETC were calculated based on this data with Crt−/y mice showing decreases in both measures (p<0.001 for each measure; Figure 5B).
Figure 5.
Crt−/y mice show increased mitochondrial respiration (A) and respiratory control ratio (B) in hippocampal lysates. (C) Stimulated respiration was increased in permeabilized muscle fibers from Crt−/y mice. (D) Increased citrate synthase activity in samples tested for respirometry is observed in Crt−/y mice. *p<0.05 n=6 per group. Values are mean +/− SEM.
Similar to the hippocampus, an overall increase in respiration was observed in the muscle of Crt−/y mice (F(1,32)=394.9; p<0.001; Figure 5C). Increased oxygen consumption was observed following administration of all compounds except FCCP (p<0.01 for all measures).
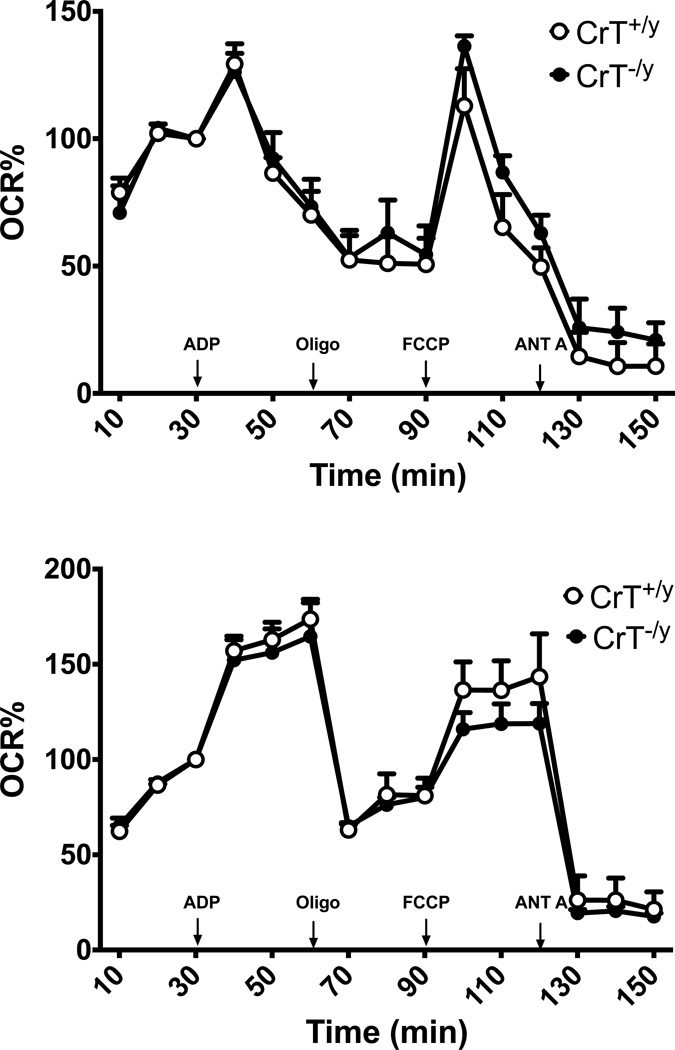
Citrate synthase activity was increased in all tissue regions examined (p<0.05; Figure 5D). The increase in CS activity is indicative of increased mitochondria. To determine if the changes observed were due to increases in mitochondrial number, equal amounts of mitochondria from the hippocampus of Crt+/y and Crt−/y mice were analyzed using the Seahorse XF24e. In order to elucidate possible mechanisms, a subset of mitochondria was given malate and pyruvate as substrates while a second subset were provided with rotenone and succinate to assess complex I function. Oxygen consumption was evaluated following serial administration of ADP, oligomycin, FCCP and antimycin A. No changes in oxygen consumption were observed between genotypes (Figure 6).
Figure 6.
Isolated mitochondria from the hippocampus of Cr+/y and Crt−/y mice show similar oxygen consumption when equal numbers of mitochondria are examined. (A) Oxygen consumption was examined in isolated mitochondria the presence of malate and pyruvate. No differences were observed between groups. (B) Complex II activity was assessed by incubating mitochondria with rotenone and succinate prior to respirometry. Values are mean +/− SEM, n=4 with each sample run in duplicate.
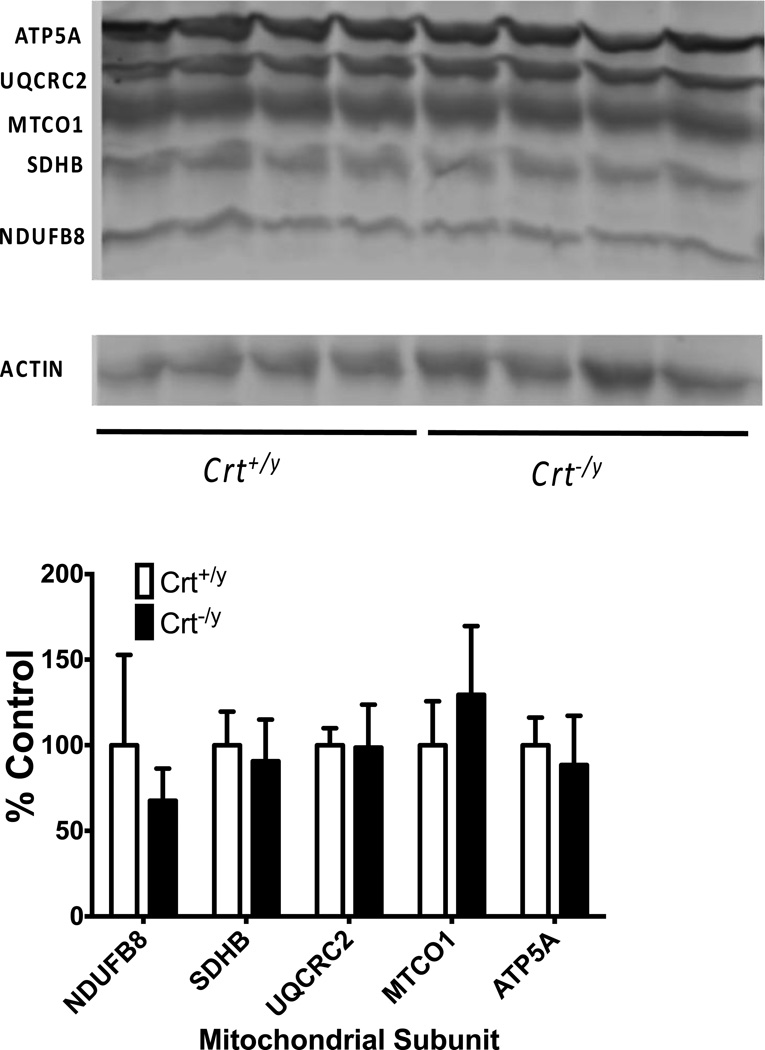
No differences were observed in relative levels of representative Complex I–Complex V proteins when examined by Western blotting (Figure 7).
Figure 7.
In isolated mitochondria from the hippocampus, no differences were observed in ETC CI through CV protein levels. Data were normalized to β-Actin and expressed as a % of Crt+/y control. *p<0.05 n=4 per group
Discussion
It has been proposed that the Cr:P-Cr shuttle is the primary mechanism in which mitochondria-derived ATP is transported and utilized at cellular sites of high-energy demand (Wallimann et al. 2011). Additionally, it is thought that Cr is important for compartmentalizing changes in ATP:ADP ratios that could lead to changes in mitochondrial output. In this study, we show that the loss of Cr in mice via deletion of the CrT leads to an overall increased mitochondrial respiration in the brain and muscle as well as reduced ATP levels. Increased CS activity suggest that the changes in mitochondrial respiration could be due to increased mitochondria in Crt−/y mice. When controlled for mitochondrial number there are no differences in oxygen consumption between Crt+/y and Crt−/y mice. There were no changes in mitochondrial subunit protein levels when adjusted for the total mitochondrial protein level, further supporting the hypothesis that Crt−/y mice have more mitochondria than Crt+/y mice. Finally, Crt−/y mice show increased whole-body respiration and calorie consumption, again suggesting an increase in metabolism to compensate for a lack of the Cr-PCr buffer. Taken together, it appears that the loss of Cr leads to an increase in metabolic function.
Crt−/y mice have reduced ATP content and increased mitochondrial respiration
To our knowledge, this is the first study that comprehensively evaluates mitochondrial respiration in the brain of Cr-deficient animals. Cr stimulates mitochondrial respiration in the presence and absence of adenosine compounds (Saks et al. 2007). The data presented here is in agreement with studies that have depleted Cr using the Crt antagonist β-guanidinopropionic acid (BPA; for meta-analysis, see Oudman et al. 2013). In this meta-analysis, chronic BPA administration reduces muscle Cr levels by 66% and ATP levels by 39%. Mitochondrial enzyme activity is elevated in the muscle, suggesting increased OXPHOS or increased mitochondrial content, consistent with our findings. In the brain, chronic GPA administration lead to a 26% reduction in Cr and a 25% reduction in ATP. An increase in mitochondrial markers were observed, again suggesting that there is an increase in mitochondria in the brain of Cr-depleted animals. The authors posited that there is a shift towards oxidative phosphorylation in GPA fed animals, our findings are consistent with this hypothesis.
Of the genetic Cr-deficient models, the CK deficient mice are the most extensively studied (Kay et al. 2000). Similar to the Crt−/y mice, mice deficient in both isoforms of CK showed non-significant reductions in stimulated respiration in cardiac fibers while showing increased respiration in muscle fibers (ter Veld et al. 2005). Mice deficient in the Cr-synthesizing enzyme arginine:gylcine amidinotransferase (AGAT−/−) show increased mitochondrial enzyme activity in the muscle. Citrate synthase activity is increased in the AGAT−/− mice as well (Nabuurs et al. 2013). The increase in mitochondrial activity and citrate synthase support the findings in this study that Cr deficiency increases the number of mitochondria. The mitochondrial increases in Cr-deficient muscle likely compensates for reduced ATP or disrupted ATP:ADP or AMP:ATP ratios in the tissue. Crt−/y mice show significant reductions in ATP both in this study and as shown previously (Russell et al. 2014). AGAT deficient mice have reduced muscular ATP (Nabuurs et al. 2013). CK knockout mice have ATP reductions during seizures and hypoxia (Kekelidze et al. 2001); paradoxically double CK knockout (CK−/−) mice do not have ATP reductions (in 't Zandt et al. 2004). The discrepancy in ATP levels between the CK−/− and Crt−/y mice could provide valuable information on the mechanisms underlying the learning deficits observed in both models (Skelton et al. 2011; Streijger et al. 2005). In addition, future studies on the maintenance of ATP levels CK-deficient mice could prove interesting.
Crt−/y mice show increased calorie consumption
Crt−/y mice have increased oxygen and CO2 consumption at rest as well as during exercise. This further supports the hypothesis that Crt−/y mice increase metabolic output in order to compensate for the loss of tissue Cr. As Crt−/y mice do not appear to be hyperactive (Skelton et al. 2011), it is unlikely that the increases in gas exchange are due to increased activity by the Crt−/y mice. Cr is important in thermoregulation (Kazak et al. 2015) and it is possible that this plays a role in the metabolic increases seen in Crt−/y mice. Future studies will be designed to investigate the ability of the Crt−/y mouse to maintain body temperature in response to cold stress. Interestingly; there were no overall changes in RER which is known to correlate to the type of fuel (carbohydrate, fat or protein) being used for energy (Simonson and DeFronzo 1990). This suggests that Crt−/y mice do not differentially switch to alternate fuel sources when subjected to exercise.
Crt−/y mice have reduced stature and increased body fat
Crt−/y mice show reductions in body weight, similar to our previous study (Skelton et al. 2011). Crt−/y mice have increased body fat when compared with Cr+/y mice, suggesting that the weight differences seen are likely due to a loss in muscle mass. The reduction in lean body mass could be considered at odds with human data showing normal levels of Cr in the muscle of 2 CTD patients (Pyne-Geithman et al. 2004; deGrauw et al. 2003). There are now over 150 CTD patients; however there have been no new reports on muscle Cr levels using either MRS or biochemical methods. Hypotonia is the second most common co-morbidity in CTD patients (Dunbar et al. 2014), suggesting that muscle is sensitive to the loss of Cr. A more comprehensive examination of muscle Cr levels in CTD patients is required prior to dismissing the muscle phenotype of Crt−/y mice as inconsistent with the human data.
In conclusion, CrT deficiency results in increased energy expenditure likely to compensate for reductions in ATP. The increased energy expenditure accompanies an increase in mitochondria in the muscle and brain of Crt−/y mice. The mechanism that underlies these changes in currently unknown. Cr and CrT expression have been linked to several the metabolic signaling molecules such as mTOR (Shojaiefard et al. 2006), PI3 kinase/AKT (Cunha et al. 2015), and AMP activated kinase (Nabuurs et al. 2013). Thus, studies to investigate the role of these kinases and signaling pathways in the CrT mediated changes in both mitochondrial function and the overall phenotype of these mice should be considered in future studies.
Acknowledgments
This work was supported by National Institutes of Health grants HD080910 (MRS), TR000077 (MRS), and ES07051 (KNM).
Footnotes
Ethical Statement: All procedures involving animals have been approved by the Cincinnati Children’s Research Foundation Institutional Animal Care and Use Committee (CCRF IACUC), which is fully accredited by the International Association for Assessment and Accreditation of Laboratory Animal Care.
Conflict of Interest: The authors declare no conflict of interest.
Authorship: MRS, JFK, ZK conceived of and designed the study. MKP, ANK, KNM, KCU, and GJPG performed the experiments and analyzed the data. MKP and MRS wrote the paper.
References
- Alcaide P, Merinero B, Ruiz-Sala P, Richard E, Navarrete R, Arias A, Ribes A, Artuch R, Campistol J, Ugarte M, Rodriguez-Pombo P. Defining the pathogenicity of creatine deficiency syndrome. Human mutation. 2011;32(3):282–291. doi: 10.1002/humu.21421. [DOI] [PubMed] [Google Scholar]
- Braissant O, Henry H, Beard E, Uldry J. Creatine deficiency syndromes and the importance of creatine synthesis in the brain. Amino Acids. 2011 doi: 10.1007/s00726-011-0852-z. [DOI] [PubMed] [Google Scholar]
- Clark AJ, Rosenberg EH, Almeida LS, Wood TC, Jakobs C, Stevenson RE, Schwartz CE, Salomons GS. X-linked creatine transporter (SLC6A8) mutations in about 1% of males with mental retardation of unknown etiology. Hum Genet. 2006;119(6):604–610. doi: 10.1007/s00439-006-0162-9. [DOI] [PubMed] [Google Scholar]
- Cunha MP, Budni J, Ludka FK, Pazini FL, Rosa JM, Oliveira A, Lopes MW, Tasca CI, Leal RB, Rodrigues AL. Involvement of PI3K/Akt Signaling Pathway and Its Downstream Intracellular Targets in the Antidepressant-Like Effect of Creatine. Mol Neurobiol. 2015 doi: 10.1007/s12035-015-9192-4. [DOI] [PubMed] [Google Scholar]
- deGrauw TJ, Cecil KM, Byars AW, Salomons GS, Ball WS, Jakobs C. The clinical syndrome of creatine transporter deficiency. Molecular and cellular biochemistry. 2003;244(1–2):45–48. [PubMed] [Google Scholar]
- DeGrauw TJ, Salomons GS, Cecil KM, Chuck G, Newmeyer A, Schapiro MB, Jakobs C. Congenital creatine transporter deficiency. Neuropediatrics. 2002;33(5):232–238. doi: 10.1055/s-2002-36743. [DOI] [PubMed] [Google Scholar]
- Dunbar M, Jaggumantri S, Sargent M, Stockler-Ipsiroglu S, van Karnebeek CD. Treatment of X-linked creatine transporter (SLC6A8) deficiency: systematic review of the literature and three new cases. Molecular genetics and metabolism. 2014;112(4):259–274. doi: 10.1016/j.ymgme.2014.05.011. [DOI] [PubMed] [Google Scholar]
- Gnaiger E, Kuznetov AV, Schneeberger S, Seiler R, Brandacher G, Steurer W, Margreiter R. Mitochondria in the Cold. In: Helmaier G, Klingenspor M, editors. Life in the Cold. New York: Springer; 2000. pp. 431–442. [Google Scholar]
- Gregor P, Nash SR, Caron MG, Seldin MF, Warren ST. Assignment of the creatine transporter gene (SLC6A8) to human chromosome Xq28 telomeric to G6PD. Genomics. 1995;25(1):332–333. doi: 10.1016/0888-7543(95)80155-f. [DOI] [PubMed] [Google Scholar]
- Horvath TL, Erion DM, Elsworth JD, Roth RH, Shulman GI, Andrews ZB. GPA protects the nigrostriatal dopamine system by enhancing mitochondrial function. Neurobiol Dis. 2011;43(1):152–162. doi: 10.1016/j.nbd.2011.03.005. [DOI] [PMC free article] [PubMed] [Google Scholar]
- in 't Zandt HJ, Renema WK, Streijger F, Jost C, Klomp DW, Oerlemans F, Van der Zee CE, Wieringa B, Heerschap A. Cerebral creatine kinase deficiency influences metabolite levels and morphology in the mouse brain: a quantitative in vivo 1H and 31P magnetic resonance study. J Neurochem. 2004;90(6):1321–1330. doi: 10.1111/j.1471-4159.2004.02599.x. [DOI] [PubMed] [Google Scholar]
- Karlsson M, Hempel C, Sjovall F, Hansson MJ, Kurtzhals JA, Elmer E. Brain mitochondrial function in a murine model of cerebral malaria and the therapeutic effects of rhEPO. Int J Biochem Cell Biol. 2013;45(1):151–155. doi: 10.1016/j.biocel.2012.08.008. [DOI] [PubMed] [Google Scholar]
- Kay L, Nicolay K, Wieringa B, Saks V, Wallimann T. Direct evidence for the control of mitochondrial respiration by mitochondrial creatine kinase in oxidative muscle cells in situ. J Biol Chem. 2000;275(10):6937–6944. doi: 10.1074/jbc.275.10.6937. [DOI] [PubMed] [Google Scholar]
- Kazak L, Chouchani ET, Jedrychowski MP, Erickson BK, Shinoda K, Cohen P, Vetrivelan R, Lu GZ, Laznik-Bogoslavski D, Hasenfuss SC, Kajimura S, Gygi SP, Spiegelman BM. A Creatine-Driven Substrate Cycle Enhances Energy Expenditure and Thermogenesis in Beige Fat. Cell. 2015;163(3):643–655. doi: 10.1016/j.cell.2015.09.035. [DOI] [PMC free article] [PubMed] [Google Scholar]
- Kekelidze T, Khait I, Togliatti A, Benzecry JM, Wieringa B, Holtzman D. Altered brain phosphocreatine and ATP regulation when mitochondrial creatine kinase is absent. J Neurosci Res. 2001;66(5):866–872. doi: 10.1002/jnr.10060. [DOI] [PubMed] [Google Scholar]
- Kuiper JW, Oerlemans FT, Fransen JA, Wieringa B. Creatine kinase B deficient neurons exhibit an increased fraction of motile mitochondria. BMC Neurosci. 2008;9:73. doi: 10.1186/1471-2202-9-73. [DOI] [PMC free article] [PubMed] [Google Scholar]
- Morris AA, Appleton RE, Power B, Isherwood DM, Abernethy LJ, Taylor RW, Turnbull DM, Verhoeven NM, Salomons GS, Jakobs C. Guanidinoacetate methyltransferase deficiency masquerading as a mitochondrial encephalopathy. J Inherit Metab Dis. 2007;30(1):100. doi: 10.1007/s10545-006-0478-2. [DOI] [PubMed] [Google Scholar]
- Nabuurs CI, Choe CU, Veltien A, Kan HE, van Loon LJ, Rodenburg RJ, Matschke J, Wieringa B, Kemp GJ, Isbrandt D, Heerschap A. Disturbed energy metabolism and muscular dystrophy caused by pure creatine deficiency are reversible by creatine intake. The Journal of physiology. 2013;591(Pt 2):571–592. doi: 10.1113/jphysiol.2012.241760. [DOI] [PMC free article] [PubMed] [Google Scholar]
- O'Gorman E, Beutner G, Wallimann T, Brdiczka D. Differential effects of creatine depletion on the regulation of enzyme activities and on creatine-stimulated mitochondrial respiration in skeletal muscle, heart, and brain. Biochim Biophys Acta. 1996;1276(2):161–170. doi: 10.1016/0005-2728(96)00074-6. [DOI] [PubMed] [Google Scholar]
- Oudman I, Clark JF, Brewster LM. The effect of the creatine analogue beta-guanidinopropionic acid on energy metabolism: a systematic review. PLoS One. 2013;8(1):e52879. doi: 10.1371/journal.pone.0052879. [DOI] [PMC free article] [PubMed] [Google Scholar]
- Powers C, Huang Y, Strauss A, Khuchua Z. Diminished Exercise Capacity and Mitochondrial bc1 Complex Deficiency in Tafazzin-Knockdown Mice. Front Physiol. 2013;4:74. doi: 10.3389/fphys.2013.00074. [DOI] [PMC free article] [PubMed] [Google Scholar]
- Pyne-Geithman GJ, DeGrauw TJ, Cecil KM, Chuck G, Lyons MA, Ishida Y, Clark JF. Presence of normal creatine in the muscle of a patient with a mutation in the creatine transporter: a case study. Mol Cell Biochem. 2004;262(1–2):35–39. doi: 10.1023/b:mcbi.0000038213.15646.4a. [DOI] [PubMed] [Google Scholar]
- Rosenberg EH, Almeida LS, Kleefstra T, deGrauw RS, Yntema HG, Bahi N, Moraine C, Ropers HH, Fryns JP, DeGrauw TJ, Jakobs C, Salomons GS. High prevalence of SLC6A8 deficiency in X-linked mental retardation. Am J Hum Genet. 2004;75(1):97–105. doi: 10.1086/422102. [DOI] [PMC free article] [PubMed] [Google Scholar]
- Russell AP, Ghobrial L, Wright CR, Lamon S, Brown EL, Kon M, Skelton MR, Snow RJ. Creatine transporter (SLC6A8) knockout mice display an increased capacity for in vitro creatine biosynthesis in skeletal muscle. Front Physiol. 2014;5:314. doi: 10.3389/fphys.2014.00314. [DOI] [PMC free article] [PubMed] [Google Scholar]
- Saks V, Kaambre T, Guzun R, Anmann T, Sikk P, Schlattner U, Wallimann T, Aliev M, Vendelin M. The creatine kinase phosphotransfer network: thermodynamic and kinetic considerations, the impact of the mitochondrial outer membrane and modelling approaches. Subcell Biochem. 2007;46:27–65. doi: 10.1007/978-1-4020-6486-9_3. [DOI] [PubMed] [Google Scholar]
- Schmidt A, Marescau B, Boehm EA, Renema WK, Peco R, Das A, Steinfeld R, Chan S, Wallis J, Davidoff M, Ullrich K, Waldschutz R, Heerschap A, De Deyn PP, Neubauer S, Isbrandt D. Severely altered guanidino compound levels, disturbed body weight homeostasis and impaired fertility in a mouse model of guanidinoacetate N-methyltransferase (GAMT) deficiency. Human molecular genetics. 2004;13(9):905–921. doi: 10.1093/hmg/ddh112. [DOI] [PubMed] [Google Scholar]
- Schulze A. Creatine deficiency syndromes. Mol Cell Biochem. 2003;244(1–2):143–150. [PubMed] [Google Scholar]
- Shojaiefard M, Christie DL, Lang F. Stimulation of the creatine transporter SLC6A8 by the protein kinase mTOR. Biochemical and biophysical research communications. 2006;341(4):945–949. doi: 10.1016/j.bbrc.2006.01.055. [DOI] [PubMed] [Google Scholar]
- Simonson DC, DeFronzo RA. Indirect calorimetry: methodological and interpretative problems. Am J Physiol. 1990;258(3 Pt 1):E399–E412. doi: 10.1152/ajpendo.1990.258.3.E399. [DOI] [PubMed] [Google Scholar]
- Skelton MR, Schaefer TL, Graham DL, Degrauw TJ, Clark JF, Williams MT, Vorhees CV. Creatine transporter (CrT; Slc6a8) knockout mice as a model of human CrT deficiency. PLoS One. 2011;6(1):e16187. doi: 10.1371/journal.pone.0016187. [DOI] [PMC free article] [PubMed] [Google Scholar]
- Stockler S, Schutz PW, Salomons GS. Cerebral creatine deficiency syndromes: clinical aspects, treatment and pathophysiology. Subcell Biochem. 2007;46:149–166. doi: 10.1007/978-1-4020-6486-9_8. [DOI] [PubMed] [Google Scholar]
- Streijger F, Oerlemans F, Ellenbroek BA, Jost CR, Wieringa B, Van der Zee CE. Structural and behavioural consequences of double deficiency for creatine kinases BCK and UbCKmit. Behav Brain Res. 2005;157(2):219–234. doi: 10.1016/j.bbr.2004.07.002. [DOI] [PubMed] [Google Scholar]
- ter Veld F, Jeneson JA, Nicolay K. Mitochondrial affinity for ADP is twofold lower in creatine kinase knock-out muscles. Possible role in rescuing cellular energy homeostasis. FEBS J. 2005;272(4):956–965. doi: 10.1111/j.1742-4658.2004.04529.x. [DOI] [PubMed] [Google Scholar]
- van de Kamp JM, Pouwels PJ, Aarsen FK, ten Hoopen LW, Knol DL, de Klerk JB, de Coo IF, Huijmans JG, Jakobs C, van der Knaap MS, Salomons GS, Mancini GM. Long-term follow-up and treatment in nine boys with X-linked creatine transporter defect. J Inherit Metab Dis. 2012;35(1):141–149. doi: 10.1007/s10545-011-9345-1. [DOI] [PMC free article] [PubMed] [Google Scholar]
- Wallimann T, Tokarska-Schlattner M, Schlattner U. The creatine kinase system and pleiotropic effects of creatine. Amino Acids. 2011;40(5):1271–1296. doi: 10.1007/s00726-011-0877-3. [DOI] [PMC free article] [PubMed] [Google Scholar]


