

Summary
Sarcopenia, the loss of skeletal muscle mass and function with advancing age, is a significant cause of disability and loss of independence in the elderly, and, thus, represents a formidable challenge for the aging population. Nevertheless, the molecular mechanism(s) underlying sarcopenia-associated muscle dysfunction remain poorly understood. In this study, we employed an integrated approach combining top-down targeted proteomics with mechanical measurements to dissect the molecular mechanism(s) in age-related muscle dysfunction. Top-down targeted proteomic analysis uncovered a progressive age-related decline in the phosphorylation of myosin regulatory light chain (RLC), a critical protein involved in the modulation of muscle contractility, in the skeletal muscle of aging rats. Top-down tandem mass spectrometry analysis identified a previously un-reported bis-phosphorylated proteoform of fast skeletal RLC and localized the sites of decreasing phosphorylation to Ser14/15. Of these sites, Ser14 phosphorylation represents a previously unidentified site of phosphorylation in RLC from fast-twitch skeletal muscle. Subsequent mechanical analysis of single fast-twitch fibers isolated from the muscles of rats of different ages revealed that the observed decline in RLC phosphorylation can account for age-related decreases in the contractile properties of sarcopenic fast-twitch muscles. These results strongly support a role for decreasing RLC phosphorylation in sarcopenia-associated muscle dysfunction, and suggest therapeutic modulation of RLC phosphorylation may represent a new avenue for the treatment of sarcopenia.
Keywords: Aging, Sarcopenia, Targeted Proteomics, Top-down Mass Spectrometry, Myofilament
Introduction
The worldwide increase in life expectancy has brought with it a rise in the prevalence of age-related diseases and morbid disorders in the elderly population1. Among age-related conditions, sarcopenia, which is the loss of skeletal muscle mass and contractile function with increasing age2–4, represents a formidable challenge for the aging population. Sarcopenia is associated with disability, reduced quality of life, and loss of independence in the elderly5 and places significant demand on public health care and imposes substantial economic costs6. Nevertheless, the molecular mechanism(s) underlying the age-related deterioration of skeletal muscle contractile function remain incompletely understood2,4. Hence, there is an urgent need for innovative approaches enabling identification of the molecular determinants of age-related muscle dysfunction to aid the development of therapeutic strategies to attenuate or prevent sarcopenia in aging individuals.
The hallmarks of sarcopenia include progressive muscle atrophy, particularly of type II (fast-twitch) skeletal muscles, which are more susceptible to age-related atrophy than type I (slow-twitch) muscles7,8, as well as contractile dysfunction that is, in part, due to alterations in the structure and function of myofilaments9. Myofilaments are composed of interdigitating thick and thin filaments that constitute the contractile apparatuses and, thus, are responsible for force production during muscle contraction10,11. Myosin, the principal component of the thick filament, is a hexamer consisting of two heavy chains, two regulatory light chains (RLC), and two essential light chains10,12. The dumbbell-shaped RLC stabilizes the myosin lever-arm, and plays a significant role in modulating the contractile function of skeletal muscle13–19. In particular, phosphorylation of RLC by Ca2+/calmodulin-dependent myosin light chain kinase (MLCK) is known to potentiate both maximal force and the rate of force generation by actin-myosin cross-bridges, as well as increase the Ca2+-sensitivity of the contractile apparatus13–19. Therefore, given that previous studies have shown that sarcopenia-associated muscle dysfunction is associated with decreased force production20,21, maximal shortening velocity22–24, and Ca2+-sensitivity of force25, we hypothesized that there are age-related changes in RLC phosphorylation that contribute to sarcopenic muscle dysfunction.
Top-down mass spectrometry (MS)-based proteomics has quickly become the method of choice for the in-depth characterization of proteoforms [a term encompassing the myriad protein species arising from a single gene as a consequence of sequence variations and post-translational modifications (PTMs)]26. Unlike the conventional bottom-up approach, which is sub-optimal for comprehensive proteoform analysis due to protein digestion, the top-down approach analyzes whole proteins, thereby providing a “bird’s eye view” of the full complement of protein proteoforms with full sequence coverage27–29. Following intact protein analysis, specific proteoforms of interest can be isolated and fragmented by a variety of tandem MS (MS/MS) techniques to localize PTMs and sequence variations. Although recent studies have showcased the power of large-scale top-down proteomics in discovery mode30,31, this approach comes at the cost of reduced sensitivity and stochastic sampling32. Recently, a hypothesis-driven targeted proteomics approach, which can detect and reliably quantify specific proteoforms of interest with exceptional sensitivity and reproducibility, has gained popularity33–40. We and others have shown that top-down targeted proteomics offers unparalleled opportunities for the characterization and quantification of proteoforms towards elucidation of the underlying molecular mechanism(s) in cardiovascular and infectious diseases, among others41–46.
In this study, we utilized top-down targeted proteomics to assess age-related changes in RLC proteoforms in the fast-twitch skeletal muscle of rats. Our analysis uncovered a significant progressive decline in RLC phosphorylation with increasing age. Top-down MS/MS analysis identified a previously un-reported bis-phosphorylated proteoform of fast skeletal RLC and localized the sites of decreasing phosphorylation to Ser14/15. Of these sites, Ser14 phosphorylation has not previously been identified. Subsequent mechanical analysis of single skinned fast-twitch muscle fibers from rats of different ages revealed that the age-related decrease in RLC phosphorylation is responsible for altered mechanical function, including significant decreases in maximal force, the Ca2+-sensitivity of force, loaded shortening velocity, and power output, in aged muscle fibers. To our knowledge, this is the first report linking a progressive decline in RLC phosphorylation to specific contractile defects in sarcopenic fast-twitch muscle fibers. Furthermore, these results suggest that therapeutic targeting of RLC phosphorylation may represent a new avenue for the treatment of sarcopenic muscle dysfunction in elderly individuals.
Experimental Procedures
Animals
Male Fisher 344 x Brown Norway F1 hybrid rats (F344BN) aged 6- (n=12), 24- (n = 12), and 36-months (n=12) were obtained from the National Institute on Aging (NIA) colony maintained by Harlan Sprague-Dawley (Indianapolis, IN, USA). Rats were individually housed in clear plastic cages on a 12h/12h light/dark cycle with access to food and water ad libitum. Handling and euthanasia were carried out under the guidelines of University of Wisconsin-Madison Animal Use and Care Committee. Rats were anesthetized by inhalation of isoflurane, and the gastrocnemius muscles were quickly excised and weighed. The gastrocnemius muscle from one leg from each rat was bisected. One-half of each muscle was prepared for histological analysis as described below, while the other half was flash frozen in liquid N2 and stored at −80°C for subsequent top-down targeted proteomic analysis. The gastrocnemius muscle from the other leg was dissected in relaxing solution to prepare single fibers.
Histology
The gastrocnemius muscle from the left hind limb was dissected from origin to insertion and immediately weighed. Muscles were bisected at the mid-belly, embedded in optimal cutting temperature compound (Tissue-Tek; Andwin Scientific, Addison, IL, USA), frozen in liquid N2, and stored at −80 °C for later sectioning. The contralateral gastrocnemius muscle was dissected and used to isolate fiber bundles for contractile measurements. Histological measurements were conducted as described previously47. Three consecutive sections (10 μm thick) were cut, starting at the mid-belly, placed on labeled ProbeOn Plus microscope slides (Fisher Scientific, Pittsburgh, PA, USA), and stored at −80 °C until use. The first section of each series was stained with hematoxylin and eosin (H&E). Sections were photographed using an Olympus BH2 microscope with an Olympus DP70 digital camera and mid-belly composites of each muscle section were reconstructed by interlacing the images using ImagePro Plus software (Media Cybernetics, Atlanta, GA, USA). For fiber counts, individual muscle fibers were annotated on the composite image of the entire muscle cross-section at the mid-belly, using Adobe Photoshop (Adobe Systems, Inc., San Jose, CA, USA), and total count was tabulated. The whole muscle cross-sectional area (CSA) at the mid-belly was measured by tracing an outline of each muscle using ImagePro Plus. To measure individual muscle fiber CSA, four images (10×) from the H&E sections were captured from gastrocnemius muscles at each age group. A grid with 25 random dots was placed over the images, and the CSA of fibers marked with the dots was measured. Six hundred fibers were measured from each muscle at each age group ([4 images per muscle] × [25 fibers per image] × [6 animals per age group] = 600 fibers). The second tissue section from each series was stained using Masson’s trichrome method48 to distinguish muscle tissue from collagen. Briefly, the tissue was incubated with Bouin’s fixative for 1 hour at 56 °C, stained with Weigert’s iron hematoxylin (for 10 minutes) and Biebrich scarlet-acid fuchsin (for 15 minutes), and incubated with phosphomolybdic-phosphotungstic acid (for 15 minutes) and aniline blue (for 20 minutes). Tissue sections were rinsed in double distilled H2O after each step. With this method, muscle fibers stain red and collagen stains blue.
Protein Extraction
Extraction of the myofilament sub-proteome from the gastrocnemius muscles of rats from different age groups was carried out as previously described44. Briefly, approximately 10 mg of skeletal muscle tissue was homogenized in 100 μL of HEPES extraction buffer containing protease and phosphatase inhibitors (25 mM HEPES pH 7.5, 50 mM NaF, 0.25 mM Na3VO4, 0.25 mM PMSF, 2.5 mM EDTA) using a Teflon pestle (1.5 mL tube rounded tip; Scienceware, Pequannock, NJ, USA). The resulting homogenate was centrifuged at 16,000 g for 15 minutes at 4 °C, and the supernatant was discarded. The insoluble pellet was then re-homogenized in 100 μL of TFA extraction buffer (1% TFA, 1 mM TCEP) to extract the myofilament proteins. After centrifugation (16,000 g, 4 °C, 25 min), the supernatant was collected and used for MS and MS/MS analyses.
On-line Liquid Chromatography (LC)-MS
Myofilament extracts were separated using a Dionex U3000 LC system (Thermo Scientific, Bremen, Germany) equipped with a home-packed PLRP column (PLRP-S, 200 mm × 500 μm, 10 μm, 1000 Å; Varian, Lake Forest, CA, USA) and a gradient going from 20% B to 90% B (solvent A: 0.10% formic acid in water; solvent B: 0.10% formic acid in a 50:50 mixture of acetonitrile and ethanol) over 40 min at a flow rate of 12.5 μL/min. The Dionex U3000 LC system was coupled on-line with an Orbitrap Fusion Lumos Tribrid mass spectrometer (Thermo Scientific). Samples were introduced into the mass spectrometer using a spray voltage of 3.5 kV. The mass spectrometer was operated in intact protein mode with a resolution setting of 240,000 (at 200 m/z) and an automatic gain control target value of 200,000.
Fraction Collection
LC-based separation of the myofilament sub-proteome and fraction collection of RLC was carried out as previously described44, with minor modifications. Briefly, myofilament extracts prepared from skeletal muscle tissue were separated using a 2D-nano-LC system (Eksigent, Redwood City, CA, USA) equipped with a home-packed PLRP column and a gradient going from 20% B to 90% B over 40 min (solvent A: 0.10% formic acid in water; solvent B: 0.10% formic acid in a 50:50 mixture of acetonitrile and ethanol) at a flow rate of 12.5 μL/min. The 2D-nano-LC system was coupled on-line with a linear ion trap (LTQ) mass spectrometer (Thermo Scientific). After LC separation, a small portion of the sample (~5% of the total amount) was ionized by electrospray ionization through a 25–30 μm i.d. tip and analyzed by LTQ/MS to track protein elution from the column. The remaining ~95% of the sample was collected on ice for off-line MS/MS analysis.
High-Resolution MS/MS
The collected fractions were analyzed using a 7T linear ion trap/ Fourier transform ion cyclotron resonance (FT-ICR) mass spectrometer (LTQ/FT Ultra, Thermo Scientific) equipped with an automated chip-based nano ESI source (Triversa NanoMate; Advion Bioscience, Ithaca, NY, USA) as described previously42–44,49. The sample was introduced into the mass spectrometer using a spray voltage of 1.3 kV. Ion transmission into the linear trap and, subsequently, the FT-ICR cell, was optimized to achieve maximum ion signal. The resolving power of the FT-ICR was set at 200,000 (at 400 m/z). The number of accumulated charges for a full scan in the linear trap, FT-ICR cell, MSn FT-ICR cell, and electron capture dissociation (ECD) were 3×10⁴, 8×10⁶, 8×10⁶ and 8×10⁶, respectively. For MS/MS experiments, the protein molecular ions of the individual charge states were first isolated and then fragmented using ECD. The energy, delay, and duration parameters for ECD were determined on a case-by-case basis to achieve optimal fragmentation of precursor ions. Typically between 4,000–10,000 scans were averaged for ECD experiments to ensure the collection of high quality tandem mass spectra for data analysis.
MS and MS/MS Data Analysis
All mass and tandem mass spectra were analyzed with in-house developed MASH Suite Pro software50, which is an integrated software with MS-Align+51, using a signal-to-noise ratio threshold of 2.5 and a minimum fit of 60%. A 10 ppm cut-off was used for fragment ion assignments and all program-processed data was manually validated. Monoisotopic masses are reported for both intact proteins and fragment ions. At least two technical replicates were performed per biological replicate. Quantification of proteoform relative abundances based on the high-resolution MS data was carried out as described previously42–44. Briefly, the peak heights of the top five isotopomers from the isotopic envelopes corresponding to each RLC proteoform were summed to give the MS signal intensities of each individual RLC proteoform. Subsequently, the total RLC population intensity was determined by adding all of the individual proteoform signal intensities together, and the relative abundances of the un-phosphorylated, mono-phosphorylated, and bis-phosphorylated proteoforms of RLC were calculated by summing the intensities of all proteoforms, including oxidized and adducted proteoforms, related to the un-, mono-, and bis-phosphorylated species, and dividing by the total RLC population intensity. To assess protein phosphorylation levels, the percentages of the mono- (%Pmono) and/or bis- (%Pbis) phosphorylated protein species were defined as the summed abundances of mono- and/or bis-phosphorylated species over the summed abundances of the entire protein population, respectively. Based on these percentages, the total amount of phosphorylation (Ptotal) of a single protein was calculated using the following equation:
| (Eq. 1) |
Apparatus for Mechanical Measurements
Bundles of ~50 fibers were dissected from the gastrocnemius muscle of rats and tied to glass capillary tubes and stored at −22°C for up to 4 weeks in relaxing solution containing 50% (v/v) glycerol. For each experiment an individual fiber was pulled from the end of the bundle, a control segment was saved for later protein analysis and an experimental segment 1.5–2.5 mm in length was attached to the experimental apparatus. The experimental technique for performing contractile measurements on skinned skeletal muscle fibers has been described previously52. Briefly, the fiber segments were attached between a capacitance-gauge transducer (Model 403, sensitivity of 20 mV/mg and resonant frequency 600 Hz; Aurora Scientific, Ontario, Canada) and a DC torque motor (Model 308; Aurora Scientific, Ontario, Canada). Fibers were attached by placing the ends of the preparation into stainless steel troughs and secured by overlaying a 0.5 mm length of 4–0 monofilament nylon suture on each end, and then tying the suture into the troughs with two loops of 10–0 monofilament suture. This preparation yields very low end compliance and highly uniform striation patterns during Ca2+ activations. The length of the preparation was adjusted so that sarcomere length was set to 2.5 μm in relaxing solution and sarcomere length was monitored in pCa 4.5 to determine that sarcomere length did not change significantly during activation. Length changes during contractile measurements were introduced at one end of the preparation driven by voltage commands from a PC via a 16 bit D/A converter. Force and length signals were digitized at 1 kHz using a 16-bit A/D converter and each displayed and stored on a PC using custom software in LabView for Windows (National Instruments Corp., Austin, TX, USA). The experimental chamber contained three troughs into which the myocyte was moved to effect rapid solution changes. The apparatus was cooled to 15°C using peltier devices (Cambion, Cambridge, MA, USA) and a circulating water bath. The entire mechanical apparatus was mounted on a pneumatic vibration isolation table having a cut-off frequency of ~1 Hz.
Solutions for Mechanical Measurements
Relaxing and activating solutions for skinned fiber preparations have been described previously52 and contain: 7 mM EGTA, 1 mM free Mg2+, 20 mM imidazole, 4 mM ATP, 14.5 mM creatine phosphate, pH 7.0 (at 15°C), various free Ca2+ concentrations between 10−9 M (relaxing solution) and 10−4.5 M (maximally activating solution), and sufficient KCl to adjust ionic strength to 180 mM. The final concentrations of each metal, ligand, and metal-ligand complex were determined from the computer program of Fabiato53.
Force-pCa Measurement
Force (tension) was measured as a function of pCa (−log[Ca2+]) in the range of 9.0 to 4.5. All experiments were carried out at 15°C. Force was first measured in pCa 4.5, and then in randomly selected submaximal pCa solutions, with every fourth activation made in pCa 4.5 to assess any decline in fiber performance. If maximum force (in pCa 4.5) declined by more than 20% from the first activation to the last, the cell was discarded and data from that cell were not used). For each activation steady force was allowed to develop, after which the cell was slackened and subsequently transferred to relaxing solution. Total force was measured as the difference between steady developed force and the baseline force immediately after the slack step. Active force was calculated by subtracting resting tension at pCa 9.0 from total force. Force at each pCa was expressed as a fraction of the maximum force (relative tension; measured in solution with pCa 4.5) obtained for that cell under the same conditions. A graph of the force-pCa relationship was generated by plotting, for each pCa tested, the pooled relative force data from each of the fibers from the muscles of 6-, 24-, and 36-month-old rats. As described by Hofmann, et al.,54, data were analyzed by least-squares regression using the Hill equation:
| (Eq. 2) |
where Prel is force expressed as a fraction of maximal force, n is the Hill coefficient, and k is the intercept of the fitted line with the x axis, which corresponds to the [Ca2+] at half-maximal force (pCa50). Using constants derived from the Hill equation, force data was fit by computer with the following equation:
| (Eq. 3) |
Confirmation of the identity of fast-twitch fibers was carried following force-pCa measurements via SDS-PAGE analysis of myosin heavy chain isoform expression22. Only data from fibers that were identified as expressing predominantly type IIb myosin heavy chain were used.
Force-Velocity and Power-Force Measurements
The solutions and protocol for force-velocity and power-load measurements were similar to those described previously for experiments on cardiac myocytes55. Briefly, the shortening velocity of skinned skeletal muscle fibers was determined at varied loads. All experiments were conducted with sarcomere length set to 2.3 μm. The fibers were transferred into activating solution (pCa 4.5) and steady force was allowed to develop. The computer then switched the motor from length control mode to force control mode by applying a 5V logic pulse. The fibers were rapidly stepped to a specified force, which was maintained for 100–300 ms while changes in fiber length were monitored. Following this force clamp, the fiber was slackened to reduce the force to zero to allow measurement of the relative force during the isotonic shortening period. Several (between 8–10) different force levels were carried out on given myocytes. Force was expressed normalized to maximal force during a given activation (P/Po). Secondary to force-velocity measurements, the identity of fast-twitch fibers was confirmed by SDS-PAGE analysis of myosin heavy chain isoform expression. Only data from fibers that were identified as expressing predominantly type IIb myosin heavy chain were used. A power-load curve was constructed by multiplying, in each fiber, the velocity values times the force values for each force clamp. The resulting power output data was then summed for all trained cells and all control cells. If the maximal force declined by more than 50% during the experimental protocol that cell was discarded and the data were not used.
Statistical Analysis
Student’s t-test was performed between group comparisons to evaluate the statistical significance of variance. Differences among means were considered to be significant at p < 0.05.
Results
An integrated approach combining top-down targeted proteomics with functional measurements in sarcopenic fast-twitch skeletal muscle
Herein, we utilized an integrated approach combining the power of top-down targeted proteomics with functional assays to dissect the molecular mechanism(s) underlying sarcopenic fast-twitch muscle dysfunction (Fig. 1). The key features of this approach include (a) the use of a Fisher 344 x Brown Norway F1 hybrid (F344BN) rat model of sarcopenia. As recommended by the National Institute on Aging (NIA), F344BN rats were chosen for this study because they have a low incidence of age-related pathologies, which could confound the interpretation of age-associated changes in skeletal muscle mass and function47. Three age groups, 6- (young), 24- (middle-age) and 36-month-old (old) F344BN rats were used in this study. (b) Top-down targeted proteomic analysis enabling reliable and reproducible quantification of RLC proteoforms in the fast-twitch skeletal muscle of rats in different age groups. Here, we employed a top-down targeted liquid chromatography (LC)-MS method for the separation and quantification of fast skeletal RLC proteoforms in the muscles of rats of different ages. The entire procedure, including tissue homogenization, myofilament protein extraction, and LC-MS, can be completed in less than 3 hours. Fraction collection of fast skeletal RLC during on-line LC-MS allows for in-depth high-resolution MS/MS characterization of RLC proteoforms. Additionally, only a small amount of muscle tissue (<5 mg) is needed44. (c) Mechanical measurements using single skinned muscle fibers. We assessed maximal isometric force, Ca2+-sensitivity of force, and loaded shortening velocity in skinned single muscle fibers isolated from young, middle-age, and old rat skeletal muscles in parallel with proteomic analysis. Mechanical analyses conducted using single skinned fibers have advantages over analyses conducted in vivo, as well as those using multicellular muscle preparations. Firstly, it allows for direct analysis of contractile function at the level of actin-myosin cross-bridges and muscle regulatory proteins in vitro, without the confounding influence of endogenous Ca2+ or the nervous and endocrine systems. Secondly, the use of single fibers eliminates possible functional variations due to the presence of slow-twitch fibers, which is achieved by the selective analysis of fast-twitch muscle fibers, that are affected by sarcopenia to a greater extent that slow-twitch muscle fibers7,8. (d) Correlation of the targeted proteomic data with data from mechanical assays. To our knowledge, this represents the first study combining top-down targeted proteomics with data from mechanical assays to link age-related changes in specific proteoforms to alterations in the contractile function of muscle from individuals with sarcopenia.
Fig. 1. Integrated approach combining top-down targeted proteomics with mechanical measurements to elucidate the molecular mechanism(s) underlying age-related sarcopenia.
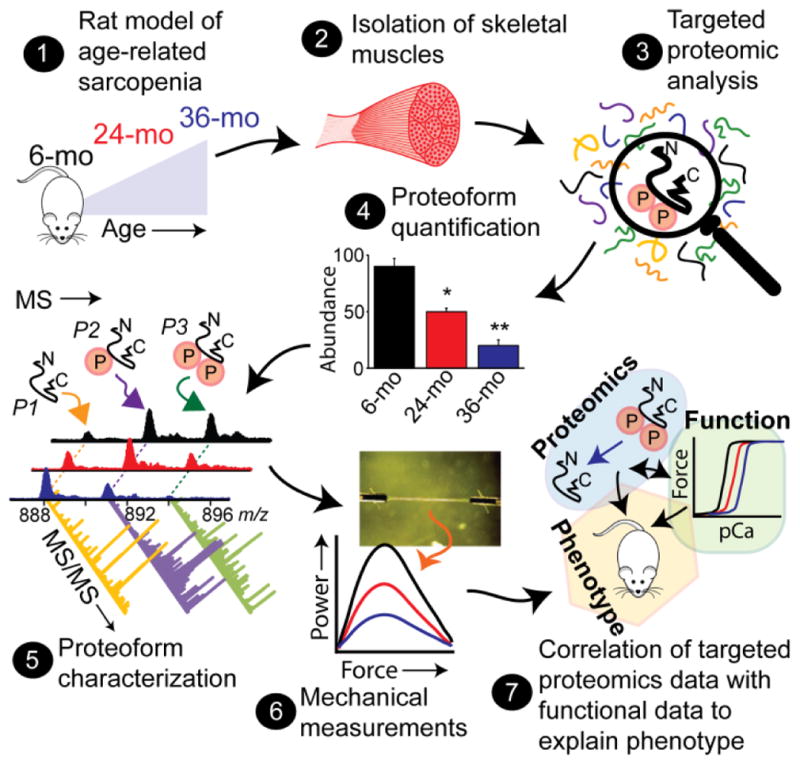
This approach includes: (1) Use of a rat model of age-related sarcopenia; (2) isolation of skeletal muscle for proteomic and mechanical analyses; (3) top-down targeted proteomics for RLC proteoform analysis; (4) MS-based proteoform quantification; (5) MS/MS analysis for the comprehensive characterization of RLC proteoform sequences and PTMs; (6) mechanical measurements on single fibers; and (7) correlation of the targeted proteomics data with functional data to explain the sarcopenic phenotype. mo, month.
Aging is associated with a substantial loss of skeletal muscle mass and a deterioration of muscle quality
Comparison of 6-, 24-, and 36-month-old rats revealed a significant decrease in body mass occurring at advanced age (36 months of age) (Fig. 2A and Table S1). To determine if the decrease in body mass was the result of sarcopenia, gastrocnemius muscles, which are primarily composed of fast-twitch muscle fibers56, were isolated from the hind limbs of rats in different age groups and compared. Assessment of gastrocnemius muscles showed that muscle mass was significantly decreased at 36 months of age (Fig. 2B and Table S1). Normalization of gastrocnemius mass to body mass confirmed the age-related decrease in skeletal muscle mass (Fig. 2C and Table S1), which is consistent with the presentation of sarcopenia in aging rats47. In addition to decreased skeletal muscle mass, whole muscle cross sections from 36-month-old rats displayed a marked decrease in cross-sectional area (Fig. 2D–G and Table S1) in comparison to those from 6-month-old rats in accordance with the presentation of sarcopenia at advanced ages47. Further examination of the isolated muscles revealed a progressive decrease in both the number of muscle fibers and fiber diameter with advancing age (Fig. 2H and I and Table S1), indicating that the observed decreases in muscle mass and area are the combined result of muscle fiber loss and a concomitant decrease in the size of the remaining fibers. Histochemical analysis of gastrocnemius muscles also showed an age-related increase in fibrosis (Fig. 2J–L), which is consistent with previous reports of decreased muscle quality in aged individuals due to the deposition of fat and other non-contractile material in the skeletal muscle2.
Fig. 2. Age-related sarcopenia is associated with loss of skeletal muscle mass and deterioration of muscle quality.

(A) Body mass is decreased in 36-month-old rats compared to 6- and 24-month-old rats. The mass of the gastrocnemius muscle (B) and the gastrocnemius muscle mass-to-body mass ratio (C) decline with increasing age. Hematoxylin and eosin stained whole muscle cross-sections from 6- (D), 24- (E), and 36-month-old rats (F). (G) Quantification of gastrocnemius muscle cross-sectional area in 6-, 24-, and 36-month-old rats. Analysis of gastrocnemius fiber number (H) and mean fiber diameter (I) in rats from different age groups. Muscle sections from 6- (J), 24- (K), and 36-month-old rats (L) stained with Masson’s trichrome stain. Red and blue indicate muscle fibers and collagen, respectively. Muscle area, muscle fiber number, and mean fiber diameter were determined from histochemical analysis of muscle sections. Scale bars are 100 μm. mo, month. n = 12 for all groups. All values represent mean ± standard error of the mean (SEM). *p < 0.05 vs. 6 mo.
Top-down targeted proteomic analysis reveals progressive loss of RLC phosphorylation in fast-twitch skeletal muscle with increasing age
To test the hypothesis that changes in RLC proteoforms occur in sarcopenic muscle, top-down targeted proteomic analysis of RLC extracted from the gastrocnemius muscles of 6-, 24-, and 36-month-old rats was carried out. Proteomic analysis showed three RLC proteoforms with relative molecular masses of 18,868.44 Da, 18,948.40 Da, and 19,028.35 Da, respectively, present in the gastrocnemius muscles of rats in different age groups (Fig. 3A). After considering removal of the N-terminal Met and Nα-tri-methylation of Ala157, the peak with the relative molecular mass of 18,868.44 Da matched well with the predicted molecular mass of un-phosphorylated RLC from rat fast-twitch skeletal muscle, based on the sequence in the UniProtKB/Swiss-Prot database (accession number P04466) (Fig. 3A). The mass difference between the peak corresponding to un-phosphorylated RLC and the peak with the relative molecular mass of 18,948.40 Da was 79.96 Da, which matched well with the addition of meta-phosphoric acid (HPO3, 79.96 Da); thus, this proteoform was assigned as mono-phosphorylated RLC (pRLC) (Fig. 3A). Similarly, the mass difference between the peak corresponding to un-phosphorylated RLC and the peak with the relative molecular mass of 19,028.35 Da was determined to be 159.91 Da, indicating that this peak likely represents a previously un-reported bis-phosphorylated proteoform of fast-twitch skeletal RLC (ppRLC) (Fig. 3A). Highly reproducible separation and MS analysis of biological replicates enabled MS-based quantification of the relative abundances of RLC proteoforms in the gastrocnemius muscles of rats in different age groups (Figs. S1 and S2). Quantitative top-down targeted proteomic analysis uncovered a significant increase in the relative abundance of the un-phosphorylated RLC proteoform, as well as a corresponding decrease in the relative abundances of the pRLC and ppRLC proteoforms, with increasing age (Fig. 3B). Consistent with this observation, total RLC phosphorylation was significantly decreased with advancing age—with reductions of approximately 18% and 26% in 24- and 36-month-old rats, respectively, compared to 6-month-old rats (Fig. 3C).
Fig. 3. A progressive decrease in the phosphorylation of fast skeletal RLC is observed with advancing age.

(A) Representative mass spectra of RLC from 6-, 24-, and 36-month-old rats. Circles represent the theoretical isotopic abundance distribution of the isotopomer peaks corresponding to the assigned mono-isotopic mass. Star represents oxidized pRLC. m/z, mass-to-charge ratio. Calc’d, calculated most abundant molecular mass based on protein sequence. Expt’l, experimentally determined molecular mass. (B) Graph showing the relative abundances of RLC, pRLC, and ppRLC proteoforms in the gastrocnemius muscle of rats from different age groups. (C) Graph showing decrease in total RLC phosphorylation (expressed as mol Pi/mol of RLC) with advancing age. n = 5 for 6- and 24-month-old groups, and n = 6 for 36-month-old group. mo, month. All values represent mean ± SEM. *p < 0.05 vs. 6 mo, **p < 0.001 vs. 6 mo.
Ser14/15 are the sites of decreasing phosphorylation in RLC from the fast-twitch skeletal muscle of aging rats
Whereas previous studies have shown that Ser19 and Ser13/14 are the sites of phosphorylation in the smooth and cardiac muscle isoforms of RLC58,59, respectively, only a single site of phosphorylation has been reported in fast skeletal RLC from mouse (Ser15)19. Therefore, following the discovery that RLC phosphorylation in skeletal muscle declines with age (Fig. 3), we next sought to confirm the identity of the quantified MS peaks as fast skeletal RLC proteoforms, and determine the sites of decreasing phosphorylation. To accomplish this, fast skeletal RLC from the gastrocnemius muscles of rats from different age groups was fraction collected and analyzed off-line by high-resolution top-down electron capture dissociation (ECD) MS/MS. After considering removal of the N-terminal Met, all c ions resulting from fragmentation of un-phosphorylated RLC showed an approximately 42.046 Da mass increase compared to the predicted masses for these ions, indicating Nα-tri-methylation (+42.046 Da) rather than Nα-acetylation (+42.010 Da), based on accurate mass measurement (Fig. S3A). These results confirm those of earlier studies showing that RLC proteoforms are tri-methylated at their N-termini57. Note that c ions include the N-terminus while z· ions contain the C-terminus (e.g., c21 and z·21 would contain residues 1–21 and 148–168 in fast skeletal RLC, respectively). Following assignment of N-terminal tri-methylation, the sequence of RLC from fast-twitch skeletal muscle was confirmed with high sequence coverage and mass accuracy (Fig. 4A and Fig. S3B). To determine the sites of phosphorylation in pRLC and ppRLC, MS peaks corresponding to these proteoforms were isolated and fragmented using ECD. Fragmentation of pRLC revealed that all c ions prior to and including c14 were detected only in their un-phosphorylated state (Fig. S4A), indicating that the phosphorylation site is located after Ser14 (numbering is based on the fast skeletal RLC sequence after considering removal of the N-terminal Met). Conversely, all c ions after and including c15 were detected only in their phosphorylated state (Fig. S4B), confirming Ser15 as a site of phosphorylation in pRLC. Nevertheless, it is possible that the MS peak corresponding to pRLC represents a mixed population of RLC ions phosphorylated at Ser15 and a different site (i.e., positional isomers)27; however, analysis of z· ions showed that all z· ions prior to z·154 were un-phosphorylated, whereas all z· ions after and including z·154 were mono-phosphorylated (Fig. S4C and D). Therefore, these results unambiguously confirm that Ser15 is the sole site of phosphorylation in pRLC isolated from the fast-twitch skeletal muscle of rats of varying ages (Fig. 4B), which is consistent with previous reports in mouse fast skeletal RLC19. Top-down MS/MS analysis of ppRLC revealed that all c ions prior to c13 were detected in their un-phosphorylated state (Fig. S4E). Conversely, all c ions after and including c15 were detected only in their bis-phosphorylated state (Fig. S4F), suggesting that Ser14, in addition to Ser15, are the sites of phosphorylation in ppRLC. Analysis of z· ions confirmed this localization (Fig. S4G and H). Thus, we can confidently assign the sites of phosphorylation in fast skeletal ppRLC to Ser14/15 (Fig. 4C), with phosphorylation at Ser14 not having previously been reported. The importance of Ser14/15 phosphorylation in the regulation of fast-twitch skeletal muscle contractility is underscored by the high conservation of these residues across species (Fig. S5). Collectively, these results indicate that aging is associated with decreased fast skeletal RLC phosphorylation at Ser14/15.
Fig. 4. Comprehensive top-down MS/MS analysis uncovers Ser14 and Ser15 as the sites of decreasing phosphorylation in RLC proteoforms from the fast-twitch skeletal muscle of aging rats.

(A) Fragmentation map for un-phosphorylated fast skeletal RLC. Fragmentation maps for pRLC (B) and ppRLC (C) proteoforms. Phosphorylation sites are highlighted by circles. (Me)3- represents Nα-tri-methylation.
The age-related progressive loss of RLC phosphorylation is associated with impaired contractile function in fast-twitch muscle fibers from aging rats
Previous studies have shown that the contractile function of skeletal muscle is impaired in aged individuals22,23,25,60. To determine whether the progressive age-related loss of fast skeletal RLC phosphorylation was associated with altered contractile function in aging rats, single fast-twitch fibers from the gastrocnemius muscles of 6-, 24-, and 36-month-old rats were isolated, skinned, and subjected to mechanical measurements. Following mechanical measurements, fast-twitch fibers were identified by SDS-PAGE analysis of myosin heavy chain isoform expression. Only data from fibers that were identified as expressing predominantly type IIb myosin heavy chain (indicative of fast-twitch glycolytic fibers) were used. Force measurements made on single skinned fibers from the gastrocnemius of rats in different age groups revealed a significant decrease in maximal force (peak force) in fibers from the muscles of 36-month-old rats compared to fibers from 6-month-old rats (Fig. 5A and Table S2). Likewise, the maximal force generated by fast-twitch fibers from 36-month-old rats was significantly decreased in comparison to that from 6-month-old rats after normalization to fiber cross-sectional area (specific force; Fig. 5B and Table S2), indicating that the decrease in peak force could not be attributed solely to the observed decrease in fiber size (Fig. 2I and Table S1). At sub-maximal Ca2+ concentrations (i.e., concentrations of Ca2+ lower than those required to produce maximal force) there were significant differences in the relative force (force obtained at sub-maximal Ca2+ concentrations normalized to maximal force) generated by fibers in the 3 age groups; with higher levels of force being generated in fast-twitch fibers from 6- compared to 24-month-old muscles, and in 24- compared to 36-month-old muscles (Fig. 5D). As a consequence, a progressive rightward shift in the force-pCa (where pCa represents the −log10 of the Ca2+ concentration) relationship occurred as the age of the muscle fibers increased—an indication of decreased Ca2+-sensitivity of force. The rightward shift in the force-pCa relationship resulted in a significant decrease (p < 0.05) in the pCa producing half-maximal force (pCa50) as the animals aged (Fig. 5C and Table S2). Analysis of changes in the force-velocity relationship revealed that loaded shortening velocity decreased with increasing age (Fig. 5E and Table S2), implying that the rate of cross-bridge dissociation from the thin filament also declines in aging fast-twitch muscle fibers. Derivation of the power-force relationship from the force-velocity data showed a progressive and significant decrease in normalized peak power output (where power is expressed as the product of the specific force and velocity) with advancing age (Fig. 5F and Table S2).
Fig. 5. The intrinsic contractile function of fast-twitch muscle fibers declines with age.

Maximal isometric force (peak force; measured in solution with pCa 4.5) (A) and specific force (B) of single type II (fast-twitch) fibers from 6- (n = 25), 24- (n = 33), and 36-month-old rats (n = 27). (C) Age-related decrease in pCa50 values from 6- (n = 25), 24- (n = 33), and 36-month-old rats (n = 27). (D) Force-pCa relationships for single skinned muscle fibers from the gastrocnemius muscles of 6-, 24-, and 36-month-old rats. n = 25 fibers (6-month), 33 fibers (24-month) and 27 fibers (36-month). Lines are best fit using the Hill equation. (E) Composite force–velocity curves from gastrocnemius fibers from 6- (n = 22), 24- (n = 26), and 36-month–old (n = 30) rats. Isotonic shortening velocity values at each load were averaged from all myocytes in each group. Lines are the best-fit regression line using the Hill equation as described in the Methods section. (F) Composite force–power curve constructed from force–velocity data. In each fiber at each load, force values (expressed as P/Po, i.e., relative force) were multiplied times mean velocity values (expressed in fl/sec), yielding a value of power output for each individual load. Lines are the best-fit regression line using the Hill equation as described in the Methods section. mo, month. All values represent mean ± SEM. *p < 0.05 vs. 6 mo.
Discussion
Sarcopenia, which is the age-related loss of skeletal muscle mass and contractile function2–4, represents a formidable challenge for the aging population—imposing substantial strain on health care systems and contributing to decreased quality of life in older individuals due to sarcopenia-associated disability and loss of independence5,6. Nevertheless, the molecular correlates of sarcopenia-associated muscle dysfunction remain unclear. Given that previous studies have shown age-related decreases in force production20,21, maximal shortening velocity22–24, and Ca2+-sensitivity of force25 in aged muscles, as well as extensive literature demonstrating that RLC phosphorylation affects these contractile parameters13–19, we hypothesized that age-related changes in the phosphorylation of RLC can account for sarcopenic fast-twitch muscle dysfunction. Herein, top-down targeted proteomic analysis enabled the detection of a progressive age-related decrease in RLC phosphorylation at Ser14/15. Subsequent mechanical analysis of single fast-twitch muscle fibers from young (6-month-old), middle-aged (24-month-old), and old (36-month-old) rats uncovered age-related decreases in force generation, the Ca2+-sensitivity of force, loaded shortening velocity, and power output; all of which can be explained by the observed decrease in RLC phosphorylation13–19. Therefore, our findings identify, for the first time, progressive loss of RLC phosphorylation as a critical mechanism underlying contractile dysfunction in fast-twitch muscle fibers from aged individuals, and suggest that RLC phosphorylation may represent a new target for the treatment of sarcopenic muscle dysfunction.
Sarcopenia and contractile dysfunction
The age-related progressive impairment in whole muscle mechanical function22,23,25,60 can, in part, be accounted for by muscle fiber atrophy, which contributes to the loss of muscle mass with age2. Nevertheless, changes in the contractile properties of single muscle fibers also play a role in sarcopenia-associated mechanical dysfunction as demonstrated here and by other studies9. In particular, we observed a decrease in the specific force (force normalized to fiber cross-sectional area) generated by fast-twitch muscle fibers from old rats (36-month-old), which is consistent with the findings of previous studies20,21. Given that specific force accounts for the role played by changes in fiber size (i.e., changes in cross-sectional area due to fiber atrophy) in diminished force production, this result indicates that the age-related impairment of force generation involves alterations at the level of actin-myosin cross-bridges. Two potential mechanisms could account for this, namely, reduced storage and release of sarcoplasmic reticulum Ca2+61, or intrinsic changes in the contractile apparatuses. Although both mechanisms likely contribute to sarcopenic muscle dysfunction, the measurement of mechanical function in single skinned (permeabilized) fibers in this study removed the influence of endogenous Ca2+ levels and allowed the focus to be placed on the contractile apparatus as a source of age-related alterations. In addition to decreased specific force, our analysis also uncovered a progressive age-related decrease in the Ca2+-sensitivity of force, as measured by the pCa50, which is consistent with the results of previous studies in rodents25.
Age-related sarcopenia is also associated with a decline in muscle shortening velocity22,23. Much of this decline in shortening velocity can be attributed to the preferential loss of type II (fast-twitch) fibers, which leaves an increased proportion of type I (slow-twitch) fibers in the muscle21 and results in an overall slowing of muscle contractile speed with age. In order to eliminate the effect of age-associated alterations in fiber-type, we examined shortening velocity selectively in fast-twitch fibers (i.e., fibers expressing predominantly type IIb myosin heavy chain) from rats in three different age groups. Moreover, in previous studies where fiber-type specific changes in shortening velocity have been measured, aging has been associated with a decrease in maximal shortening velocity (Vmax)22,23. However, Vmax is a measure of shortening velocity during unloaded contractions, which is an un-physiological condition because muscle always contracts under some load. A more physiologically relevant measure of contractile function is the shortening velocity when the muscle is generating force (i.e., loaded shortening velocity), as measured in this study. Force-velocity measurements in fast-twitch fibers from aging rats enabled the detection of an age-related decrease in loaded shortening velocity.
In addition to age-related changes in loaded shortening velocity, power output (work per unit time), which is the product of force and velocity, has been shown to decrease with age, and is thought to be an important indicator of physical function in older adults62. Since muscle fiber power output occurs only during loaded shortening, analysis of loaded shortening velocity in this study allowed for the assessment of age-related changes in power output. Not surprisingly, the observed decrease in shortening velocity at each load resulted in a progressive decrease in the peak power output in single fibers as the muscles aged. The observed alterations in the force-velocity properties and power output in sarcopenic fast-twitch muscle fibers observed herein are consistent with the findings of previous studies24,63.
Decreased RLC phosphorylation as the underlying mechanism of sarcopenic muscle dysfunction
Our targeted proteomic analysis revealed an age-related progressive decrease in RLC phosphorylation that accounts for sarcopenic fast-twitch skeletal muscle dysfunction13–19. At the molecular level, RLC phosphorylation results in repositioning of the myosin heads towards the thin filament, thereby increasing the probability of weak-to-strong force-generating transitions at a given level of Ca2+14,15. Accordingly, based on the age-related decrease in RLC phosphorylation observed in this study, it would be expected that the proportion of myosin heads in strong-binding states would decline with advancing age, as a consequence of a decrease in the number of myosin heads positioned near the thin filament. Indeed, previous studies in aging rat muscle have shown that aging is associated with a decrease in the fraction of myosin heads that are in the strong-binding state during contraction64. Additionally, decreased RLC phosphorylation would be expected to decrease force potentiation and cross-bridge cycling kinetics in aged skeletal muscle fibers as a consequence of a decrease in the number of myosin heads interacting with the thin filament14,15,18,19,65. Consistent with this expectation, here we observed age-related decreases in the specific force and loaded shortening velocity of fast-twitch muscle fibers from aged rats, which further supports a causal role for decreased RLC phosphorylation in sarcopenic muscle dysfunction. It is worth noting that, although the observed decreases in maximal force and shortening velocity could also be explained by age-related changes in myosin ATPase activity, previous studies have demonstrated that the ATPase activity of myosin is not altered with age20. In addition to positioning of the myosin head, data from in vitro studies has suggested that RLC phosphorylation can also regulate myosin step-size, kinetics, lever-arm stiffness, and can participate in strain-dependent myosin biochemistry66,67, although changes in these parameters in aging muscle have not been studied.
Szcesna et al. showed that the skeletal muscle myosin reconstituted with phosphorylated RLC produced a significantly higher Ca2+-sensitivity of force in skinned muscle fibers than non-phosphorylated RLC; convincingly demonstrating that the level of endogenous RLC phosphorylation is a crucial determinant of the Ca2+-sensitivity of force development16. In agreement with this, our analysis of sarcopenic fast-twitch fibers from young, middle-aged, and old rats revealed an age-related progressive decline in Ca2+-sensitivity of force that mirrored the decline in fast skeletal RLC phosphorylation. Thus, the age-related decrease in fast skeletal RLC phosphorylation that we have shown here can account for the age-related declines in force generation, Ca2+-sensitivity of force, loaded shortening velocity, and power output in sarcopenic muscle.
Therefore, the results presented herein suggest that augmentation of RLC phosphorylation may improve contractile function in sarcopenic muscle. Interestingly, a recent study also showed that the expression of pseudo-phosphorylated RLC is sufficient to abrogate or prevent the development of hypertrophic cardiomyopathy in a mouse model of hypertrophic cardiomyopathy68, which further underscores the significance of RLC phosphorylation as a potential drug target to correct aberrant contractile function in striated muscle. Thus, our finding that decreased RLC phosphorylation underlies age-related fast-twitch muscle dysfunction is timely, particularly given recent interest in direct therapeutic targeting of the sarcomere as a means of correcting muscle dysfunction69.
Hypothesis-driven top-down targeted proteomics
While discovery-based proteomics has an advantage over targeted proteomics in terms of broad and un-biased proteome coverage, it comes at the cost of reduced sensitivity, stochastic sampling, and a bias against the detection of low abundance proteins32. In particular, variability in terms of proteome sampling significantly limits the usefulness of the discovery-based approach for addressing specific questions of biological relevance, especially given the extreme complexity and large dynamic range of the tissue and blood proteomes32,70. On the other hand, for hypothesis-driven research, targeted proteomics provides exceptional sensitivity and reproducibility, enabling reliable quantification of specific proteoforms of interest33–40. Top-down targeted proteomics, in particular, has significant advantages for biomedical research, including the ability to detect and localize the full complement of protein PTMs and sequence variations with complete sequence coverage, as well as relative quantification of modified and un-modified proteoforms present within the same spectrum27–29,35,36. We and others have already demonstrated that the combination of top-down MS and targeted proteomics is highly promising for identifying both the molecular correlates of disease and potential diagnostic markers31,41–46.
In this study, quantitative top-down targeted proteomics enabled the discovery of a progressive decline in the phosphorylation of RLC in the fast-twitch skeletal muscle of aging rats. This finding not only represents the first report linking age-related changes in the phosphorylation of fast skeletal RLC to contractile dysfunction in sarcopenic muscle, but also highlights the great potential of top-down targeted proteomics for the quantification of proteoform changes in biological samples, and the elucidation of the molecular determinants of disease pathobiology. In addition to localizing PTMs, top-down proteomics allows for the interdependence between PTMs on the same protein to be determined, which is not possible with bottom-up proteomics due to protein digestion. Herein, top-down MS/MS analysis of RLC proteoforms from the fast-twitch skeletal muscle of aging rats facilitated localization of the sites of decreasing phosphorylation to Ser14/15, with phosphorylation of Ser14 not having previously been reported. Moreover, the observation that Ser15 was the only phosphorylated residue in pRLC, whereas Ser15 and Ser14 were phosphorylated in ppRLC, suggests an ordered mechanism of phosphorylation wherein Ser15 is the first residue phosphorylated and Ser14 the second. As demonstrated here, top-down MS/MS with high-resolution is an especially valuable tool for proteoform analysis, enabling the confident assignment of Nα-tri-methylation over Nα-acetylation; two modifications differing by approximately 36 mDa. Collectively, the findings of this study showcase both the power of high-resolution top-down targeted proteomics for proteoform analysis, and the potential of integrated approaches combining top-down targeted proteomics with functional assays to dissect the molecular mechanisms of disease.
Supplementary Material
Supplementary Table S1: Body masses and characteristics of gastrocnemius muscles from 6-, 24-, and 36-month-old rats;
Supplementary Table S2: Single fiber contractile properties of MHC type II fibers from 6-, 24-, and 36-month-old rats;
Supplementary Figure S1: Chromatographic separation of myofilament sub-proteome from the gastrocnemius muscles of rats in different age groups;
Supplementary Figure S2: Reproducibility of MS analysis of RLC from representative biological replicates from 6-, 24-, and 36-month-old rats;
Supplementary Figure S3: MS/MS characterization of RLC from fast-twitch skeletal muscle;
Supplementary Figure S4: Localization of Ser15 and Ser14/15 as the phosphorylation sites in pRLC and ppRLC, respectively;
Supplementary Figure S5: Sequence alignment of RLC from fast-twitch skeletal muscle of different species.
Acknowledgments
The authors would like to thank Steven Danielson of Thermo Scientific for technical assistance with MS and data analysis. The authors also wish to thank J.R. Patel for helpful discussion and Ziqing Lin for critical reading of this manuscript. Financial support was kindly provided by NIH F31 HL128086 (to Z.R.G.), NIH R01 HL109810 and R01 HL096971 (to Y.G.), and NIH R01 AG030423 (to J.M.A.). YG also would like to acknowledge NIH R01 GM 117058, and S10 OD018475.
Abbreviations
- RLC
regulatory light chain
- MLCK
myosin light chain kinase
- MS
mass spectrometry
- PTMs
post-translational modifications
- MS/MS
tandem MS
- F344BN
Fisher 344 x Brown Norway F1 hybrid
- LC
liquid chromatography
- m/z
mass-to-charge ratio
- pRLC
mono-phosphorylated RLC
- ppRLC
bis-phosphorylated RLC
- ECD
electron capture dissociation
- pCa
-log10 of the Ca2+ concentration
- pCa50
pCa producing half-maximal force
- Vmax
maximal shortening velocity
Footnotes
Author contributions
Z.R.G., W.C., Y.J., Y.P., J.M.A., G.M.D., and Y.G. designed research; Z.R.G., W.C., Y.J., L.W., A.J.C., S.H.M and G.M.D. performed research; Z.R.G., Y.J., Y.P., and G.M.D. analyzed data; and Z.R.G., R.L.M., G.M.D., and Y.G. wrote the paper.
Competing financial interests: The authors declare no competing financial interests.
References
- 1.Christensen K, Doblhammer G, Rau R, Vaupel JW. Lancet. 2009;374:1196–1208. doi: 10.1016/S0140-6736(09)61460-4. [DOI] [PMC free article] [PubMed] [Google Scholar]
- 2.Ryall JG, Schertzer JD, Lynch GS. Biogerontology. 2008;9:213–228. doi: 10.1007/s10522-008-9131-0. [DOI] [PubMed] [Google Scholar]
- 3.Rolland Y, Czerwinski S, Abellan Van Kan G, Morley JE, Cesari M, Onder G, Woo J, Baumgartner R, Pillard F, Boirie Y, Chumlea WM, Vellas B. J Nutr Health Aging. 2008;12:433–450. doi: 10.1007/BF02982704. [DOI] [PMC free article] [PubMed] [Google Scholar]
- 4.Cohen S, Nathan JA, Goldberg AL. Nat Rev Drug Discov. 2015;14:58–74. doi: 10.1038/nrd4467. [DOI] [PubMed] [Google Scholar]
- 5.Janssen I, Heymsfield SB, Ross R. J Am Geriatr Soc. 2002;50:889–896. doi: 10.1046/j.1532-5415.2002.50216.x. [DOI] [PubMed] [Google Scholar]
- 6.Janssen I, Shepard DS, Katzmarzyk PT, Roubenoff R. J Am Geriatr Soc. 2004;52:80–85. doi: 10.1111/j.1532-5415.2004.52014.x. [DOI] [PubMed] [Google Scholar]
- 7.Ciciliot S, Rossi AC, Dyar KA, Blaauw B, Schiaffino S. Int J Biochem Cell Biol. 2013;45:2191–2199. doi: 10.1016/j.biocel.2013.05.016. [DOI] [PubMed] [Google Scholar]
- 8.Thompson LV. Phys Ther. 1994;74:71–81. doi: 10.1093/ptj/74.1.71. [DOI] [PubMed] [Google Scholar]
- 9.Miller MS, Callahan DM, Toth MJ. Front Physiol. 2014;5:369. doi: 10.3389/fphys.2014.00369. [DOI] [PMC free article] [PubMed] [Google Scholar]
- 10.Moss RL, Diffee GM, Greaser ML. Rev Physiol Biochem Pharmacol. 1995;126:1–63. doi: 10.1007/BFb0049775. [DOI] [PubMed] [Google Scholar]
- 11.Schiaffino S, Reggiani C. Physiol Rev. 1996;76:371–423. doi: 10.1152/physrev.1996.76.2.371. [DOI] [PubMed] [Google Scholar]
- 12.Poetter K, Jiang H, Hassanzadeh S, Master SR, Chang A, Dalakas MC, Rayment I, Sellers JR, Fananapazir L, Epstein ND. Nat Genet. 1996;13:63–69. doi: 10.1038/ng0596-63. [DOI] [PubMed] [Google Scholar]
- 13.Stull JT, Kamm KE, Vandenboom R. Arch Biochem Biophys. 2011;510:120–128. doi: 10.1016/j.abb.2011.01.017. [DOI] [PMC free article] [PubMed] [Google Scholar]
- 14.Sweeney HL, Bowman BF, Stull JT. Am J Physiol. 1993;264:C1085–1095. doi: 10.1152/ajpcell.1993.264.5.C1085. [DOI] [PubMed] [Google Scholar]
- 15.Metzger JM, Greaser ML, Moss RL. J Gen Physiol. 1989;93:855–883. doi: 10.1085/jgp.93.5.855. [DOI] [PMC free article] [PubMed] [Google Scholar]
- 16.Szczesna D, Zhao J, Jones M, Zhi G, Stull J, Potter JD. J Appl Physiol (1985) 2002;92:1661–1670. doi: 10.1152/japplphysiol.00858.2001. [DOI] [PubMed] [Google Scholar]
- 17.Patel JR, Diffee GM, Huang XP, Moss RL. Biophys J. 1998;74:360–368. doi: 10.1016/S0006-3495(98)77793-8. [DOI] [PMC free article] [PubMed] [Google Scholar]
- 18.Sweeney HL, Stull JT. Proc Natl Acad Sci U S A. 1990;87:414–418. doi: 10.1073/pnas.87.1.414. [DOI] [PMC free article] [PubMed] [Google Scholar]
- 19.Zhi G, Ryder JW, Huang J, Ding P, Chen Y, Zhao Y, Kamm KE, Stull JT. Proc Natl Acad Sci U S A. 2005;102:17519–17524. doi: 10.1073/pnas.0506846102. [DOI] [PMC free article] [PubMed] [Google Scholar]
- 20.Lowe DA, Thomas DD, Thompson LV. Am J Physiol Cell Physiol. 2002;283:C187–192. doi: 10.1152/ajpcell.00008.2002. [DOI] [PubMed] [Google Scholar]
- 21.Thompson LV. Exp Gerontol. 2009;44:106–111. doi: 10.1016/j.exger.2008.05.003. [DOI] [PMC free article] [PubMed] [Google Scholar]
- 22.Larsson L, Li X, Frontera WR. Am J Physiol. 1997;272:C638–649. doi: 10.1152/ajpcell.1997.272.2.C638. [DOI] [PubMed] [Google Scholar]
- 23.Degens H, Yu F, Li X, Larsson L. Acta Physiol Scand. 1998;163:33–40. doi: 10.1046/j.1365-201x.1998.00329.x. [DOI] [PubMed] [Google Scholar]
- 24.Eddinger TJ, Cassens RG, Moss RL. Am J Physiol. 1986;251:C421–430. doi: 10.1152/ajpcell.1986.251.3.C421. [DOI] [PubMed] [Google Scholar]
- 25.Lynch GS, Rodgers BJ, Williams DA. Growth Dev Aging. 1993;57:147–161. [PubMed] [Google Scholar]
- 26.Smith LM, Kelleher NL Proteomics CfTD. Nat Methods. 2013;10:186–187. doi: 10.1038/nmeth.2369. [DOI] [PMC free article] [PubMed] [Google Scholar]
- 27.Zhang H, Ge Y. Circulation Cardiovascular genetics. 2011;4:711. doi: 10.1161/CIRCGENETICS.110.957829. [DOI] [PMC free article] [PubMed] [Google Scholar]
- 28.Siuti N, Kelleher NL. Nature methods. 2007;4:817–821. doi: 10.1038/nmeth1097. [DOI] [PMC free article] [PubMed] [Google Scholar]
- 29.Gregorich ZR, Ge Y. Proteomics. 2014;14:1195–1210. doi: 10.1002/pmic.201300432. [DOI] [PMC free article] [PubMed] [Google Scholar]
- 30.Tran JC, Zamdborg L, Ahlf DR, Lee JE, Catherman AD, Durbin KR, Tipton JD, Vellaichamy A, Kellie JF, Li M, Wu C, Sweet SM, Early BP, Siuti N, LeDuc RD, Compton PD, Thomas PM, Kelleher NL. Nature. 2011;480:254–258. doi: 10.1038/nature10575. [DOI] [PMC free article] [PubMed] [Google Scholar]
- 31.Ansong C, Wu S, Meng D, Liu X, Brewer HM, Deatherage Kaiser BL, Nakayasu ES, Cort JR, Pevzner P, Smith RD, Heffron F, Adkins JN, Pasa-Tolic L. Proc Natl Acad Sci U S A. 2013;110:10153–10158. doi: 10.1073/pnas.1221210110. [DOI] [PMC free article] [PubMed] [Google Scholar]
- 32.Domon B, Aebersold R. Nat Biotechnol. 2010;28:710–721. doi: 10.1038/nbt.1661. [DOI] [PubMed] [Google Scholar]
- 33.Schiess R, Wollscheid B, Aebersold R. Mol Oncol. 2009;3:33–44. doi: 10.1016/j.molonc.2008.12.001. [DOI] [PMC free article] [PubMed] [Google Scholar]
- 34.Whitelegge JP, Zhang H, Aguilera R, Taylor RM, Cramer WA. Mol Cell Proteomics. 2002;1:816–827. doi: 10.1074/mcp.m200045-mcp200. [DOI] [PubMed] [Google Scholar]
- 35.Whitelegge JP, Zabrouskov V, Halgand F, Souda P, Bassilian S, Yan W, Wolinsky L, Loo JA, Wong DT, Faull KF. Int J Mass Spectrom. 2007;268:190–197. doi: 10.1016/j.ijms.2007.08.008. [DOI] [PMC free article] [PubMed] [Google Scholar]
- 36.Webb KJ, Laganowsky A, Whitelegge JP, Clarke SG. J Biol Chem. 2008;283:35561–35568. doi: 10.1074/jbc.M806006200. [DOI] [PMC free article] [PubMed] [Google Scholar]
- 37.Halgand F, Zabrouskov V, Bassilian S, Souda P, Loo JA, Faull KF, Wong DT, Whitelegge JP. Anal Chem. 2012;84:4383–4395. doi: 10.1021/ac203337s. [DOI] [PMC free article] [PubMed] [Google Scholar]
- 38.Thangaraj B, Ryan CM, Souda P, Krause K, Faull KF, Weber AP, Fromme P, Whitelegge JP. Proteomics. 2010;10:3644–3656. doi: 10.1002/pmic.201000190. [DOI] [PMC free article] [PubMed] [Google Scholar]
- 39.Ryan CM, Souda P, Bassilian S, Ujwal R, Zhang J, Abramson J, Ping P, Durazo A, Bowie JU, Hasan SS, Baniulis D, Cramer WA, Faull KF, Whitelegge JP. Mol Cell Proteomics. 2010;9:791–803. doi: 10.1074/mcp.M900516-MCP200. [DOI] [PMC free article] [PubMed] [Google Scholar]
- 40.Puppione DL, Ryan CM, Bassilian S, Souda P, Xiao X, Ryder OA, Whitelegge JP. Comp Biochem Physiol Part D Genomics Proteomics. 2010;5:73–79. doi: 10.1016/j.cbd.2009.12.003. [DOI] [PMC free article] [PubMed] [Google Scholar]
- 41.Chamot-Rooke J, Mikaty G, Malosse C, Soyer M, Dumont A, Gault J, Imhaus AF, Martin P, Trellet M, Clary G, Chafey P, Camoin L, Nilges M, Nassif X, Duménil G. Science. 2011;331:778–782. doi: 10.1126/science.1200729. [DOI] [PubMed] [Google Scholar]
- 42.Zhang J, Guy MJ, Norman HS, Chen YC, Xu Q, Dong X, Guner H, Wang S, Kohmoto T, Young KH, Moss RL, Ge Y. J Proteome Res. 2011;10:4054–4065. doi: 10.1021/pr200258m. [DOI] [PMC free article] [PubMed] [Google Scholar]
- 43.Dong X, Sumandea CA, Chen YC, Garcia-Cazarin ML, Zhang J, Balke CW, Sumandea MP, Ge Y. The Journal of biological chemistry. 2012;287:848–857. doi: 10.1074/jbc.M111.293258. [DOI] [PMC free article] [PubMed] [Google Scholar]
- 44.Peng Y, Gregorich ZR, Valeja SG, Zhang H, Cai W, Chen YC, Guner H, Chen AJ, Schwahn DJ, Hacker TA, Liu X, Ge Y. Mol Cell Proteomics. 2014;13:2752–2764. doi: 10.1074/mcp.M114.040675. [DOI] [PMC free article] [PubMed] [Google Scholar]
- 45.Mazur MT, Cardasis HL, Spellman DS, Liaw A, Yates NA, Hendrickson RC. Proc Natl Acad Sci U S A. 2010;107:7728–7733. doi: 10.1073/pnas.0910776107. [DOI] [PMC free article] [PubMed] [Google Scholar]
- 46.Burnaevskiy N, Fox TG, Plymire DA, Ertelt JM, Weigele BA, Selyunin AS, Way SS, Patrie SM, Alto NM. Nature. 2013;496:106–109. doi: 10.1038/nature12004. [DOI] [PMC free article] [PubMed] [Google Scholar]
- 47.Lushaj EB, Johnson JK, McKenzie D, Aiken JM. J Gerontol A Biol Sci Med Sci. 2008;63:921–927. doi: 10.1093/gerona/63.9.921. [DOI] [PMC free article] [PubMed] [Google Scholar]
- 48.Sheehan D, Hrapchak B. Theory and practice of histotechnology. 2. Mosby; St. Louis: 1980. [Google Scholar]
- 49.Ge Y, Rybakova IN, Xu Q, Moss RL. Proceedings of the National Academy of Sciences of the United States of America. 2009;106:12658–12663. doi: 10.1073/pnas.0813369106. [DOI] [PMC free article] [PubMed] [Google Scholar]
- 50.Cai W, Guner H, Gregorich ZR, Chen AJ, Ayaz-Guner S, Peng Y, Valeja SG, Liu X, Ge Y. Mol Cell Proteomics. 2015 doi: 10.1074/mcp.O115.054387. [DOI] [PMC free article] [PubMed] [Google Scholar]
- 51.Liu X, Sirotkin Y, Shen Y, Anderson G, Tsai YS, Ting YS, Goodlett DR, Smith RD, Bafna V, Pevzner PA. Mol Cell Proteomics. 2012;11:M111.008524. doi: 10.1074/mcp.M111.008524. [DOI] [PMC free article] [PubMed] [Google Scholar]
- 52.Diffee GM, Greaser ML, Reinach FC, Moss RL. Biophys J. 1995;68:1443–1452. doi: 10.1016/S0006-3495(95)80317-6. [DOI] [PMC free article] [PubMed] [Google Scholar]
- 53.Fabiato A. Methods Enzymol. 1988;157:378–417. doi: 10.1016/0076-6879(88)57093-3. [DOI] [PubMed] [Google Scholar]
- 54.Hofmann PA, Metzger JM, Greaser ML, Moss RL. J Gen Physiol. 1990;95:477–498. doi: 10.1085/jgp.95.3.477. [DOI] [PMC free article] [PubMed] [Google Scholar]
- 55.Diffee GM, Chung E. J Appl Physiol (1985) 2003;94:1941–1948. doi: 10.1152/japplphysiol.00889.2002. [DOI] [PubMed] [Google Scholar]
- 56.Cornachione AS, Benedini-Elias PC, Polizello JC, Carvalho LC, Mattiello-Sverzut AC. Acta Histochem Cytochem. 2011;44:43–50. doi: 10.1267/ahc.10031. [DOI] [PMC free article] [PubMed] [Google Scholar]
- 57.Henry GD, Trayer IP, Brewer S, Levine BA. Eur J Biochem. 1985;148:75–82. doi: 10.1111/j.1432-1033.1985.tb08809.x. [DOI] [PubMed] [Google Scholar]
- 58.Jakes R, Northrop F, Kendrick-Jones J. FEBS Lett. 1976;70:229–234. doi: 10.1016/0014-5793(76)80763-6. [DOI] [PubMed] [Google Scholar]
- 59.Scruggs SB, Reisdorph R, Armstrong ML, Warren CM, Reisdorph N, Solaro RJ, Buttrick PM. Mol Cell Proteomics. 2010;9:1804–1818. doi: 10.1074/mcp.M110.000075. [DOI] [PMC free article] [PubMed] [Google Scholar]
- 60.Macaluso A, De Vito G. Eur J Appl Physiol. 2004;91:450–472. doi: 10.1007/s00421-003-0991-3. [DOI] [PubMed] [Google Scholar]
- 61.Gonzalez E, Messi ML, Zheng Z, Delbono O. J Physiol. 2003;552:833–844. doi: 10.1113/jphysiol.2003.048165. [DOI] [PMC free article] [PubMed] [Google Scholar]
- 62.Reid KF, Fielding RA. Exerc Sport Sci Rev. 2012;40:4–12. doi: 10.1097/JES.0b013e31823b5f13. [DOI] [PMC free article] [PubMed] [Google Scholar]
- 63.Graber TG, Kim JH, Grange RW, McLoon LK, Thompson LV. Age (Dordr) 2015;37:9773. doi: 10.1007/s11357-015-9773-1. [DOI] [PMC free article] [PubMed] [Google Scholar]
- 64.Lowe DA, Surek JT, Thomas DD, Thompson LV. Am J Physiol Cell Physiol. 2001;280:C540–547. doi: 10.1152/ajpcell.2001.280.3.C540. [DOI] [PubMed] [Google Scholar]
- 65.Grange RW, Cory CR, Vandenboom R, Houston ME. Am J Physiol. 1995;269:C713–724. doi: 10.1152/ajpcell.1995.269.3.C713. [DOI] [PubMed] [Google Scholar]
- 66.Wang Y, Ajtai K, Burghardt TP. J Mol Cell Cardiol. 2014;72:231–237. doi: 10.1016/j.yjmcc.2014.03.022. [DOI] [PMC free article] [PubMed] [Google Scholar]
- 67.Greenberg MJ, Mealy TR, Watt JD, Jones M, Szczesna-Cordary D, Moore JR. Am J Physiol Regul Integr Comp Physiol. 2009;297:R265–274. doi: 10.1152/ajpregu.00171.2009. [DOI] [PMC free article] [PubMed] [Google Scholar]
- 68.Yuan CC, Muthu P, Kazmierczak K, Liang J, Huang W, Irving TC, Kanashiro-Takeuchi RM, Hare JM, Szczesna-Cordary D. Proc Natl Acad Sci U S A. 2015;112:E4138–4146. doi: 10.1073/pnas.1505819112. [DOI] [PMC free article] [PubMed] [Google Scholar]
- 69.Hwang PM, Sykes BD. Nat Rev Drug Discov. 2015;14:313–328. doi: 10.1038/nrd4554. [DOI] [PubMed] [Google Scholar]
- 70.Gillette MA, Carr SA. Nat Methods. 2013;10:28–34. doi: 10.1038/nmeth.2309. [DOI] [PMC free article] [PubMed] [Google Scholar]
Associated Data
This section collects any data citations, data availability statements, or supplementary materials included in this article.
Supplementary Materials
Supplementary Table S1: Body masses and characteristics of gastrocnemius muscles from 6-, 24-, and 36-month-old rats;
Supplementary Table S2: Single fiber contractile properties of MHC type II fibers from 6-, 24-, and 36-month-old rats;
Supplementary Figure S1: Chromatographic separation of myofilament sub-proteome from the gastrocnemius muscles of rats in different age groups;
Supplementary Figure S2: Reproducibility of MS analysis of RLC from representative biological replicates from 6-, 24-, and 36-month-old rats;
Supplementary Figure S3: MS/MS characterization of RLC from fast-twitch skeletal muscle;
Supplementary Figure S4: Localization of Ser15 and Ser14/15 as the phosphorylation sites in pRLC and ppRLC, respectively;
Supplementary Figure S5: Sequence alignment of RLC from fast-twitch skeletal muscle of different species.