Abstract
In clinical cardiology, both anatomy and physiology are needed to diagnose cardiac pathologies. CT imaging and computer simulations provide valuable and complementary data for this purpose. However, it remains challenging to gain useful information from the large amount of high-dimensional diverse data. The current tools are not adequately integrated to visualize anatomic and physiologic data from a complete yet focused perspective. We introduce a new computer-aided diagnosis framework, which allows for comprehensive modeling and visualization of cardiac anatomy and physiology from CT imaging data and computer simulations, with a primary focus on ischemic heart disease. The following visual information is presented: (1) Anatomy from CT imaging: geometric modeling and visualization of cardiac anatomy, including four heart chambers, left and right ventricular outflow tracts, and coronary arteries; (2) Function from CT imaging: motion modeling, strain calculation, and visualization of four heart chambers; (3) Physiology from CT imaging: quantification and visualization of myocardial perfusion and contextual integration with coronary artery anatomy; (4) Physiology from computer simulation: computation and visualization of hemodynamics (e.g., coronary blood velocity, pressure, shear stress, and fluid forces on the vessel wall). Substantially, feedback from cardiologists have confirmed the practical utility of integrating these features for the purpose of computer-aided diagnosis of ischemic heart disease.
Index Terms: Cardiac chamber, coronary artery, imaging, anatomy, physiology, perfusion, motion, strain, shear stress, Bull’sEye Plot, image analysis, geometric modeling, computational fluid dynamics, visualization
1 Introduction
The human heart is a complex organ in terms of both two atria, and two ventricles on the left and right side. The left ventricle (LV) pumps blood to the systemic circulation through the aorta, and deoxygenated blood returns to the right atrium. The right ventricle closes the loop by pumping the blood to the lung for oxygenation, which then flows back to the left atrium. Both ventricles contract to pump the blood during systole and relax to fill with blood during diastole. The muscular wall or the myocardium surrounding the LV is thicker compared to the right ventricle and achieves a higher pressure that is required to pump the blood to supply the systemic circulation. The coronary arteries supply blood to the heart itself. The buildup of cholesterol and fatty deposits gradually develop into plaque that resides on the inner wall of the coronary arteries, and causes an anatomic narrowing (i.e., stenosis) or blockage of the coronary arteries. Coronary artery stenosis becomes hemodynamically significant when it severely restricts the blood flow to the myocardial tissue and ultimately leads to myocardial infarction if the tissue is permanently damaged [1]. Further still, more acute coronary events may be triggered by the rupture or erosion of hemodynamically insignificant plaques and coronary thrombosis, which far exceeds the occurrence of flow-limiting lesions [2]. Subsequently, the development of new approaches to identify both ischemic coronary lesions as well as “vulnerable atherosclerotic plaques”, while also exploring their relationship with the onset of cardiac events has recently received considerable attention [3].
Many diagnostic imaging techniques have been developed to characterize cardiac anatomy and function, such as echocardiography, single-photon emission computed tomography, positron emission tomography, cardiac magnetic resonance, cardiac computed tomography, and invasive coronary angiography. Compared to other modalities, cardiac computed tomography (CT) is a noninvasive and fast imaging option [4], which permits acquisition of virtually motion-free 3D morphological images of heart chambers, great vessels, and coronary arteries at a high spatial resolution (<0.5mm). In particular, CT allows for both the identification of anatomically significant luminal stenosis and the assessment of adverse plaque characteristics in the arterial wall [5]. CT also provides reasonable temporal resolution (<83 milliseconds), thereby enabling the visualization of cardiac structures at different phases along with the evaluation of functional abnormalities [6] (e.g., irregular motion patterns of the LV). Furthermore, the ability of CT has been extended to evaluate the physiologic significance of coronary lesions by measuring myocardial perfusion, which reflects the concentration of the contrast-enhanced blood in the myocardial tissue [7]. Although the radiation exposure associated with CT is of some concern, the dose is continuously decreasing with new acquisition modes, and is currently as low as 1mSv for coronary CT angiography [8].
While CT excels for visualizing cardiac anatomy, diagnosis of ischemia based on CT alone is less robust due to the lack of physiologic information [9]. For example, miscalculation of the severity of coronary stenosis is often observed because CT does not provide any direct measurement of coronary flow or pressure [10]. Other hemodynamic factors are also missing (e.g., shear stress and total traction force on the vessel wall), which have been shown to play an important role in the formation and progression of atherosclerotic plaque [11]. Fortunately, computer simulations using computational fluid dynamics (CFD) have been applied to image-based blood flow modeling, which now allows for non-invasive calculations of coronary pressure, flow, and shear stress using patient-specific geometry constructed from imaging data [12, 13]. Although several assumptions and estimations (i.e., inflow and outflow boundary conditions, rigid walls, etc.) are usually made when utilizing flow computation according to CFD, it has nevertheless been proven to improve the diagnostic performance of coronary ischemia than CT alone [14–16].
While CT imaging and computer simulations equip cardiologists with a wealth of anatomic and physiologic information of the heart, accurate diagnosis by traditional 2D slice-based visualization techniques (e.g., on orthogonal or oblique planes) proves challenging when faced with overwhelming amounts of imaging and simulation data. To this end, automated image segmentation and quantification algorithms greatly facilitate quantitative image analysis, visualization, and decision making. Although systems that visualize either image-based cardiac anatomy and physiology, or processed and simulated data exist, it still remains a challenge for current visualization systems to integrate all disparate data together, as they are primarily designed to target single sources of information. Additionally, there are clinical standards and conventions that the graphical presentation of data should follow. For example, CT myocardial perfusion data is preferably displayed on an American Heart Association (AHA) 17-segment model [17]. The coronary arteries are commonly examined in a straightened view along the centerlines and another cross sectional view perpendicular to the centerlines. Moreover, user interaction is an important element to visualization, primarily for better adapting diagnostic tasks to the location and severity of the disease, and to improve the fidelity of the results by automated algorithms.
In this paper, we aim to develop a computer-aided diagnosis framework, which allows for comprehensive modeling and visualization of cardiac anatomy and physiology from CT imaging data and computer simulations, with a primary focus on ischemic heart disease. The CT imaging data are derived from anatomical coronary CT angiography and functional 4D CT, while the simulation process is based on CFD. Our approach supports the following visual information:
Anatomy from CT imaging: Geometric modeling and visualization of cardiac anatomy, including 4 heart chambers, left and right ventricular outflow tracts, and coronary arteries.
Function from CT imaging: Motion modeling, strain calculation, and visualization of 4 heart chambers.
Physiology from CT imaging: Quantification and visualization of myocardial perfusion and contextual integration with coronary artery anatomy.
Physiology from computer simulation: Computation and visualization of hemodynamics (i.e., coronary blood velocity, pressure, shear stress, and fluid forces on the vessel wall), with adjacent imaging features.
2 Related Work
Diagnosis of heart diseases is ideally based on the complete picture of anatomy and physiology due to the significant variations among individuals. Unfortunately, the current generations of medical imaging workstations do not provide sufficient intuitive visual support and are often overly tedious for use in clinical practice. Additionally, the opportunity to display simulation data is not yet supported, although clinical trials have consistently reported that simulated coronary flow improves diagnostic performance of identifying hemodynamically significant lesions when added to the approach of using imaging alone [16]. In light of this, there have been considerable efforts to address some of these limitations. Our review will focus on prior research regarding the visualization and modeling techniques. Specifically, we refer readers to the details of CT imaging outlined in [4], and CFD simulation techniques in [12, 13].
Oeltze et al. [18] presented an integrated visualization of coronary morphology from CT angiography and myocardial perfusion from magnetic resonance imaging (MRI). The perfusion information was displayed in the 2D Bull’s-Eye Plot (BEP) according to the AHA 17-segment model and correlated with coronary tree segmented from CT data. However, perfusion was not shown in the 3D myocardium and consequently, it was difficult to associate the perfusion defects with the affecting coronary lesion. They also integrated the perfusion and contractility information to detect non-viable myocardial tissue [19]. Kühnel et al. [20] proposed several visualization techniques to display a map of abnormal tissue with perfusion defects or scar from MRI data on the 3D myocardial surface to relate coronary stenoses visualized by CT that were candidates to cause the abnormalities. Similarly, Kirişli et al. [21] proposed and evaluated several model-based techniques to visualize the coronary tree with absolute diameter measures from CT and perfusion territory maps from MRI on 2D BEP and 3D surface renderings. In other work, Kirişli and colleagues [22] also evaluated their system to fuse coronary anatomy from CT and myocardial perfusion from single-photon emission computed tomography, and documented that the fused interpretation led to a more accurate diagnosis. To allow for assessment of transmurality (e.g., changes through the myocardial wall), Teemeer et al. [23] presented a visualization system for diagnosis of coronary artery disease using multiple types of MRI scans by extending the BEP into 3D to better discriminate scar from healthy tissue on the volumetric BEP, and then overlaying the coronary centerlines to add anatomical context. In subsequent work, they [24] also simulated blood flow in coronary arteries using lumped resistor models, as well as myocardial perfusion using a diffusion and absorption model. While perfusion was visualized on both 2D BEP and 3D surfaces, it was unable to compute and visualize detailed coronary blood flow using the simplified model. Besides these cardiac-specific visualization tools, general purpose tools, such as medInria [25], 3D Slicer [26], and SCIRun [27], have been applied to cardiac imaging.
Modeling techniques play a crucial role in the visualization of cardiac anatomy and physiology. Two major approaches have been proposed to model and segment heart chambers and great vessels. One approach is model-based, in which a template mesh model is first transformed to the proximity of the target heart in the new image and then the model is adjusted to fit the boundary. Lorenz and Berg [28] proposed a comprehensive heart model including four chambers and trunks of the attached vessels, that were constructed semi-automatically by landmark-driven model initialization and energy-minimizing surface adaption. Ecabert et al. [29] introduced a method for whole heart segmentation, in which the generalized Hough transform was used to localize the heart. Parametric and deformable adaptations were then performed to match the heart boundary. Zheng et al. [30] presented a learning-based four-chamber heart segmentation method. Supervised learning was used to search the similarity transform to locate the heart and delineate the boundary. Another approach of heart segmentation is atlas-based, in which manual labels of segmented atlas images are propagated into the new image-by-image registration and the final segmentation is obtained by a voting procedure at each voxel. In one study [31], Isgum et al. isolated whole heart regions from chest CT scans using multiple atlases and the local votes were derived from local assessment of registration performance. In a second study [32], Kirişli et al. evaluated a multi-atlas heart and chamber segmentation method on a large number of patients. In comparison, automated segmentation of coronary arteries is more challenging and thus less robust. The first step is centerline detection, mostly starting with heuristics-based [33, 34] or learning-based [35] vessel enhancement filtering, and then followed by data-driven centerline tracing [36] or assisted with a prior shape model [37]. With the detected centerline, coronary lumen are then segmented by level sets [38], graph cuts [39], supervised regression [39], or supervised classification [40]. Vessel wall segmentation and plaque type (i.e., calcified, non-calcified, or mixed) classification is much less mature, and are primarily performed by global or adaptive thresholding [41].
3 Overview of Our Approach
Despite the extensive research in the area of heart visualization from imaging data, systems that can closely integrate both imaging and simulation data have been lacking. In this paper, we propose a new framework including a number of modeling and visualization techniques, which provide a comprehensive evaluation of the anatomy and physiology for ischemic heart disease using CT imaging and CFD simulation. By employing smooth and concise surface representations and parameterized mapping between different models, our approach also enables interactive and synchronized exploration.
To provide anatomic context, we modeled the four chambers, as well as the aorta and pulmonary arteries attached to the heart as subdivision surfaces, and segmented them automatically from CT angiography images. To model coronary arteries, we first detected the centerline automatically from the CT angiography images. The lumen and vessel wall were modeled by sweeping through a series of two concentric cross-sectional contours and each cross-sectional contour was represented by a loop of radial points with distances from the centroid on the centerline. The lumen and vessel wall were segmented semi-automatically with the guidance of the centerline.
Using the models, the heart was visualized in four chambers, with the thickness of the LV wall delineated by inner, mid, and outer contours. The LV was further flattened on the 2D and 3D BEP for rendering of perfusion data. Several geometric and imaging characteristics were displayed on the coronary artery model, allowing for the assessment of coronary stenosis and atherosclerosis plaque in 3D. We also supported simultaneous rendering of the heart and the coronary arteries in both 2D and 3D for the purpose of evaluating the relationship of correlative abnormalities between them. Although simultaneous rendering of the heart and coronary arteries is not novel, it should be noted that our primary goal is to allow for such integration to be obtained through the use of a single modality only.
To characterize heart function from 4D (3D and time) CT images, our framework allows for visualizing the motion of chamber surface models. After segmenting one of the phases using the four-chamber model, a spatiotemporal model was constructed by propagating model boundaries to the other phases using an image registration algorithm. In addition to standard measurements of ejection fraction and cardiac output, the strain of the myocardial tissues were computed using a selected reference phase and displayed with overlays on deformed models.
In addition, our framework also allows for the quantification and visualization of perfusion information from standard coronary CT angiography scans as an indicator for myocardial blood flow. Based on the LV segmentation, we divided the LV myocardium using the AHA 17-segment model. The myocardial perfusion was computed in each segment as the normalized perfusion intensity and transmural perfusion ratio. The perfusion was displayed in both 3D surface models and 2D BEPs, and both were overlaid with the coronary geometry, intended for the association of a perfusion defect with possibly causative coronary artery stenoses.
Finally, our framework allows for visualizing the patient-specific simulation of coronary hemodynamics by applying CFD to CT angiography images. The simulated coronary blood velocity, and pressure, as well as shear stress and total traction forces on the vessel wall was displayed with both the anatomic context of segmented heart models and the physiologic context of myocardial perfusion.
For intended use, our framework is directed at cardiologists or radiologists, whose primary tasks are to diagnose ischemic heart disease from CT imaging. In their current work flow, the diagnosis is mainly performed by unassisted manual identification of coronary artery stenosis on multiplanar reformatted or curved planar reformatted images with optionally maximum- or minimum- intensity projections. The goal of our framework is to provide computer-aided diagnosis with automated modeling and integrated visualization for anatomic (i.e., heart and coronary arteries), functional (i.e., cardiac motion), and physiologic information (i.e., myocardial perfusion and coronary hemodynamics) that is clinically relevant, which may extend and improve their current work flow over unassisted procedures.
4 Heart and Coronary Artery Modeling
Generation of patient-specific models from the imaging data is a prerequisite for the entire visualization pipeline. We introduce the representation of our heart and coronary artery models, which supports both interactive editing and automated modeling.
4.1 Heart Model
Linear triangle meshes have been predominantly used in heart modeling [29, 30]. Although they are effective to delineate chamber boundaries obtained by segmentation algorithms, a large number of triangles are required to achieve a satisfactory level of smoothness for visualization. In addition, it is difficult to edit a surface comprised of dense triangles because the problem of nodal distortion and self-intersection may easily arise. Furthermore, both the endocardial (inner) and epicardial (outer) LV surfaces should be modeled in order to measure the thickness and quantify the myocardial perfusion within the LV wall from CT. The common choice to use a separate mesh for each surface is a redundant representation and cannot ensure that the endocardial mesh is always enclosed by the epicardial mesh.
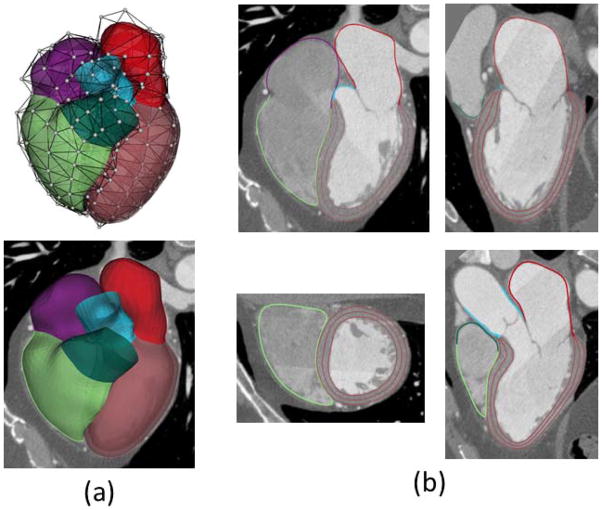
We propose to model the boundaries of the heart chambers and attached large vessels by subdivision surfaces using fewer control vertices, whereby the chamber wall is explicitly represented by the thicknesses associated with every vertex, as displayed in Fig. 1(a). More specifically, a loop subdivision scheme [42] is employed to model the mid-surface of a thick wall. Thickness of the wall is defined by interpolating the thickness using the same subdivision weights incorporated by the vertex coordinate calculation for the mid-surface. The inner and outer surfaces are implicitly defined by warping the mid-surface to half thickness inwards and outwards along the normal direction. The thickness is set to zero when it cannot be detected in the imaging data and when the 3 surfaces coincide. Compared to previous models based on dense triangular meshes, our heart model has three unique features: (1) smooth: The surface is C2 continuous everywhere except C1 continuous at a few extraordinary vertices; (2) concise: the inner and outer surfaces are dependently modeled as warped from mid-surfaces; (3) ease of interaction: The shape of both surfaces can be edited by moving any vertex in the base mesh of subdivision surfaces or modifying the thickness associated with each vertex. It should be noted that Loop subdivision is an approximating scheme (i.e., the vertices of the base mesh are generally not on the surface it defines). Alternative interpolating schemes (e.g., Butterfly [43]), may be used, of which the smoothness becomes C1 continuous. It is noted that certain cardiac structures (e.g., valves) are not modeled in our approach, but can be extended if necessary.
Fig. 1.
Heart modeling and segmentation. (a) Heart surfaces including four chambers and attached large vessels are modeled by subdivision surfaces, where white dots are control vertices. The LV wall is generated by warping the mid-surface using the thickness explicitly defined. (b) Segmented heart boundaries shown on the views of four chambers, left two chambers, two ventricles and left ventricular outflow tract. Three borders are used to divide the endocardium and epicardium for the LV wall.
Automated delineation of heart chambers and attached vessels are achieved by image segmentation based on supervised machine learning (e.g., Fig. 1[b]), developed and evaluated in our previous work [44]. Briefly, a classifier is trained using annotated data to automatically determine the optimal location and thickness associated with every vertex of the heart model. The heart model is first initialized by transforming a template model using key anatomic landmarks detected automatically. The classifier then searches the best in all possible modifications to the location and thickness in the normal direction for each vertex. After being standardized by a statistical model, the modifications are applied to the initialized model.
4.2 Coronary Artery Model
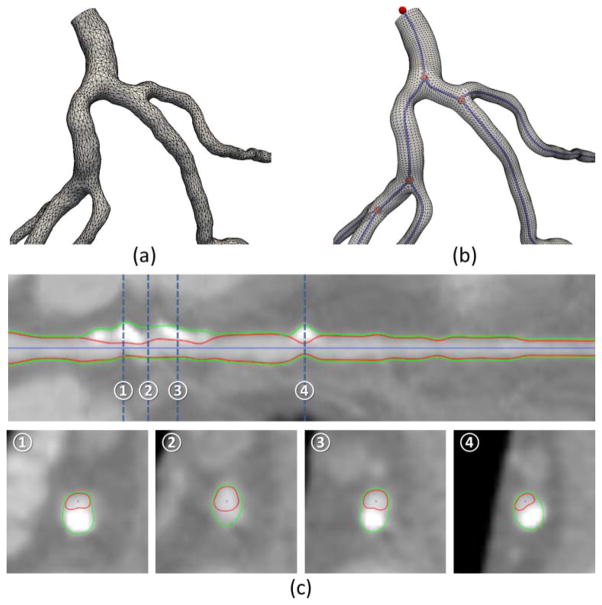
Centerlines are widely used to represent the path and connectivity of blood vessels including coronary arteries [45]. In order to characterize the geometry of the lumen boundary, diameters or cross sectional areas are combined with centerlines for the detection of whether any narrowing or stenosis is present. On the other hand, unstructured meshes (e.g., Fig. 2[a]) are also used to model vessel surfaces, especially for detailed modeling of vascular shape and for generating the fluid domain for computer simulations. Both approaches have limitations considering the tubular and complex shape of blood vessels. Centerlines with diameter information are inadequate to model vessels with asymmetric or noncircular cross sections. Although unstructured meshes are excellent for representation of complex surface details, it is challenging to handle queries for global topology and connectivity.
Fig. 2.
Coronary modeling and segmentation. (a) Geometric model of the coronary arteries with an unstructured mesh. (b) Geometric modeling of the same arteries by linking the centerlines with a structured mesh. The centerline endpoints and bifurcation points (shown in red) are connected by centerline edges (shown in blue). (c) Coronary segmentation shown on the straightened and cross sectional views.
By combining both representations, we propose to model coronary arteries by linking centerlines with structured surface meshes, as shown in Fig. 2(b). Our hybrid approach is not only capable of capturing complex vascular geometry with asymmetric or noncircular cross sections but is also able to support queries for each individual vessel and the connecting branches. By resampling a given centerline (twice of the CT spatial resolution), a list of uniformly distributed nodes is generated as centerline nodes, c1,···, cl, and a smoother centerline is obtained by finding a spline curve interpolating them. We define a local coordinate frame [t,u,v] at each node c using a rotation minimization technique, where t is along the tangent direction of the centerline and [u,v] spans a 2D plane on the cross-section. The lumen surface is modeled as a structured mesh by sweeping through the contours on the 2D planes. Each contour is implicitly defined using a list of lumen distances, d1,···dk, from c to the intersections on the lumen surface along k radial vectors sampled uniformly on the circumference. The diameter of a lumen contour is computed as the average of the lumen distances. Note the diameter is only longitudinally-varying, whereas lumen distances are both longitudinally-varying and circumferentially-varying. Besides the lumen, the outer wall of the coronary arteries may be defined similarly using a list of wall thicknesses, w1,···wk by extending the radial vectors and intersecting with the outer wall. To make the surfaces of the lumen and outer wall smooth, two types of interpolation-based refinements are used. The first is in the longitudinal direction by refining the centerline nodes and calculating corresponding lumen distances and wall thicknesses for the new nodes. The second is in the circumferential direction by refining the lumen distances and wall thicknesses.
The centerline is detected automatically by thinning and tracing in the enhanced image by modified vesselness filtering [46, 47]. If the detected centerline misses any branch or severely diseased vessel, the user can add new vessel segments to the centerline by manually selecting distal ends and automatically tracing to the detected centerline using the Dijkstra algorithm [48]. Our coronary artery model is suited for both interactive editing and automated modeling. To edit the model, the user may simply move any centerline node or drag the lumen and wall contours (Fig. 3) by modifying the lumen distances for lumen segmentation or wall thicknesses for wall (and plaque) segmentation. In the latter case, the centerline node should be re-centered as it may deviate from the true center of the lumen. Similar to the heart model, we have trained a classifier to generate a coronary model automatically. Briefly, the classifier searches for the optimal lumen distances and wall thicknesses (see Fig. 2[c]). As in the interactive editing, the centerline node should be re-centered after updating the lumen distances and wall thicknesses. If the centerline considerably deviates from the true lumen center, the steps of updating and recentering should iterate a few times until convergence is achieved. For vessels with complex patterns of plaques or significant levels of noise when the automated method generates unsatisfactory segmentation, the user can further revise the model using interactive editing. A detailed evaluation for the automated modeling of the coronary lumen and wall is currently under peer review with another journal.
Fig. 3.
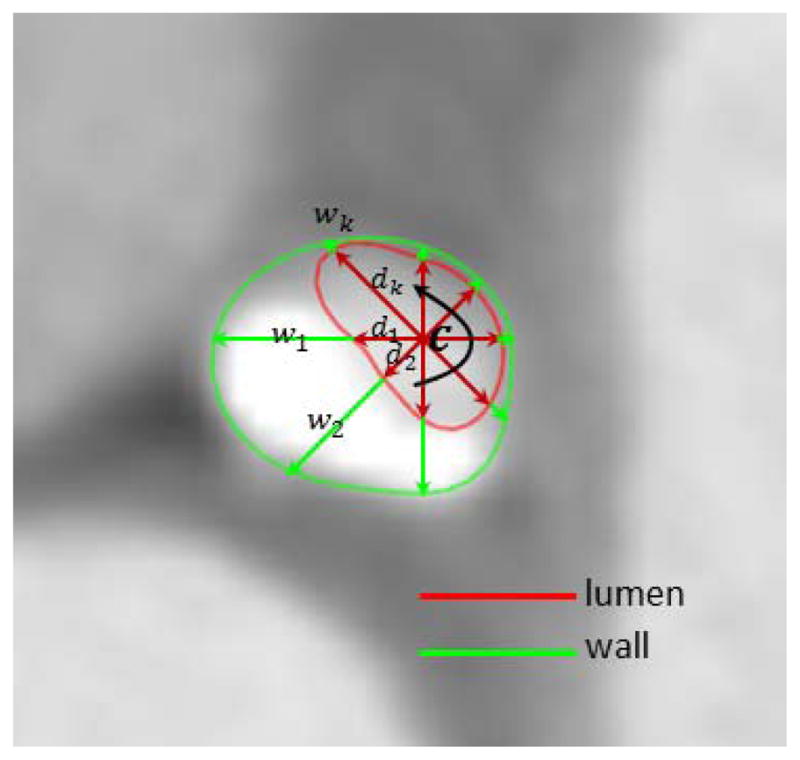
Implicit modeling of coronary lumen and wall contours by a list of radial vectors with lengths equal to lumen distances d1,···dk and wall thicknesses w1,···wk.
5 Visualization of the Heart and Coronary Artery Anatomy
Given the representation of our heart and coronary artery models, we introduce the techniques to visualize the heart and coronary artery anatomy from CT imaging both independently and simultaneously.
5.1 Heart Visualization
With accurate segmentation, the heart model can be used to examine the size and shape of cardiac structures using 3D surface rendering. Thanks to the labeling of different structures, it allows for hiding, making transparent, or applying different colors to certain structures (see Fig. 1[a]). The model is also used to generate contours, which delineate the boundaries of chambers and the attached large vessels on multiplanar reformatted images with standard short-axis, two-chamber long-axis, and four-chamber long-axis views (see Fig. 1[b]). The left ventricle is the most muscular chamber. To distinguish the LV endocardium and epicardium, three contours are used to delineate the endocardial, mid-myocardial, and epicardial borders. To this end, the endocardium and epicardium can be recognized by the region between endocardial and mid-myocardial borders, and between epicardial and mid-myocardial borders, respectively (see Fig. 1 [b]).
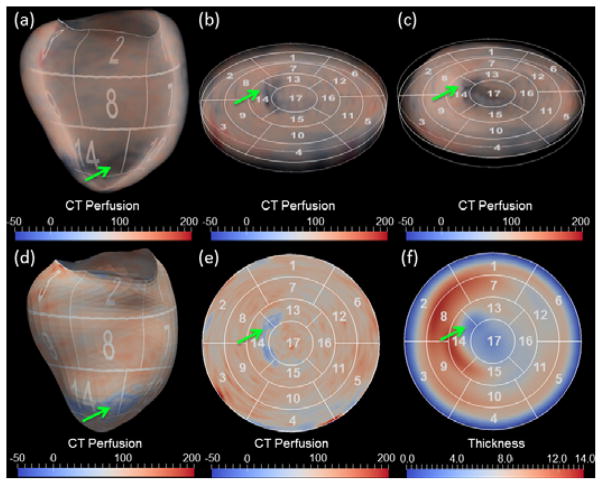
Using the LV segmentation, CT intensity information (as measured in Hounsfield units) within the LV region can be directly displayed by 3D volume (Fig. 4[a]) or surface rendering (Fig. 4[d]). Our framework also supports unfolding the 3D LV wall into a 2D flattened disk. The previous approaches to use cylindrical mapping and flat cutting of the 3D surfaces are unable to completely cover either the most basal region where the boundary is not flat, or the apical region where the surface becomes too flat to cut through [23]. In this work, we develop a new parameterization technique to flatten our heart model based on subdivision surfaces. We first manually assign unique u,v coordinates (along longitudinal and circumferential directions) to every control vertices in the base mesh. The coordinates for other newly generated vertices in the subdivision process are computed by a linear combination of the assigned u,v coordinates using the same weights to compute their 3D spatial coordinates. The mapping between the 3D coordinates to 2D u,v coordinates unfolds the 3D LV wall into a 2D disk. The LV unfolding allows for the construction of either 3D BEPs and volumetric rendering of the thick slab of image intensities on the polar map. The height of the slab may be reformatted to have a uniform (Fig. 4[b]) or absolute myocardial thickness (Fig. 4[c]). It also supports aggregating the image intensities to generate 2D BEP by averaging through the thickness as shown, for example, in Fig. 4 (e) and (f).
Fig. 4.
LV visualization using 3D volume rendering (top row) and 2D surface rendering (bottom row). In both cases, the LV is flattened from 3D (a, d) to 2D thick (b, c) or thin (e, f) slices in order to display the LV on the polar map. CT perfusion was rendered with uniform and absolute thickness in (b) and (c), respectively. The aggregated perfusion and thickness are shown in the (e) and (f), respectively. The green arrows point to the perfusion and myocardial thickness abnormalities.
5.2 Coronary Artery Visualization
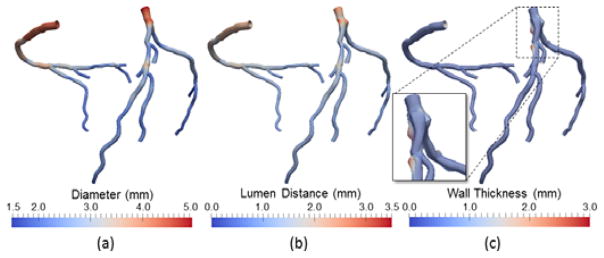
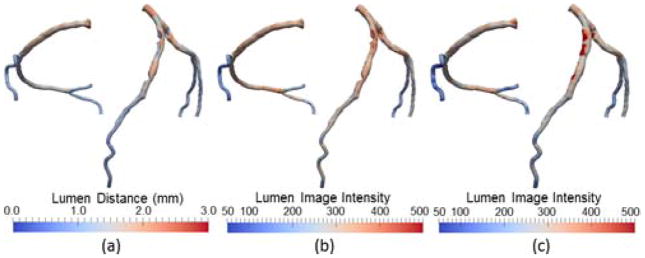
The coronary model is used to directly visualize coronary arteries. As shown in Fig. 5, the model supports rendering the 3D geometry of coronary arteries using different color coding: 1) circular cross-sections with diameter, colored by diameter; 2) noncircular cross-sections with lumen distance, colored by lumen distance; and 3) noncircular cross-sections overlaid with a transparent vessel wall, colored by wall thickness. The model also supports rendering properties related to image intensities on the 3D geometry. One example application is to reveal the image intensities within the lumen area, as an indication of transluminal attenuation gradient [49], which is defined as the attenuation of luminal contrast following the course of the artery and has been shown to be associated with stenosis severity. The average of image intensities in every cross-section within the lumen area is computed and shown in Fig. 6(b), from which the trend of attenuation manifested as the average intensity in the distal small vessels is lower than that in the proximal large vessels. Another example is to detect and distinguish calcified and non-calcified plaques in the vessel wall. The average of intensities in each radial direction within the lumen thickness is computed. Rendered on the 3D coronary geometry in Fig. 6(c), the spatial distribution of image intensities may provide visual cues in the localization and discrimination of plaque types.
Fig. 5.
Coronary artery visualization using (a) circular lumen cross-sections color-coded by diameter, (b) noncircular lumen cross-sections color-coded by lumen distance, (c) noncircular cross-sections and transparent vessel wall color-coded by wall thickness.
Fig. 6.
Coronary artery visualization using noncircular lumen cross-sections color-coded by (a) lumen distance, (b) lumen image intensity, (c) wall image intensity. Note that lumen distance (a) indicates the geometry of the coronary arteries or existence of any coronary stenosis, whereas image intensities shown in (b) and (c) indicates the contrast enhancement within the lumen and the wall, respectively. The high values of the latter are often caused by the calcifications.
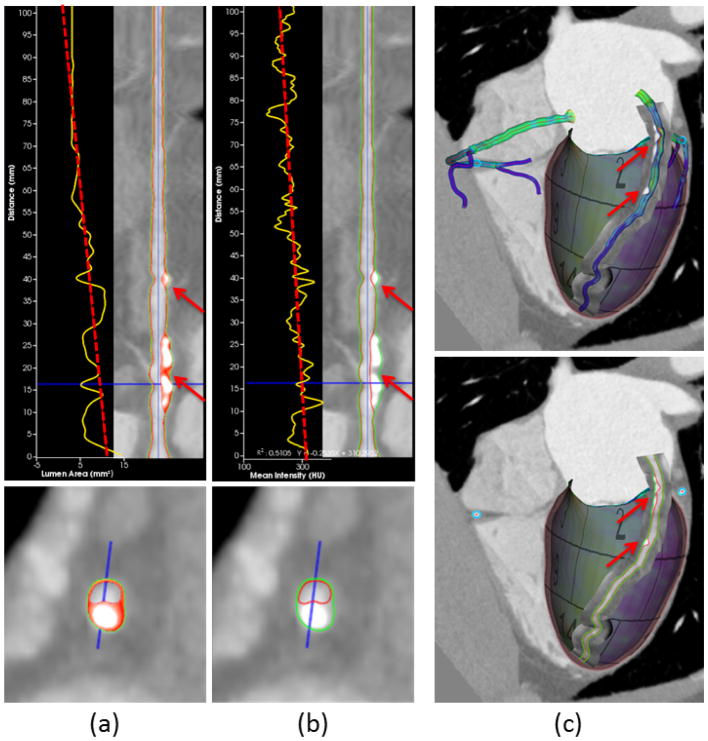
Curved reformatting is the standard way to visualize the morphology of tortuous coronary arteries [50]. Upon selection of a particular vessel segment, our coronary model supports rendering the borders of the lumen and vessel wall as two separate curves in both straightened and cross-sectional views. To help assess plaque burden (plaque extent and volume) and identify possible vulnerable plaques (i.e., unstable plaques, which are prone to produce major cardiac events) in the vessel wall, the cross-sections are classified as diseased if wall thickness is over 1/5 of the diameter [51]. In all diseased cross-sections, the vessel walls are further divided to be composed of necrotic core, fibrous fat, fibrosis, and calcification using predefined thresholds of <30, 30–130, 131–350, and >350 CT Hounsfield units [52], respectively, and assigned to different colors: yellow, orange, red, and white, accordingly (Fig. 7[a]). Considering these recommended thresholds may not be ideal for all imaging parameters [53], the user is allowed to overwrite them as necessary. We also provide plots of geometric and image intensity variations along the coronary centerline on the straightened views of the curved reformatting. One example in Fig. 7(a) shows the tapering of the lumen area, while the other example in Fig. 7(b) shows the mean intensity over cross-sections, as commonly known as the transluminal attenuation gradient [49]. While curved reformatting simplifies examination of the lumen and vessel wall by unraveling coronary arteries in 2D, their appearance in 3D is missing. Therefore, we provide an alternative means to visualize the coronary arteries by directly reformatting the image intensities in the neighborhood onto a 3D curved surface along the centerline, which is referred to as 3D curved reformatting as illustrated in Fig. 7(c). Synchronized with 2D curved formatting, the curved surface is scrolled around the centerline in different angles. The border curves and color-coded plaque composition are rendered on the curved surface.
Fig. 7.
Curved reformatting of coronary arteries. (a) The plot of lumen area versus the distance along the centerline (yellow curve) with least squares fitting (red dashed line). Color overlay on the vessel wall depicts the composition of different plaque types. (b) The plot of mean intensity shows transluminal attenuation gradient [49] from proximal to distal. (c) Direct curve reformatting in 3D with surface models and delineated borders of coronary arteries. The red arrows in all subfigures point to the calcified and noncalcified plaques in the vessel wall.
5.3 Simultaneous Visualization of the Heart and Coronary Arteries
To illustrate the anatomic and functional relationship between the heart muscle and coronary arteries, we combine the aforementioned techniques and provide two simultaneous visualization modes. They are intended for conveying the complete picture of cardiac anatomy and physiology in a comprehensive manner.
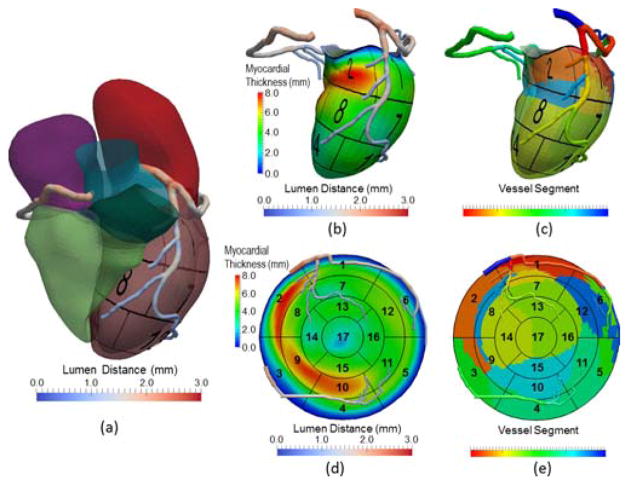
In 3D mode, the model of coronary arteries is overlaid on the surface of the four-chamber heart model (Fig. 8[a]) or LV model alone (Fig. 8[b] and [c]). The overlay permits the evaluation of spatial and geometric features for coronary arteries with reference to the myocardium (e.g., unique anatomy and distribution), the presence and location of focal or diffuse disease in any coronary artery, and the coronary dominance, or the correlation of coronary and myocardial diseases. In particular, the myocardium may be divided into three regions according to blood flow supply from the vessel segments belonging to left anterior descending (LAD), left circumflex (LCX), or right coronary (RCA) arteries by projecting the centerlines on the myocardial surface and partitioning the surface by Voronoi diagram using centerline nodes as seeds (Fig. 8[d] and [e]). As a first order approximation, our assumption of using a Voronoi diagram is that each artery subtends the closest regional myocardial bed.
Fig. 8.
Visualization of coronary arteries with (a) four-chamber heart and the 3D left ventricle displaying (b) myocardial thickness (c) partitioned myocardial regions by closest distance to vessel segments, as well as flattened coronary arteries displaying the same information (d) and (e) on the 2D BEP, respectively. In (c), a vessel segment is defined by a vessel branch that is between bifurcations or between a bifurcation and an endpoint.
In 2D mode, the coronary arteries are displayed on top of BEP. Given the projected centerlines on the myocardial surface, all centerline nodes obtain u,v coordinates from the heart model and are mapped to the corresponding positions in BEP. In this process, the properties associated with the coronary models (e.g., diameters), are maintained in order to reconstruct the 2D coronary model flattened on the BEP. Similar to the 3D mode, many combinations of color-coded properties are possible. One example is to display the lumen distances on the 2D coronary model and the myocardial thickness on the BEP to identify the potential cause of myocardial wall thinning by high-grade stenosis.
6 Visualization of Heart Function
Much information of heart function can be inferred from myocardial motion. Several algorithms proposed [30, 54, 55] have been successfully applied to construct spatiotemporal heart models and extract global function parameters (e.g., stroke volume, ejection fraction) from 4D CT imaging data. However, the approach to how we should visualize such complex motion has received less attention. The most common way in clinical practice is to qualitatively animate the 2D border contours or 3D surface models with multiplanar reformatted image slices, which does not quantify regional wall motion and thickening of the myocardium. However, it has been shown that the complex and fast changes in regional myocardial deformation cannot be reliably assessed qualitatively and visually [56].
The quantitative measurement of regional deformation and motion is an alternative, as it was confirmed that the segmental deformation is closely linked to contractility for normal myocardium, and the regional changes in deformation can be induced by ischemia [57]. Using our heart model and 4D image registration, we propose a new method to compute and visualize quantitative measures of local deformation, particularly strain. Recall that our heart model is represented with a mid-surface and implicitly defined thickness. Inspired by shell theory in mechanics [58, 59], kinematic quantities (e.g., displacement) and strain are well defined without resort to the full 3D continuum mechanics. The geometry in one frame of the 4D data is selected as the reference configuration and those of all other frames are treated as deformed configurations. In the reference frame, the position vector of a point in the shell is:
| (1) |
where ξ1 and ξ2 are local parameterizations of the mid-surface in the reference configuration. ζ ∈ [−1,1] is a parameter defining the relative deviation from the center point Ψ on the mid-surface along the thickness H. G is the director vector, which is normal to the mid-surface and ||G|| = 1. From Eq. (1), a local curvilinear coordinate system is defined by the base vectors as:
| (2) |
The position vector in a deformed frame is:
| (3) |
where the variables are defined similarly as in the reference configuration, with the exception that lower cases reflect the deformed configuration. Notice g will generally not be normal to the mid-surface, although ||g|| = 1. The base vectors is then:
| (4) |
The Green–Lagrange strain can be then computed as:
| (5) |
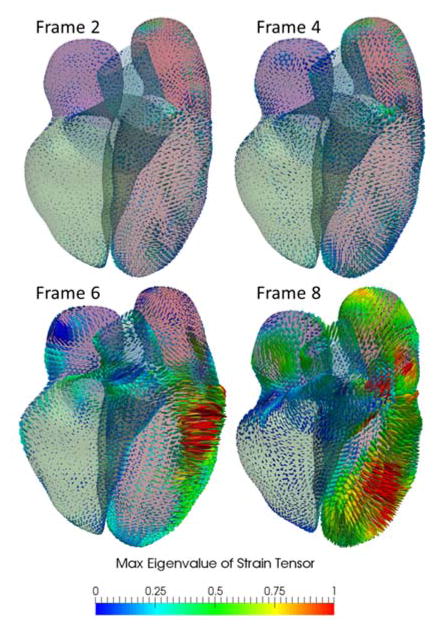
With respect to the global Cartesian coordinate system with orthogonal basis vectors, ê1, ê2 and ê3 = G, satisfying ê1 ⊥ ê2, ê1 × ê2 = ê3 the strain Êij can be computed by rotating gi and Gj using the transformation matrix, whose columns are the coordinates of the curvilinear base vectors expressed in the Cartesian coordinate system. In Fig. 9, Êij are computed from a 4D CT dataset, which consists of 10 frames. The strain tensors are shown as ellipsoids of semi-axis lengths scaled by the eigenvalues and oriented by the eigenvectors. The ellipsoids are color-coded by the max eigenvalues. It should be noted that the number of frames represents the typical temporal resolution of CT. Under this frame rate, myocardial motion is more reliable in diastolic phases than in the systolic phases because there are higher noises and motion artifacts in the latter.
Fig. 9.
Visualization of heart motion and deformation on 3D myocardial surface. The Green-Lagrange strain tensor is calculated for all ten frames from 4D CT data, from which the geometry in the first frame is used as the reference configuration. The color-coded max eigenvalue of the strain tensor were shown in four sample frames from an animation sequence.
7 Visualization of Myocardial Perfusion
Beyond evaluation of cardiac anatomy and function, CT imaging has recently been demonstrated as a promising tool to provide valuable physiologic information to assess myocardial blood flow or perfusion [60–62]. Typical CT perfusion imaging involves both resting and induced stress states [63]. Surprisingly, we have discovered that even perfusion measurements using CT attenuation from standard acquired coronary CTA images has reasonable ability to predict severe coronary stenosis as confirmed by invasive angiography [44]. Therefore, CT holds great promise to become a “one-stop-shop” modality to allow for visualization of myocardial perfusion, cardiac function, and coronary anatomy, without the need for additional imaging sessions or medications. It also enables a two-way confirmative diagnosis of cardiac ischemia by identifying which coronary stenosis causes a particular perfusion defect or motion abnormality, as well as checking whether a coronary stenosis leads to any perfusion defect or motion abnormality.
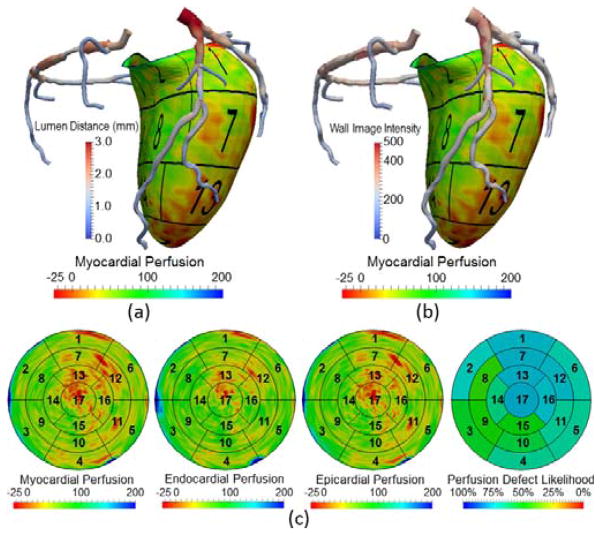
Using the close relationship between CT attenuation and concentration of contrast agents, our heart model and LV unfolding technique allow for computing the myocardial perfusion as well as displaying them using a color-coded map in both 3D surface view and 2D BEP (Fig. 10). The visualization of myocardial perfusion is combined with the ability to simultaneously visualize color-coded coronary luminal geometry and vessel wall composition. One advantage of our framework is that all data used for visualization are extracted directly from CT so that no fusion with other modality is necessary. In addition, because our framework is currently targeted for extracting perfusion information from standard acquired coronary CTA, registration between CTA with other CT perfusion images are not necessary. Although rendering of color-coded perfusion on 3D surface and 2D BEP is useful, there are two limitations that should be emphasized. First, it only allows for qualitative analysis, as CT attenuation is an indirect and relative measure of perfusion. Second, it may mislead diagnosis because absolute perfusion inherently varies among territories of the myocardium, particularly when considering the differences in metabolic demand and disease states. We have proposed a probabilistic approach to compute the likelihood of perfusion within a myocardial segment being deficient, by comparing it with the value corresponding to the same segment in a database of normal subjects [44]. Note that we performed a segment-by-segment comparison instead of using a global cutoff as we, along with others, previously observed a large variation between the segments in healthy individuals [44, 65]. Mathematically, the likelihood is defined as the proportion of subjects who have higher perfusion in the same segment. We plot the computed likelihoods of all 17 segments in 2D BEP and report the perfusion value and its location in the distribution of normal perfusion upon a particular segment that has been selected.
Fig. 10.
Visualization of CT perfusion on 3D myocardial surface and 2D BEP. The coronary arteries with of (a) lumen distances and (b) wall image intensity are overlaid to show the information of luminal geometry and vessel wall composition (e.g. calcification). (c) Absolute CT Perfusion in the myocardial, endocardial, and epicardial walls, as well as the likelihood of segmental perfusion defects by relative ranking in the database of normal subjects are displayed. Note that the rainbow color map for displaying myocardial perfusion can be replaced by other maps that may be more appropriate [64].
8 Visualization of Simulated Coronary Hemodynamics
Computer simulations by applying CFD to CT angiography images have proven to be valuable for characterizing realistic hemodynamics of 3D patient-specific coronary vascular beds [66]. From simulation, the user can not only obtain blood pressure and velocity as primary solution variables, but also can derive other useful hemodynamic factors (e.g., stresses). It fills the gap of lacking vessel-specific physiologic assessment in currently available noninvasive imaging techniques. Due to immense simulation data generated by computer simulations, effective visual exploration is important to obtain conceivable insights from the simulated coronary hemodynamics. In order to take full advantage of computer simulations in the diagnosis and potential risk prediction of coronary artery disease, it is also critical to target the visualization tasks and contents into relevant clinical applications. In this paper, we consider three scenarios: (1) assessment of the physiologic significance of coronary stenosis by combing pressure-derived fractional flow reserve and image-based myocardial perfusion; (2) evaluation of the blood flow patterns in the vicinity of coronary stenoses; and (3) quantification of the shear stress and total traction applied on the wall by the blood flow.
8.1 Simultaneous Visualization of Fractional Flow Reserve and Myocardial Perfusion
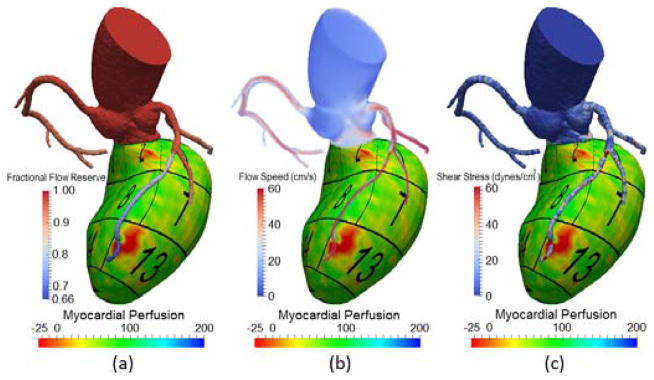
Fractional flow reserve (FFR) is recognized as a gold standard to diagnose myocardial ischemia [67]. It is a physiologic measure and calculated as the pressure distal to a lesion in the coronary artery, divided by the aortic pressure. Although FFR is typically measured invasively by inserting pressure sensors in the target artery, it can be derived from computer simulations noninvasively and computed anywhere in the coronary artery [13]. Our framework allows for the rendering of color-coded FFR on the 3D surface model. Compared to anatomic evaluation of coronary luminal geometry, the goal is to enable the identification of focal flow-limiting lesions from the FFR color map, as typically manifested as noticeable pressure drops. For more challenging diffuse diseases, it is also feasible to assess the integral effect of several lesions in series. While the FFR map alone is useful to identify physiologically significant lesions, the diagnosis would be more specific and meaningful by knowing the affected myocardial region subtended by a particular coronary lesion, as well as examining whether any perfusion abnormality exists in that region. We therefore support simultaneous evaluation of hemodynamics in the coronary arteries and the myocardium by overlaying the FFR map on top of the perfusion map, as shown in Fig. 11(a). Additional information obtained from the simulation, including the speed of blood flow and the magnitude of the shear stress on the vessel wall, are also displayed.
Fig. 11.
Visualization of CT myocardial perfusion with simulated (a) fractional flow reserve, (b) the speed of blood flow, and (c) the magnitude of shear stress on the vessel wall.
8.2 Display of Blood Flow Patterns
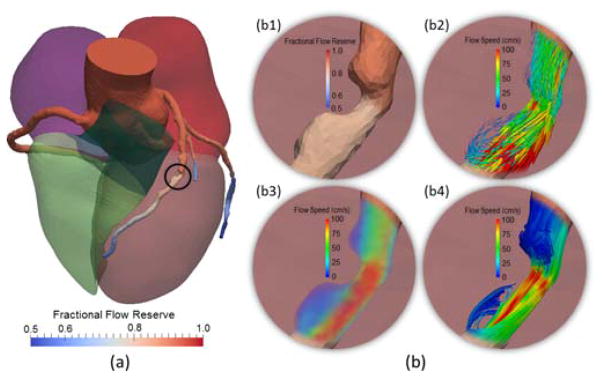
Adverse blood flow patterns have been attributed to play an important role in coronary atherosclerosis [68]. By default, the framework provides a global overview of hemodynamics in the whole coronary tree with the four-chamber heart model, shown in Fig. 12(a). To avoid visual clutter, focus is directed for closer examination to a particular circular region of interest by limiting the rendering of the flow patterns only within the region and blending it with the FFR map in the background. From the simulated velocities, three techniques of rendering flow patterns are supported (see Fig. 12[b]), and each is intended to convey one facet of flow complexity. Choice of a particular technique should depend on whether and how flow direction and magnitude are visualized.
Fig. 12.
Display of simulated blood flow patterns. (a) Visualization of FFR within the context of the four-chamber heart model; (b) Closer view of FFR (b1) and the complex flow patterns across the stenosis (inside the black circle) using glyph vectors (b2), volume rendering (b3), and streamlines (b4).
Glyph vectors (Fig. 12 [b2]): In the focus area, the glyph vectors are displayed at uniformly sampled vertices of the computer simulated mesh as 3D arrows, which orient in the directions of velocities and have scales and color codes reflecting the flow speed. One advantage of using glyphs is due to its precise depiction of both the magnitude and direction of the flow field. However, visual clutters and occlusions may arise to retain sufficient sampling density and volume coverage.
Volume rendering (Fig. 12 [b3]): The field of flow speed is also rendered as a 3D volume with a transfer function designed to map the range of the flow speed using a default rainbow and transparent-to-opaque color table. The user may choose other color tables. Despite the lack of direction information, volume rendering minimizes visual clutter and occlusions, and provides a closer perception of natural flow phenomenon.
Streamlines (Fig. 12 [b4]): Seeded with the vertices on a cutting plane close to the ostium, the flow trajectories are depicted with widely-used streamline curves, which are color-coded with the flow speed. As streamlines convey both the direction and magnitude of a fluid element traveling in the flow field, complex flow features can be directly visualized, such as the flow separation and reversal.
8.3 Visualization of Shear Stress and Traction on the Vessel Wall
Hemodynamic forces on the wall of coronary arteries have been shown to be associated with plaque formation and rupture [11]. The simulated blood flow allows for calculation and visualization of patient-specific shear stress and total traction as biomechanical factors of plaque burden. The common method to visualize shear stress is to render a color-coded map of the magnitude on the surface of the vessel wall (e.g., Fig. 11[c]). Although this approach is effective towards facilitating the illustration of the complex non-uniform distribution of shear stress, three drawbacks are observed: (1) it is difficult to assess the whole distribution of shear stress patterns on the vessel wall due to occlusion; (2) contextual imaging features of wall composition are missing; and (3) the relative scale between total traction and shear stress applied on the wall is not clear.
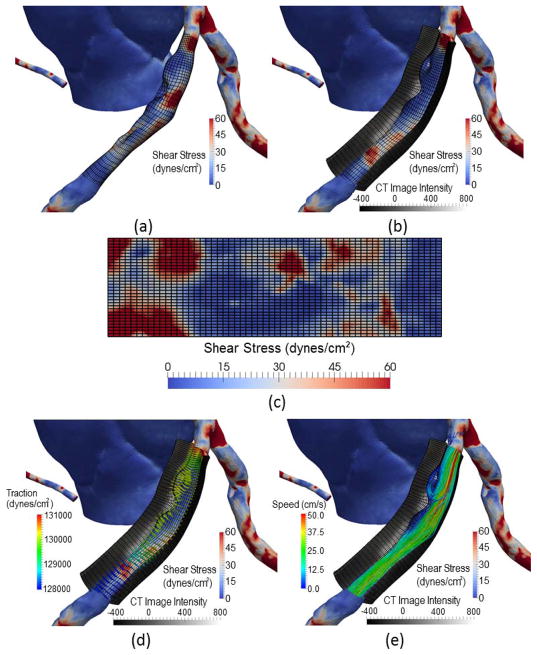
We propose a new visualization method to overcome these limitations. Using our coronary model, a quadrilateral grid span in circumferential and longitudinal directions (Fig. 13[a]) is constructed along the centerline of an artery segment, which serves as the reference for visualization of the shear stress map and can also be used to flatten the map on a 2D plane (Fig. 13[c]). Then, a thick tubular shell structure is constructed by considering the thickness of the vessel wall (Fig. 13[b]). Two end caps of the shell are created at the beginning and end points on the centerline, which are initially specified by the user. The inner layer of the shell is rendered with the color-coded distribution of the magnitude of shear stress or total traction. The outer layer and end caps are rendered with the image intensities. Two types of user interactions are supported in order to be able to visualize the wall composition and shear stress anywhere in the shell structure: (1) the end caps can slide by specifying the beginning and end points of the centerline; and (2) a fan-shaped partial shell may be created to display the longitudinal distribution of image intensities by limiting the start and end angles in the circumference. To show the direction of traction on the vessel wall, glyph vectors are displayed with a scale according to the magnitude (Fig. 13[d]). In order to eliminate the occlusions by the shell structure, glyph arrows are drawn with the ends pointing to the inner layer and their bodies placed inside the lumen area. The glyph arrows are color-coded based on the magnitude of traction. Finally, the lumen area may be filled with the streamlines to show the blood flow pattern (Fig. 13[e]).
Fig. 13.
Visualization of simulated shear stress with the image features on the wall: (a) The distribution of shear stress with a quadrilateral grid with circumferential and longitudinal directions; (b) Image intensities in the arterial wall on a fan-shaped partial shell by sampling in radial directions; (c) The flattening of shear distribution on a 2D plane; (d) the total traction of the blood flow on the vessel wall as glyph vectors; (e) The streamlined blood flow patterns in the lumen.
9 Implementation and Evaluation
All described visualization techniques of our framework were implemented in C++, supported by OpenGL, GLSL, and the Visualization Toolkit (VTK) and can be performed at interactive rates on a mid-class desktop workstation (Intel Xeon E5-2620 2.0GHz, 32GB RAM, Nvidia Quadro K2000). The preprocessing time for building the four-chamber heart models, coronary artery models, and coronary blood flow simulation were 10–30 seconds, 30–75 seconds, and 10–30 minutes, respectively, depending on the resolution of the dataset. The data tested in this paper were acquired using standard coronary CTA protocol on either Siemens Definition or GE Discovery scanners. Image volumes may contain 153–357 slices of identically 512×512 pixels with isotropic in-slice resolution ranging from 0.28 to 0.49 mm and slice thickness from 0.30 to 0.63 mm.
Two cardiologists, who were specialized in cardiovascular imaging, provided expert feedback after using our system. They viewed our approach as potentially useful to supplement their currently available techniques, but also commented on some drawbacks. Below, we summarize their feedback in terms of the advantages, along with their suggestions for improvement.
9.1 Advantages
One advantage highly valued by the experts was the novelty of support for integrated visualization of both CT imaging and simulation data (e.g., displaying the CT myocardial perfusion with simulated fractional flow reserve), and the imaging characteristics of plaque with the simulated shear stress applied on the plaque. They noted that the feature of relating the severity of coronary stenosis causing perfusion abnormality as well as identification of biomechanically vulnerable plaques possibly resulting in acute myocardial infarction is of great importance for the diagnosis of coronary artery disease. They did anticipate incremental benefits led by the integration of imaging and simulation, though which, should be carefully evaluated through further clinical studies.
The experts appreciated the ability to visualize the four-chamber heart with labeled AHA 17 segments, overlaid by the coronary anatomy in 3D, and agreed it is more straightforward to determine the coronary dominance in 3D view than on the 2D slice, especially for medical students or fellows. By extending the standard straightened view, they noted that direct curve reformatting of coronary arteries is useful to evaluate the lumen and the vessel wall without loss of the curved shape of the blood vessels.
One expert also showed interest in the strain computed from 4D CT data. Although it was not straightforward to understand the meaning of the color ellipsoids at first glance, the experts indicated that strain may serve as a new metric based on mechanical principles to quantify the ventricular dyssynchrony in patient selection for cardiac resynchronization therapy [69].
Finally, because our visualizations represented a new and intuitive way of illustrating cardiac anatomy and function, the experts actually started using these images in their publications and presentations. One example can be found elsewhere [6].
9.2 Suggestions for Improvement
A drawback of our method was the need for manual correction when automatic segmentation failed to generate satisfactory results. Interestingly, the experts did not claim for a fully automated segmentation approach but generally tolerate about 20 minutes of processing time. Instead, they preferred methods allowing them to interact and apply their medical expertise to adapt the segmentation. Our future work will focus on improving the segmentation robustness and accuracy through machine learning, as well as developing new intuitive editing tools, which will facilitate modifying the segmented models of the heart and coronary arteries.
One expert remarked that the thick volume rendering and 2D surface rendering of CT myocardial perfusion data would be more helpful if the left ventricle could be unfolded along the long axis and used to depict the perfusion map on a flattened rectangle.
One expert was also concerned that the surface rendering of the coronary lumen and wall image intensities was confusing, as it does not reflect the conventional way. Our original goal was to display transluminal attenuation gradients and vulnerable plaques without resorting to the use of cutting planes. We plan to integrate this feature with the rendering of lumen and wall features with image intensities depicted on the fan-shaped shell.
In clinical routine and medical research, quantitative analysis is often preferred to qualitative evaluation, although the scope of our current study was focused on the development of visualization techniques. Therefore, we conveyed most quantitative information via color-coding. One expert suggested that it would be even more useful if visualization was linked closely with quantitative plots of parameters (e.g., flow rate, or ejection fractions) when possible.
Finally, both experts were interested in how different CT acquisition parameters affected the results of our integrated visualization tools. For example, the variations in CT Hounsfield units at different tube voltage, type of iterative reconstructions, intravenous contrast agent density, and radiation dose would have an impact on the classification of plaque types and interpretation of transluminal attenuation gradient using predefined thresholds.
10 Discussion and Conclusion
We have presented a new visualization framework for computer-aided diagnosis of heart framework. It consisted of modeling and visualization techniques to allow for a comprehensive evaluation of anatomy and physiology for ischemic heart disease from CT imaging and CFD simulation.
The four heart chambers, as well as the attached aorta and pulmonary arteries were modeled as subdivision surfaces and automatically segmented from CT images. The lumen and vessel wall of the coronary arteries were implicitly modeled by lumen distances and wall thicknesses, which were automatically determined. The heart function or motion was tracked by deforming the four-chamber heart model using image registration of 4D CT images. The Green-Lagrange strain tensor of the myocardial tissue in each phase of the 4D motion model was calculated by setting a selected phase as the reference. In addition, our framework also supported the quantification and visualization of myocardial perfusion information from standard coronary CT angiography. The LV was divided according to AHA 17-segment model and the perfusion was computed in each segment and displayed in both 3D surface models and 2D BEPs, which were overlaid with the coronary geometry. Finally, our framework allowed for visualizing the patient-specific coronary hemodynamics. The simulated blood velocity, pressure, as well as shear stress and total traction forces on the vessel wall were displayed with both the anatomic context of segmented heart models and the physiologic context of myocardial perfusion.
Although many types of visualization were provided in our framework, we do not expect all of them to be used in the clinical setting. The user may select the most relevant set of features for a specific disease, therefore saving time to prepare data (e.g., computer simulations) while also grasping visualization information. Another possibility moving forward may be to build statistical models by summarizing conditions obtained from all sources for computer-aided diagnosis. In addition, our current framework does not support the close integrated visualization of myocardial deformation with coronary anatomy and hemodynamics. We believe adding this feature may help to identify the abnormal motion caused by a coronary stenosis, or to elucidate the dynamic environment in which a plaque is experienced.
We believe certain features can support MRI data, especially when visualizing perfusion and functional data. Because imaging coronary anatomy by MRI is under active development and has not reached the reliability and spatial resolution offered by CT [70], segmentation and computer simulations using MRI data is currently limited.
Overall, the independent cardiologists provided us with positive feedback, and we intend to address their recommendations for improvement in our future work. Due to the scope of the current research, however, clinical evaluation is currently limited. Nevertheless, a more thorough case study with experts from multiple centers will be performed in the near future to investigate whether the proposed features of visualization actually improve diagnosis of ischemic heart disease. Finally, we aim to expand our framework towards a comprehensive and “one-stop shop” for visualizing cardiac anatomy and physiology from CT imaging and computer simulation.
Acknowledgments
The authors would like to thank Dr. Fehmi Cirak from University of Cambridge for valuable discussions on strain computation, and Anna Starikov for proofreading the manuscript. This work was supported in part by NIH grants #7R01HL111141, #1R01HL118019 and #UL1TR000457.
Biographies

Guanglei Xiong received his PhD degree in biomedical informatics and mechanical engineering from Stanford University in 2011. He was a research scientist at Siemens Corporate Research from 2011 to 2013. He is currently an assistant professor of biomedical engineering in the Department of Radiology and Dalio Institute of Cardiovascular Imaging, Weill Cornell Medical College, New York, NY. His research interests are medical image analysis and visualization, cardiovascular biomechanics and bioengineering.

Peng Sun received the PhD degree from Department of Automation at Tsinghua University, Beijing, China in 2014. From 2014 to 2015, he worked as a postdoctoral researcher at Dalio Institute of Cardiovascular Imaging, Weill Cornell Medical College, New York, NY. He is currently a postdoctoral researcher at Department of Statistics and Biostatistics, Rutgers University. His interests include machine learning and its application in computer vision and medical image processing.

Haoyin Zhou received the Ph.D. degree from Department of Automation at Tsinghua University, Beijing, China, in 2014. He is currently a postdoctoral researcher at Dalio Institute of Cardiovascular Imaging, Weill Cornell Medical College, New York, NY. His research interests include structure from motion and medical image processing.

Seongmin Ha received the BS degree in control and measurement engineering from the Hankuk University of Foreign Studies, Seoul, Korea, in 2014. He worked at Integrative Cardiovascular Imaging Research Center in Yonsei University and Toshiba Medical Systems Korea, in 2011 and 2014. He is currently a researcher at Dalio Institute of Cardiovascular Imaging, Weill Cornell Medical College, New York, NY. His research interests include image processing, visualization, cardiac imaging.

Bríain ó Hartaigh received his PhD degree from the Department of Public Health, Epidemiology & Biostatistics at the University of Birmingham, UK in 2012. From 2012 to 2014, he worked as a Postdoctoral Researcher at the Section of Geriatrics, Yale University School of Medicine, New Haven, CT. He is currently Assistant Researcher Professor of Epidemiology in Radiology at the Dalio Institute of Cardiovascular Imaging, Weill Cornell Medical College, New York, NY. His interests include exploring the interplay between resting heart rate and other modifiable cardiac risk factors, and developing applied statistical models for prediction of cardiovascular risk.

Quynh A. Truong received her MD degree from the Albert Einstein College of Medicine, Bronx, New York in 1999. From 2011 to 2014, she was assistant professor of Medicine at Massachusetts General Hospital and Harvard Medical School. She is a board-certified cardiol-ogist specializing in cardiac imaging and currently assistant professor of radiology at Weill Cornell Medical College, New York, NY. Her research interests include developing novel use of cardiac CT in heart failure and ischemic heart disease.

James K. Min received his MD degree from Temple University School of Medicine in 1999. From 2005 to 2011, He was an assistant professor of medicine and radiology at Weill Cornell Medical College, New York, NY. From 2011 to 2013, He was an associate professor of biomedical sciences and medicine at Cedars-Sinai Medical Center, Los Angeles, CA. He is currently a professor of radiology and medicine and the director of Dalio Institute of Cardiovascular Imaging at Weill Cornell Medical College, New York, NY. His research interests in cardiovascular imaging, interventions, and clinical trials.
References
- 1.Nabel EG, Braunwald E. A tale of coronary artery disease and myocardial infarction. N Engl J Med. 2012 Jan 5;366:54–63. doi: 10.1056/NEJMra1112570. [DOI] [PubMed] [Google Scholar]
- 2.Ambrose JA, Tannenbaum MA, Alexopoulos D, Hjemdahl-Monsen CE, Leavy J, Weiss M, et al. Angiographic progression of coronary artery disease and the development of myocardial infarction. J Am Coll Cardiol. 1988 Jul;12:56–62. doi: 10.1016/0735-1097(88)90356-7. [DOI] [PubMed] [Google Scholar]
- 3.Vancraeynest D, Pasquet A, Roelants V, Gerber BL, Vanoverschelde JL. Imaging the vulnerable plaque. J Am Coll Cardiol. 2011 May 17;57:1961–79. doi: 10.1016/j.jacc.2011.02.018. [DOI] [PubMed] [Google Scholar]
- 4.Min JK, Shaw LJ, Berman DS. The present state of coronary computed tomography angiography a process in evolution. J Am Coll Cardiol. 2010 Mar 9;55:957–65. doi: 10.1016/j.jacc.2009.08.087. [DOI] [PubMed] [Google Scholar]
- 5.Maurovich-Horvat P, Ferencik M, Voros S, Merkely B, Hoffmann U. Comprehensive plaque assessment by coronary CT angiography. Nat Rev Cardiol. 2014 Jul;11:390–402. doi: 10.1038/nrcardio.2014.60. [DOI] [PubMed] [Google Scholar]
- 6.Rizvi A, Deano RC, Bachman DP, Xiong G, Min JK, Truong QA. Analysis of ventricular function by CT. J Cardiovasc Comput Tomogr. 2015 Jan-Feb;9:1–12. doi: 10.1016/j.jcct.2014.11.007. [DOI] [PMC free article] [PubMed] [Google Scholar]
- 7.Cury RC, Nieman K, Shapiro MD, Nasir K, Cury RC, Brady TJ. Comprehensive cardiac CT study: evaluation of coronary arteries, left ventricular function, and myocardial perfusion--is it possible? J Nucl Cardiol. 2007 Apr;14:229–43. doi: 10.1016/j.nuclcard.2007.01.035. [DOI] [PubMed] [Google Scholar]
- 8.Achenbach S, Goroll T, Seltmann M, Pflederer T, Anders K, Ropers D, et al. Detection of coronary artery stenoses by low-dose, prospectively ECG-triggered, high-pitch spiral coronary CT angiography. JACC Cardiovasc Imaging. 2011 Apr;4:328–37. doi: 10.1016/j.jcmg.2011.01.012. [DOI] [PubMed] [Google Scholar]
- 9.Beller GA, Ragosta M. Decision making in multivessel coronary disease: the need for physiological lesion assessment. JACC Cardiovasc Interv. 2010 Mar;3:315–7. doi: 10.1016/j.jcin.2010.01.007. [DOI] [PubMed] [Google Scholar]
- 10.Meijboom WB, Van Mieghem CA, van Pelt N, Weustink A, Pugliese F, Mollet NR, et al. Comprehensive assessment of coronary artery stenoses: computed tomography coronary angiography versus conventional coronary angiography and correlation with fractional flow reserve in patients with stable angina. J Am Coll Cardiol. 2008 Aug 19;52:636–43. doi: 10.1016/j.jacc.2008.05.024. [DOI] [PubMed] [Google Scholar]
- 11.Malek AM, Alper SL, Izumo S. Hemodynamic shear stress and its role in atherosclerosis. JAMA. 1999 Dec 1;282:2035–42. doi: 10.1001/jama.282.21.2035. [DOI] [PubMed] [Google Scholar]
- 12.Kim HJ, Vignon-Clementel IE, Coogan JS, Figueroa CA, Jansen KE, Taylor CA. Patient-specific modeling of blood flow and pressure in human coronary arteries. Ann Biomed Eng. 2010 Oct;38:3195–209. doi: 10.1007/s10439-010-0083-6. [DOI] [PubMed] [Google Scholar]
- 13.Taylor CA, Fonte TA, Min JK. Computational fluid dynamics applied to cardiac computed tomography for noninvasive quantification of fractional flow reserve: scientific basis. J Am Coll Cardiol. 2013 Jun 4;61:2233–41. doi: 10.1016/j.jacc.2012.11.083. [DOI] [PubMed] [Google Scholar]
- 14.Koo BK, Erglis A, Doh JH, Daniels DV, Jegere S, Kim HS, et al. Diagnosis of ischemia-causing coronary stenoses by noninvasive fractional flow reserve computed from coronary computed tomographic angiograms. Results from the prospective multicenter DISCOVER-FLOW (Diagnosis of Ischemia-Causing Stenoses Obtained Via Noninvasive Fractional Flow Reserve) study. J Am Coll Cardiol. 2011 Nov 1;58:1989–97. doi: 10.1016/j.jacc.2011.06.066. [DOI] [PubMed] [Google Scholar]
- 15.Min JK, Leipsic J, Pencina MJ, Berman DS, Koo BK, van Mieghem C, et al. Diagnostic accuracy of fractional flow reserve from anatomic CT angiography. JAMA. 2012 Sep 26;308:1237–45. doi: 10.1001/2012.jama.11274. [DOI] [PMC free article] [PubMed] [Google Scholar]
- 16.Norgaard BL, Leipsic J, Gaur S, Seneviratne S, Ko BS, Ito H, et al. Diagnostic performance of noninvasive fractional flow reserve derived from coronary computed tomography angiography in suspected coronary artery disease: the NXT trial (Analysis of Coronary Blood Flow Using CT Angiography: Next Steps) J Am Coll Cardiol. 2014 Apr 1;63:1145–55. doi: 10.1016/j.jacc.2013.11.043. [DOI] [PubMed] [Google Scholar]
- 17.Cerqueira MD, Weissman NJ, Dilsizian V, Jacobs AK, Kaul S, Laskey WK, et al. Standardized myocardial segmentation and nomenclature for tomographic imaging of the heart. A statement for healthcare professionals from the Cardiac Imaging Committee of the Council on Clinical Cardiology of the American Heart Association. Circulation. 2002 Jan 29;105:539–42. doi: 10.1161/hc0402.102975. [DOI] [PubMed] [Google Scholar]
- 18.Oeltze S, Kuß A, Grothues F, Hennemuth A, Preim B. Integrated Visualization of Morphologic and Perfusion Data for the Analysis of Coronary Artery Disease. EuroVis. 2006:131–138. [Google Scholar]
- 19.Oeltze S, Hennemuth A, Glaßer S, Kühnel C, Preim B. Glyph-Based Visualization of Myocardial Perfusion Data and Enhancement with Contractility and Viability Information. Eurographics Workshop on Visual Computing for Biomedicine. 2008:11–20. [Google Scholar]
- 20.Kühnel C, Hennemuth A, Oeltze S, Boskamp T, Peitgen H-O. Enhanced cardio vascular image analysis by combined representation of results from dynamic MRI and anatomic CTA. SPIE Medical Imaging. 2008:69180S–69180S-10. [Google Scholar]
- 21.Kirisli HA, Gupta V, Kirschbaum SW, Rossi A, Metz CT, Schaap M, et al. Comprehensive visualization of multimodal cardiac imaging data for assessment of coronary artery disease: first clinical results of the SMARTVis tool. Int J Comput Assist Radiol Surg. 2012 Jul;7:557–71. doi: 10.1007/s11548-011-0657-2. [DOI] [PubMed] [Google Scholar]
- 22.Kirisli HA, Gupta V, Shahzad R, Al Younis I, Dharampal A, Geuns RJ, et al. Additional diagnostic value of integrated analysis of cardiac CTA and SPECT MPI using the SMARTVis system in patients with suspected coronary artery disease. J Nucl Med. 2014 Jan;55:50–7. doi: 10.2967/jnumed.113.119842. [DOI] [PubMed] [Google Scholar]
- 23.Termeer M, Olivan Bescos J, Breeuwer M, Vilanova A, Gerritsen F, Groller E. CoViCAD: comprehensive visualization of coronary artery disease. IEEE Trans Vis Comput Graph. 2007 Nov-Dec;13:1632–9. doi: 10.1109/TVCG.2007.70550. [DOI] [PubMed] [Google Scholar]
- 24.Termeer M, Olivan Bescos J, Breeuwer M, Vilanova A, Gerritsen F, Groller ME, et al. Visualization of myocardial perfusion derived from coronary anatomy. IEEE Trans Vis Comput Graph. 2008 Nov-Dec;14:1595–602. doi: 10.1109/TVCG.2008.180. [DOI] [PubMed] [Google Scholar]
- 25.Toussaint N, Souplet J-C, Fillard P. MedINRIA: medical image navigation and research tool by INRIA. Proc. of MICCAI Workshop on Interaction in Medical Image Analysis and Visualization; Brisbane, Australia. 2007. [Google Scholar]
- 26.Fedorov A, Beichel R, Kalpathy-Cramer J, Finet J, Fillion-Robin JC, Pujol S, et al. 3D Slicer as an image computing platform for the Quantitative Imaging Network. Magn Reson Imaging. 2012 Nov;30:1323–41. doi: 10.1016/j.mri.2012.05.001. [DOI] [PMC free article] [PubMed] [Google Scholar]
- 27.Scientific Comtputing and Imaging Institute. “SCIRun” A Scientific Computing Problem Solving Environment, Scientific Computing and Imaging Institute (SCI) Available: http://www.scirun.org.
- 28.Lorenz C, von Berg J. A comprehensive shape model of the heart. Med Image Anal. 2006 Aug;10:657–70. doi: 10.1016/j.media.2006.03.004. [DOI] [PubMed] [Google Scholar]
- 29.Ecabert O, Peters J, Schramm H, Lorenz C, von Berg J, Walker MJ, et al. Automatic model-based segmentation of the heart in CT images. IEEE Trans Med Imaging. 2008 Sep;27:1189–201. doi: 10.1109/TMI.2008.918330. [DOI] [PubMed] [Google Scholar]
- 30.Zheng Y, Barbu A, Georgescu B, Scheuering M, Comaniciu D. Four-chamber heart modeling and automatic segmentation for 3-D cardiac CT volumes using marginal space learning and steerable features. IEEE Trans Med Imaging. 2008 Nov;27:1668–81. doi: 10.1109/TMI.2008.2004421. [DOI] [PubMed] [Google Scholar]
- 31.Isgum I, Staring M, Rutten A, Prokop M, Viergever MA, van Ginneken B. Multi-atlas-based segmentation with local decision fusion--application to cardiac and aortic segmentation in CT scans. IEEE Trans Med Imaging. 2009 Jul;28:1000–10. doi: 10.1109/TMI.2008.2011480. [DOI] [PubMed] [Google Scholar]
- 32.Kirisli HA, Schaap M, Klein S, Papadopoulou SL, Bonardi M, Chen CH, et al. Evaluation of a multi-atlas based method for segmentation of cardiac CTA data: a large-scale, multicenter, and multivendor study. Med Phys. 2010 Dec;37:6279–91. doi: 10.1118/1.3512795. [DOI] [PubMed] [Google Scholar]
- 33.Metz CT, Schaap M, Weustink AC, Mollet NR, van Walsum T, Niessen WJ. Coronary centerline extraction from CT coronary angiography images using a minimum cost path approach. Med Phys. 2009 Dec;36:5568–79. doi: 10.1118/1.3254077. [DOI] [PubMed] [Google Scholar]
- 34.Gulsun MA, Tek H. Robust vessel tree modeling. Med Image Comput Comput Assist Interv. 2008;11:602–11. doi: 10.1007/978-3-540-85988-8_72. [DOI] [PubMed] [Google Scholar]
- 35.Zheng Y, Loziczonek M, Georgescu B, Zhou SK, Vega-Higuera F, Comaniciu D. Machine learning based vesselness measurement for coronary artery segmentation in cardiac CT volumes. SPIE Medical Imaging. 2011:79621K–79621K-12. [Google Scholar]
- 36.Yang G, Kitslaar P, Frenay M, Broersen A, Boogers MJ, Bax JJ, et al. Automatic centerline extraction of coronary arteries in coronary computed tomographic angiography. Int J Cardiovasc Imaging. 2012 Apr;28:921–33. doi: 10.1007/s10554-011-9894-2. [DOI] [PMC free article] [PubMed] [Google Scholar]
- 37.Zheng Y, Tek H, Funka-Lea G. Robust and accurate coronary artery centerline extraction in CTA by combining model-driven and data-driven approaches. Med Image Comput Comput Assist Interv. 2013;16:74–81. doi: 10.1007/978-3-642-40760-4_10. [DOI] [PubMed] [Google Scholar]
- 38.Wang C, Moreno R, Smedby Ö. Vessel segmentation using implicit model-guided level sets. MICCAI Workshop “3D Cardiovascular Imaging: a MICCAI segmentation Challenge”; 2012. [Google Scholar]
- 39.Shahzad R, Kirisli H, Metz C, Tang H, Schaap M, van Vliet L, et al. Automatic segmentation, detection and quantification of coronary artery stenoses on CTA. Int J Cardiovasc Imaging. 2013 Dec;29:1847–59. doi: 10.1007/s10554-013-0271-1. [DOI] [PubMed] [Google Scholar]
- 40.Lugauer F, Zhang J, Zheng Y, Hornegger J, Kelm BM. Improving accuracy in coronary lumen segmentation via explicit calcium exclusion, learning-based ray detection and surface optimization. SPIE Medical Imaging. 2014:90343U–90343U-10. [Google Scholar]
- 41.Dey D, Cheng VY, Slomka PJ, Nakazato R, Ramesh A, Gurudevan S, et al. Automated 3-dimensional quantification of noncalcified and calcified coronary plaque from coronary CT angiography. J Cardiovasc Comput Tomogr. 2009 Nov-Dec;3:372–82. doi: 10.1016/j.jcct.2009.09.004. [DOI] [PubMed] [Google Scholar]
- 42.Loop CT. M s. Dept. of Mathematics, University of Utah; 1987. Smooth subdivision surfaces based on triangles. [Google Scholar]
- 43.Zorin D, Schröder P, Sweldens W. Interpolating Subdivision for meshes with arbitrary topology. presented at the Proceedings of the 23rd annual conference on Computer graphics and interactive techniques; 1996. [Google Scholar]
- 44.Xiong G, Kola D, Heo R, Elmore K, Cho I, Min JK. Myocardial perfusion analysis in cardiac computed tomography angiographic images at rest. Med Image Anal. 2015 May 27;24:77–89. doi: 10.1016/j.media.2015.05.010. [DOI] [PMC free article] [PubMed] [Google Scholar]
- 45.Lesage D, Angelini ED, Bloch I, Funka-Lea G. A review of 3D vessel lumen segmentation techniques: models, features and extraction schemes. Med Image Anal. 2009 Dec;13:819–45. doi: 10.1016/j.media.2009.07.011. [DOI] [PubMed] [Google Scholar]
- 46.Frangi AF, Niessen WJ, Vincken KL, Viergever MA. Springer, editor. Medical Image Computing and Computer-Assisted Interventation—MICCAI’98. 1998. Multiscale vessel enhancement filtering; pp. 130–137. [Google Scholar]
- 47.Sato Y, Nakajima S, Atsumi H, Koller T, Gerig G, Yoshida S, et al. 3D multi-scale line filter for segmentation and visualization of curvilinear structures in medical images. CVRMed-MRCAS’97. 1997:213–222. doi: 10.1016/s1361-8415(98)80009-1. [DOI] [PubMed] [Google Scholar]
- 48.Dijkstra EW. A note on two problems in connexion with graphs. Numerische mathematik. 1959;1:269–271. [Google Scholar]
- 49.Choi JH, Min JK, Labounty TM, Lin FY, Mendoza DD, Shin DH, et al. Intracoronary transluminal attenuation gradient in coronary CT angiography for determining coronary artery stenosis. JACC Cardiovasc Imaging. 2011 Nov;4:1149–57. doi: 10.1016/j.jcmg.2011.09.006. [DOI] [PubMed] [Google Scholar]
- 50.Raman R, Napel S, Beaulieu CF, Bain ES, Jeffrey RB, Jr, Rubin GD. Automated generation of curved planar reformations from volume data: method and evaluation. Radiology. 2002 Apr;223:275–80. doi: 10.1148/radiol.2231010441. [DOI] [PubMed] [Google Scholar]
- 51.McPherson DD, Hiratzka LF, Lamberth WC, Brandt B, Hunt M, Kieso RA, et al. Delineation of the extent of coronary atherosclerosis by high-frequency epicardial echocardiography. N Engl J Med. 1987 Feb 5;316:304–9. doi: 10.1056/NEJM198702053160604. [DOI] [PubMed] [Google Scholar]
- 52.Brodoefel H, Reimann A, Heuschmid M, Tsiflikas I, Kopp AF, Schroeder S, et al. Characterization of coronary atherosclerosis by dual-source computed tomography and HU-based color mapping: a pilot study. Eur Radiol. 2008 Nov;18:2466–74. doi: 10.1007/s00330-008-1019-5. [DOI] [PMC free article] [PubMed] [Google Scholar]
- 53.Dey D, Schepis T, Marwan M, Slomka PJ, Berman DS, Achenbach S. Automated three-dimensional quantification of noncalcified coronary plaque from coronary CT angiography: comparison with intravascular US. Radiology. 2010 Nov;257:516–22. doi: 10.1148/radiol.10100681. [DOI] [PubMed] [Google Scholar]
- 54.Peyrat JM, Delingette H, Sermesant M, Xu C, Ayache N. Registration of 4D cardiac CT sequences under trajectory constraints with multichannel diffeomorphic demons. IEEE Trans Med Imaging. 2010 Jul;29:1351–68. doi: 10.1109/TMI.2009.2038908. [DOI] [PubMed] [Google Scholar]
- 55.Hoogendoorn C, Duchateau N, Sanchez-Quintana D, Whitmarsh T, Sukno FM, De Craene M, et al. A high-resolution atlas and statistical model of the human heart from multislice CT. IEEE Trans Med Imaging. 2013 Jan;32:28–44. doi: 10.1109/TMI.2012.2230015. [DOI] [PubMed] [Google Scholar]
- 56.Kvitting JP, Wigstrom L, Strotmann JM, Sutherland GR. How accurate is visual assessment of synchronicity in myocardial motion? An In vitro study with computer-simulated regional delay in myocardial motion: clinical implications for rest and stress echocardiography studies. J Am Soc Echocardiogr. 1999 Sep;12:698–705. doi: 10.1016/s0894-7317(99)70019-2. [DOI] [PubMed] [Google Scholar]
- 57.Sutherland GR, Di Salvo G, Claus P, D’Hooge J, Bijnens B. Strain and strain rate imaging: a new clinical approach to quantifying regional myocardial function. J Am Soc Echocardiogr. 2004 Jul;17:788–802. doi: 10.1016/j.echo.2004.03.027. [DOI] [PubMed] [Google Scholar]
- 58.Cirak F, Ortiz M, Schroder P. Subdivision surfaces: a new paradigm for thin-shell finite-element analysis. International Journal for Numerical Methods in Engineering. 2000 Apr 30;47:2039–2072. [Google Scholar]
- 59.Brank B. Nonlinear shell models with seven kinematic parameters. Computer Methods in Applied Mechanics and Engineering. 2005 Jun 10;194:2336–2362. [Google Scholar]
- 60.Techasith T, Cury RC. Stress myocardial CT perfusion: an update and future perspective. JACC Cardiovasc Imaging. 2011 Aug;4:905–16. doi: 10.1016/j.jcmg.2011.04.017. [DOI] [PubMed] [Google Scholar]
- 61.Varga-Szemes A, Meinel FG, De Cecco CN, Fuller SR, Bayer RR, 2nd, Schoepf UJ. CT myocardial perfusion imaging. AJR Am J Roentgenol. 2015 Mar;204:487–97. doi: 10.2214/AJR.14.13546. [DOI] [PubMed] [Google Scholar]
- 62.de Araujo Goncalves P, Rodriguez-Granillo GA, Spitzer E, Suwannasom P, Loewe C, Nieman K, et al. Functional Evaluation of Coronary Disease by CT Angiography. JACC Cardiovasc Imaging. 2015 Nov;8:1322–35. doi: 10.1016/j.jcmg.2015.09.003. [DOI] [PubMed] [Google Scholar]
- 63.George RT, Arbab-Zadeh A, Miller JM, Kitagawa K, Chang HJ, Bluemke DA, et al. Adenosine stress 64- and 256-row detector computed tomography angiography and perfusion imaging: a pilot study evaluating the transmural extent of perfusion abnormalities to predict atherosclerosis causing myocardial ischemia. Circ Cardiovasc Imaging. 2009 May;2:174–82. doi: 10.1161/CIRCIMAGING.108.813766. [DOI] [PMC free article] [PubMed] [Google Scholar]
- 64.Borland D, Taylor MR., 2nd Rainbow color map (still) considered harmful. IEEE Comput Graph Appl. 2007 Mar-Apr;27:14–7. doi: 10.1109/mcg.2007.323435. [DOI] [PubMed] [Google Scholar]
- 65.De Geer J, Gjerde M, Brudin L, Olsson E, Persson A, Engvall J. Large variation in blood flow between left ventricular segments, as detected by adenosine stress dynamic CT perfusion. Clinical Physiology and Functional Imaging. 2015;35:291–300. doi: 10.1111/cpf.12163. [DOI] [PubMed] [Google Scholar]
- 66.Taylor CA, Steinman DA. Image-based modeling of blood flow and vessel wall dynamics: applications, methods and future directions: Sixth International Bio-Fluid Mechanics Symposium and Workshop, March 28–30, 2008 Pasadena, California. Ann Biomed Eng. 2010 Mar;38:1188–203. doi: 10.1007/s10439-010-9901-0. [DOI] [PubMed] [Google Scholar]
- 67.Pijls NH, De Bruyne B, Peels K, Van Der Voort PH, Bonnier HJ, Bartunek JKJJ, et al. Measurement of fractional flow reserve to assess the functional severity of coronary-artery stenoses. N Engl J Med. 1996 Jun 27;334:1703–8. doi: 10.1056/NEJM199606273342604. [DOI] [PubMed] [Google Scholar]
- 68.Asakura T, Karino T. Flow patterns and spatial distribution of atherosclerotic lesions in human coronary arteries. Circ Res. 1990 Apr;66:1045–66. doi: 10.1161/01.res.66.4.1045. [DOI] [PubMed] [Google Scholar]
- 69.Bax JJ, Bleeker GB, Marwick TH, Molhoek SG, Boersma E, Steendijk P, et al. Left ventricular dyssynchrony predicts response and prognosis after cardiac resynchronization therapy. J Am Coll Cardiol. 2004 Nov 2;44:1834–40. doi: 10.1016/j.jacc.2004.08.016. [DOI] [PubMed] [Google Scholar]
- 70.Ishida M, Sakuma H. Coronary MR angiography revealed: how to optimize image quality. Magn Reson Imaging Clin N Am. 2015 Feb;23:117–25. doi: 10.1016/j.mric.2014.09.008. [DOI] [PubMed] [Google Scholar]


