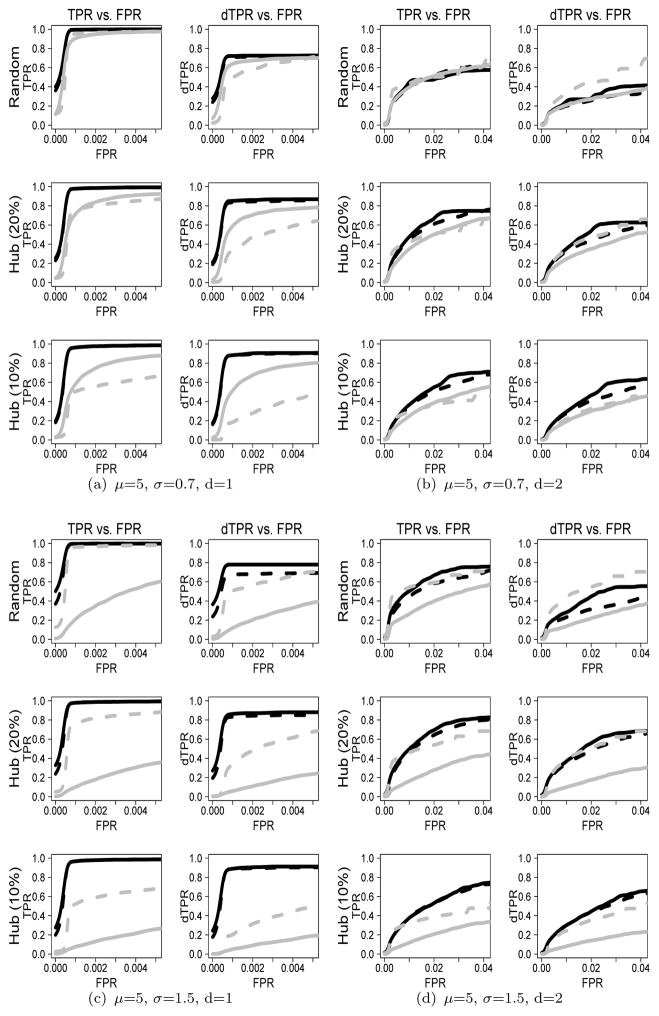
Figure 2.
ROC curves based on TPR (dTPR) vs. FPR when μ=5 and n=100: The solid black line indicates the plnDAG method, the dashed black line indicates the like-log approach, the solid gray line indicates the like-norm approach, and the dashed gray line indicates the RPC method. The upper panel (Figures (a) and (b)) shows ROC curves for μ = 5 and σ = 0.7, and the lower panel (Figures (c) and (d)) shows ROC curves for μ = 5 and σ = 1.5.

