

Abstract
Herpes simplex virus type 1 (HSV-1) is one of the leading etiologies of sporadic viral encephalitis. Early anti-viral intervention is crucial to the survival of herpes simplex encephalitis patients; however, many survivors suffer from long-term neurological deficits. It is currently understood that HSV-1 establishes a latent infection within sensory peripheral neurons throughout the life of the host. However, the tissue residence of latent virus, other than in sensory neurons, and the potential pathogenic consequences of latency remain enigmatic. In the present study, we characterized the lytic and latent infection of HSV-1 in the central nervous system in comparison to the peripheral nervous system following ocular infection in mice. We utilized RT-PCR to detect latency associated transcripts and HSV-1 lytic cycle genes within the brain stem, the ependyma (EP), containing the limbic and cortical areas which also harbor neural progenitor cells, in comparison to the trigeminal ganglia. Unexpectedly, HSV-1 lytic genes, usually identified during acute infection, are uniquely expressed in the EP 60 days post infection when animals are no longer suffering from encephalitis. An inflammatory response was also mounted in the EP by the maintenance of resident memory T cells. However, EP T cells were incapable of controlling HSV-1 infection ex-vivo and secreted less IFN-γ which correlated with expression of a variety of exhaustion-related inhibitory markers. Collectively our data suggest that the persistent viral lytic gene expression during latency is the cause of the chronic inflammatory response leading to the exhaustion of the resident T cells in the EP.
Introduction
Herpes simplex virus 1 (HSV-1) is capable of causing a life-threatening disease known as herpes simplex encephalitis (HSE) (1, 2). More than 50% of surviving HSE patients develop life-altering neurological deficits despite anti-viral treatment (3, 4). Yet, the mechanism(s) responsible for the cause of HSE and long-term neurological sequelae that follow are poorly defined. HSE is characterized by acute necrotizing encephalitis that typically localizes to the orbitofrontal and temporal lobes specifically involving the cingulate and insular cortex (5). In a subpopulation of humans and mice, HSV-1 infects brain ependymal cells resulting in lateral ventricle enlargement (6). Such results coincide with in and ex vivo mouse models that demonstrate HSV-1 tropism toward the hippocampus, neural progenitor cells, and ependymal cells (6–8). Activated microglia, plasma cells, and lymphocytes can persist in the brain following intranasal-induced HSE even in the absence of detectable HSV antigen expression (9, 10). However, it is not understood why such cells persist in the central nervous system (CNS) long after the virus is cleared and/or establishes latency.
HSV-1 is a neurotropic virus that establishes latency within the TG (11–13). Although HSV-1 has been recovered from latently infected brain tissue explants (14, 15), focus has been directed towards the brain stem (BS) (16, 17). Therefore, characterization of the CNS following acute infection as well as understanding the propensity of particular brain regions for susceptibility to infection and latency as it relates to HSE and neurologic sequelae is needed. HSV-1 latent infection is defined by the absence of infectious virions, lytic gene or antigen expression, but the detection of a family of transcripts known as latency-associated transcripts (LAT) (18, 19). Despite the fact that HSV-1 latency is more dynamic than originally thought, viral reactivation is contained by HSV-1 specific T cells evident by sustained contact with infected neurons (20–22).
Since HSV-1 targets the subventricular zone (SVZ) which also is a site of neurogensis during acute infection (6–8), and ependymal cells are neuroepithelial in origin (23), we hypothesized that such a unique niche may provide a suitable environment for HSV-1 to persist. Such an occurrence would modify the local milieu that ultimately contributes to the neurologic deficits observed in surviving HSE patients (2, 4, 12). Therefore, we evaluated the establishment of latency in the EP of mice 30–60 days post infection (DPI). In addition to detecting LAT in the TG, BS, and EP, HSV-1 lytic gene expression was detected exclusively in the EP 60 DPI or during a latent infection. This observation correlated with the persistence of CD4+ and CD8+ effector and resident memory T cells in the EP as opposed to the TG and BS. Functionally, isolated T cells from the EP were found to produce less IFN-γ in response to viral antigen compared to T cells obtained from the TG. Additionally, EP T cells were unable to control viral infection and survive ex vivo compared to those from the TG. The co-expression of key exhaustion markers on CD8+ EP T cells was also apparent by 60 DPI.
Collectively, we interpret the results to suggest that persistent HSV-1 activity in the EP is due to a loss of effector T cell function that allows some level of persistent infection. As the EP includes the hippocampus (HC) and SVZ that harbor neural progenitor cells, and such cells are highly susceptible to HSV-1 infection (8), persistent infection in this region likely contributes to the long-term neurological deficits, or potential relapses observed in the majority of HSE patients (24–28).
Materials and Methods
Mice
C57BL/6J were obtained from the Jackson Laboratory. HSV glycoprotein B-specific T cell receptor (gBT-I.1) transgenic mice are established on a C57BL/6J background (29, 30). NestinGFP transgenic mice from Dr. Enikolopov of Cold Spring Harbor Laboratory were utilized to visualize neural progenitor cells (NPCs). All mice were mated as homozygous pairs in the Dean McGee Eye Institute (DMEI) vivarium. The University of Oklahoma Health Sciences Center and DMEI Care and Use Committee approved all animal procedures. Mice were 6–8 weeks of age for experiments.
Virus and infection model
HSV-1 strain McKrae was propagated in an African green monkey kidney cell line (Vero cells) and maintained at a stock concentration of 108 plaque forming units (PFU)/ml as described previously (31). Sex- and age-matched mice were infected with 103 PFU HSV-1 /cornea in 3 μl of RPMI-1640 media (Gibco) following scarification of the cornea as previously described (31).
Tissue removal and dissections
Mice were anesthetized with a ketamine/xylazine solution followed by perfusion with 10mL PBS as described (31). Using aseptic technique, trigeminal ganglia (TG) and brains were removed and dissected on an iced surgical block. Tissue was stored in Hybernate-A media (Gibco) at −80°C for subsequent analysis including viral plaque assays and protein analysis. For RNA purification, tissue was snap-frozen in 500μL TRIzol Reagent (Invitrogen) and stored at −80°C.
Viral plaque assay
One mL of RPMI 1640 media was added to frozen tissue. Once thawed, tissue was then homogenized using a tissue-tearor (Dremel) on ice followed by centrifugation at 10,000xg for 1.5 minutes at 4°C. Viral titers from homogenized tissue supernatants were determined as previously described (32).
Real-time PCR
Total RNA was isolated from tissue homogenates using the TRIzol Reagent (Invitrogen) according to the manufacturer’s instructions. Approximately 100μg of total RNA was collected from the brain ependyma region and ~4μg from the TG. One μg RNA was converted to cDNA using the iScript Reverse Transcription Supermix (Bio-Rad). RT-PCR was performed with the iTaq Universal SYBR Green Supermix (Bio-Rad) utilizing the CFX96 Thermocycler (Bio-Rad). HSV-1 LAT and lytic genes were normalized to the mean threshold cycle (CT) of beta-actin (βA) and phosphoglycerate kinase 1(PGK.1). Uninfected samples were assigned a CT value of 40 (designating background) to utilize the delta delta CT (ΔΔCT) method for analysis. Type 1 interferon (IFN), IFN-γ, and TNF-α were normalized to the mean CT of β2 microglobulin (β2M) and PGK.1 and also quantified using the ΔΔCT. All primers and corresponding sequences are included in Table I. Genes involved with the interferon pathway were identified using Bio-Rad’s PrimePCR validated primers and normalized to Bio-Rads internal controls βA, glyceraldehyde-3-phosphate dehydrogenase (Gapdh), and TATA box binding protein (Tbp).
Table I.
Oligonucleotide primers
| Primer Name | Abbreviated Name | FWD Sequence | REV Sequence |
|---|---|---|---|
| β-Actin | βA | 5′-CTTCTACAATGAGC TGCGTGTG-3′ | 5′-TTGAAGGTCTCAA ACATGATCTGG-3′ |
| β2 Microglobulin | β2 M | 5′-CCG AAC ATA CTG AAC TGC-3′ | 5′-AGA AAG ACC AGT CCT TGC-3′ |
| Phosphoglycerate kinase 1 | PGK.1 | 5′-CTG ACT TTG GAC AAG CTG GAC G-3′ | 5′-GCA GCC TTG ATC CTT TGG TTG-3′ |
| HSV-1 Latency Associated Transcript | LAT | 5′-CCC TCG TCT CCT GTG ATT CT-3′ | 5′-GGG AGA CAG AAA CAG GAA CAT-3′ |
| HSV-1 Infected Cell Protein 0 | ICP-0 | 5′-GGT CCC CAC TGA CTC ATA CG-3′ | 5′-ATC CCG ACC CCT CTT CTT C-3′ |
| HSV-1 Infected Cell Protein 27 | ICP-27 | 5′-GCA TCC TTC GTG TTT GTC AT-3′ | 5′-ACC AAG GGT CGC GTA GTC-3′ |
| HSV-1 glycoprotein B | gB | 5′-TCT GCA CCA TGA CCA AGT G-3′ | 5′-TGG TGA AGG TGG TGG ATA TG-3′ |
| Interferon α2 | IFNα2 | 5′-GCT TTC CTC GTG ATG CTG AT-3′ | 5′-GTC CTT CAG GCA GGA GAG AA-3′ |
| Interferon α4 | IFNα4 | 5′-TTC TGC AAT GAC CTC CAT CA-3′ | 5′-GGC ACA GAG GCT GTG TTT CT-3′ |
| Interferon α9 | IFNα9 | 5′-GCA GAT CCT GAC CCT CTT CA-3′ | 5′-TCA TAG CCA GCT GGG AGT CT-3′ |
| Interferon α13 | IFNα13 | 5′-TCC CCT CTT TCC TGT CTG AA-3′ | 5′-TTC CAT GCA GCA GAT GAG TC-3′ |
| Interferon β | IFNβ | 5′-CAAGAGGAAAGAT TGACGTGG-3′ | 5′-TAAGGTACCTTTG CACCCTCC-3′ |
| Interferon γ | IFNγ | 5′-GCC AAG TTT GAG GTC AAC AA-3′ | 5′-GAA TCA GCA GCG ACT CCT TT-3′ |
Isolation of neural progenitor cells & RNA isolation
Brains were removed and dissected quickly from infected mice on ice to remove the HC and SVZ. Neural tissue was dissociated using the Miltenyi neural tissue dissociation kit according to the manufacturer’s instructions. When finished, the dissociated tissue was filtered through 40-micron filters and myelin was removed using myelin removal beads (Miltenyi Biotec). Samples were spun at 300xg for 6 minutes at 4°C and suspended in NPC Media, DMEM/F-12 + glutaMAX (Gibco) with 1X N-2 supplement (Thermo Fisher), and 1mL gentamicin (Thermo Fisher). Nestin GFP+ cells (neural progenitor cells, NPC) were sorted using an S3e cell sorter (BioRad). Positive and negative selected cells were pelleted and snap-frozen in liquid nitrogen. RNA was removed using the TRIzol reagent.
Flow cytometry
Single-cell suspensions of designated tissue were created using a 2 mL Wheatley Dounce homogenizer (Fisher Scientific) in DMEM media containing high glucose, L-glutamine, and pyruvate (Gibco) and supplemented with 10% FBS. Cell suspensions were filtered through 70micron filters (MACs SmartStrainer) and washed with 4 mL RPMI-1640 media. Single cell suspensions from TG, BS, and EP homogenates were pre-incubated with 0.8μg CD16/CD32 (eBioscience) for 15 minutes and then labeled with 0.8μg of a combination of antibodies and 0.4% normal rat serum (Jackson ImmunoResearch) for 30 minutes. Specifically, microglia were identified based on CD45mid level expression and CD11b+. Dendritic cells were recognized as CDD45hiCD11b+CD11c+ or B220+. T effector/memory cells where characterized as CD45hiCD3+CD4+, or CD8+ and further defined as CD44hi and CD62Llo. T regulatory cells were defined as Foxp3+CD3+CD4+ using the staining buffer (eBioscience) according to the manufacturer settings. For identification of HSV-1 specific tetramers, cells were first stained with 0.5 μgs of one of the following tetramers provided by the NIH Tetramer Facility at Emory: H-2K(b)/SSIEFARL (ICP8), H-2K(b)/INNTFLHL (gB), and H-2K(b)/QTFDFGRL(RRI). After 15 min incubation, cells were further stained using CD3 and CD8 antibodies. Samples were washed in 1%BSA/PBS with 1mM EDTA (flow buffer) and fixed in 1% paraformaldehyde (PFA) overnight. The 1% PFA was removed and tissue was resuspended in 1mL flow buffer for flow analysis utilizing the MACSQuant Analyzer 10, 3-laser flow cytometer (Miltenyi Biotec). For analysis of T cell anergic or exhaustion markers, myelin was removed using the myelin removal beads by Miltenyi Biotec) according to the manufacturers protocol following homogenization before antibody staining. All antibodies, sources, and clones are summarized in Table II.
Table II.
Flow Cytometry Antibodies
| Panel | Antibody | Company | Catalog # | Clone |
|---|---|---|---|---|
| Microglia | ||||
| CD45 eFluor450 | eBioscience | 48-0451 | 30-F11 | |
| CD11b FitC | eBioscience | 11-0112 | M1/70 | |
| MHC II PE | eBioscience | 12-5321 | M5/114.15.2 | |
| Dendritic Cells | ||||
| CD45 eFlour450 | eBioscience | 48-0451 | 30-F11 | |
| CD11b APC | Tonbo | 20-0112 | M1/70 | |
| CD11C FiTC | eBioscience | 11-0114 | N418 | |
| MHCII PE | Tonbo | 50-5321 | M5/114.15.2 | |
| B220 APC-eFluor780 | eBioscience | 47-0452 | RA3-6B2 | |
| T Effector Memory Cells | ||||
| CD45 eFlour450 | eBioscience | 48-0451 | 30-F11 | |
| CD3e PE-Cy7 | eBioscience | 25-0031 | 145-2C11 | |
| CD4 APC-Cy7 | eBioscience | 47-0041 | 47-0041 | |
| CD8a PE | eBioscience | 11-0081 | 53-6.7 | |
| CD44 APC | eBioscience | 17-0441 | IM7 | |
| CD62L FitC | eBioscience | 11-0621 | MEL-14 | |
| CD4 T Resident Memory | ||||
| CD4 APC-eFluor®780 | eBioscience | 47-0041 | GK1.5 | |
| CD3e PE-Cyanine7 | eBioscience | 25-0031 | 145-2C11 | |
| CD44 APC | Tonbo | 20-0441 | IM7 | |
| CD103 eFluor®450 | eBioscience | 48-1031 | 2E7 | |
| CD69 FITC | eBioscience | 11-0691 | H1.2F3 | |
| CD25 PE | eBioscience | 12-025-81B | PC61.5 | |
| CD8 T Resident Memory | ||||
| CD8 APC-eFluor®780 | eBiosceince | 47-0081 | 53-6.7 | |
| CD3e PE-Cyanine7 | eBioscience | 25-0031 | 145-2C11 | |
| CD44 APC | Tonbo | 20-0441 | IM7 | |
| CD103 eFluor®450 | eBioscience | 48-1031 | 2E7 | |
| CD69 FITC | eBioscience | 11-0691 | H1.2F3 | |
| CD25 PE | eBioscience | 12-025-81B | PC61.5 | |
| T Reg Effector | ||||
| CD4 FITC | Tombo | 35-0041 | GK1.5 | |
| CD25 eFluour450 | eBioscience | 48-0253 | eBio3C7 | |
| Ly6C PeCy7 | eBioscience | 25-5932 | HK1.4 | |
| CD152 (CTLA-4) PE | eBioscience | 12-1522 | UC10-4B9 | |
| FoxP3 APC | eBioscience | 17-5773 | FJK-16s | |
| HSV-1 Tetramers | ||||
| CD3 eFluor 450 | eBioscience | 48-0031 | 145-2C11 | |
| CD8a FITC | eBioscience | 11-0081 | 53-6.7 | |
| gB- PE | NIH | |||
| ICP8-A488 | NIH | |||
| RRI- A488 | NIH | |||
| T Cell Anergy or Exhaustion | ||||
| CD8aAPC eFluor780 | eBioscience | 47-0081 | 53-6.7 | |
| PD1-PE | BD Pharmingen | 551892 | J43 | |
| TIM3-APC | eBioscience | 17-5871 | 8b.2C12 | |
| Lag-3-FITC | eBioscience | 11-2231 | C9B7W | |
| T Cell Exhaustion or Senescence | ||||
| CD3-Pe-Cy7 | eBioscience | 12-0031 | 145-2C11 | |
| CD8aAPC eFluor780 | eBioscience | 47-0081 | 53-6.7 | |
| CD160-PE | eBioscience | 12-1601 | eBioCNX46-3 | |
| KLRG1-FITC | eBioscience | 11-5893 | 2F1 | |
Cell isolation for peptide response assays
Spleens were removed from naive HSV-1 (gBT-I.1) transgenic mice and placed in 100mm dish with 7mL RPMI 1640 media for removal of splenocytes as described previously (33). T cells were positively selected using CD90.2 microbeads with magnetic LS columns following the Miltenyi Biotec procedure. At 60 DPI, the TG and EP were removed from mice for T and CD11b+ cell removal. Single cell suspensions were created as designated above for flow cytometry. Before cell isolation, myelin was removed by incubating with myelin removal beads (Miltenyi Biotec) and collecting the negative fraction for further positive selection. CD11b+ cells were then selected using CD11b microbeads (Miltenyi Biotec) followed by Thy1.2+ removal with CD90.2 microbeads to collect the T cells.
Functional peptide response assay of T cells
CD11b+ cells were isolated from C57BL/6J mice spleens as described above and 50,000 cells were plated in 24-well plates with 1mL of RPMI 1640 media (Gibco) containing 10% FBS. For antigen presentation, 2μg HSV-1 gB498–505 peptide (Biomatik) in DMSO was added to the CD11b+ cells for 1 hour. Next, 20,000 isolated Thy1.2+ cells from 60 DPI TG and EP tissue were added to the CD11b+ cells for 48 hours, when 200μl of the co-culture supernatants were removed for protein analysis. Approximately 10 ± 5% of enriched Thy1.2+ cells were CD4 or CD8 T cells (Fig 10G).
Figure 10.

T cells (Thy1.2+) isolated from the ependyma (EP) at 60 DPI are less responsive to HSV-1 gB-peptide, and controlling infection ex vivo. EP and TG T cell culture supernatants were assayed for IL-2, IL-6, and IFN-γ following APC presentation of HSV-1 gB peptide to T cells isolated from the TG or EP at 30 DPI (A) and 60 DPI (B). (C–D) EP and TG-isolated CD11b+ HSV-1 gB-pulsed cells were co-cultured with HSV-1 gB-specific transgenic T cell receptor T cells and supernatants were assayed for IL-2, IL-6, and IFN-γ at 30 DPI (C) and 60 DPI (D). A Wilcoxon matched-pairs signed rank test was used with n=6/group, *p<0.05. (E–F) EP and TG T cells removed from 60 DPI mice were plated with primary mouse TG cells and infected at an MOI of 0.01 HSV-1. Transgenic HSV-1 gB-specific CD8+ T cells (gB-T) plated at the same concentration served as a positive control. (E) At 24 hrs post infection, supernatants were collected and assayed for virus content by plaque assay. Dashed line represents viral titer in the absence of T cells. (F) At 24–48 hours, cells were removed from culture wells and stained for flow cytometry. Data was analyzed for significant differences by a Mann Whitney test. Results include 2 independent experiments totaling n=5, virus only wells and gB-T cells n=2, *p<0.05, **p<0.005. (G) Thy1.2+ T Cells removed from 60 DPI TG or EP tissue were assayed for viable cell counts (absence of PI staining) both prior (0 hrs) and post (48 hrs) culturing with or without (w/o) primary TG neurons devoid of exogenous HSV-1. Similar T cell counts were recovered and maintained in culture from both the TG and EP with (n=4) and without (n=3) co-culturing of primary TG neurons. CD4 T cells were more abundant when cultured with primary neurons rather than without, p<0.005 Kruskal-Wallis, Dunn’s multiple comparisons test.
Functional assessment of tissue CD11b+ cells
Initially, CD11b+ cells were enriched from 60 DPI TG and EP samples using Miltenyi beads and columns as described and 20,000 cells were plated with 1mL of RPMI 1640 media (Gibco) containing 10% FBS in 24 well plates. One hour following addition of 2μg HSV-1 gB peptide, 50,000 HSV-1 gB-T cells from 14 DPI HSV-1 gBT-I.1 transgenic spleens were added to the culture for 48 hours when 200μl of the supernatants were harvested for protein suspension array.
Co-culture supernatant protein arrays
Supernatants from gB peptide-pulsed CD11b+/enriched T cell cultures were thawed on ice and centrifuged at 10,000xg for 4 minutes. Supernatants were analyzed for IFN-γ, IL-2, and IL-6 (Milliplex, Millipore) by magnetic suspension array analysis according to the manufacturer’s instructions. Analysis was performed utilizing the Bio-plex Luminex xMAP array system (BioRad).
Establishment of TG Cultures
TG from uninfected mice were aseptically removed and placed in 1mL HBSS w/o Ca2+ and Mg2+ containing 1 mg/mL collagenase type IV and type IX (sigma) and prepared according to Halford et al. (34). Initially, plates were coated with soluble rat tail collagen type I (Gibco) at 25 μg/well. Following 24 hours, plates were washed and then coated with laminin (Trevigen) at 2.5 μg/mL at 37°C overnight. Pooled TG were digested by trituration with a 1000 μl pipettman every 20 min for 60–90 min at 37°C. Following digestion, single cell suspensions were washed and distributed into the 24 well pre-coated plates. Cultures were maintained for 7 days in DMEM/F-12 + glutaMAX supplemented with 10% FBS, 1X Antibiotic-Antimycotic, and 10ng/mL NGF2.5 (Sigma) until media was changed. Media was changed every 3–5 days until cultures were established and used in experiments (2 weeks).
Functional T cell assay
Following EP and TG tissue digestion in 1mg/mL collagenase type IV and type IX (Sigma) for 30 minutes, samples were gently dissociated using a 2mL dounce homogenizer. Myelin was removed using myelin removal beads and Thy1.2+ cells were isolated using Thy1.2 enrichment beads and columns (Miltenyi Biotec). TG cultures (supplemental experimental procedure) were infected at an MOI of 0.01 or 3800 PFU for 2 hours, when media was changed and 20,000 isolated Thy 1.2+ cells (of which 2,000 were CD3+ T cells) were added/well for 24–48 hours. A volume of 200ul was removed at 24 for viral plaque assay. At the end of the experiment, all cells were collected and analyzed by flow cytometry for live T cells using propidium iodide (eBioscience), and anti-CD45, CD4, and CD8 antibodies (eBioscience).
Statistical Analysis
For all analysis, non-parametric statistics were performed as column statistical analysis did not pass a D’Agostino & Pearson omnibus normality test. In two-group comparisons, a two-tailed nonparametric Mann-Whitney test was used. For multiple-group comparisons, a nonparametric Kruskal-Wallis one-way analysis of variance with a Dunn’s multiple comparison post-test was utilized. All significance levels were determined with an alpha of 0.05 (95% confidence intervals). All data is graphed as mean ± SEM.
Results
HSV-1 is prevalent in limbic-cortical areas during acute encephalitis
HSV-1 disseminates into the CNS by transynaptic passage from the sensory ganglia into higher order neurons following infection of the eye, nasal, or oral cavity (35–37). However, characterization of susceptible CNS regions is not extensively studied. To determine which regions of the brain are infected with HSV-1 during primary infection, brain tissue was dissected and assayed for infectious virus during acute infection coinciding with encephalitis. Neurological signs of encephalitis such as enlarged skull, irregular gait, hunched posture, and labored breathing can be detected as early as 7 DPI. Nervous tissue from moribund mice (Fig. 1) was harvested beginning at 8 DPI through 14 DPI. At 8 DPI, infectious virus was detected in the TG and all major regions of the brain (Fig. 1B, 1C). Of note, viral loads were elevated in the frontal lobe (FL), mid-brain (MB), HC, and tissue lining the lateral ventricles, the SVZ (Fig. 1C) compared to the TG, BS, olfactory bulb (OB), or cerebellum (CB) at 8 and 9 DPI (Fig. 1C). By 12 DPI, only one of the six TG samples examined possessed infectious virus (Fig. 1C). By 14 DPI, infectious virus was no longer detected in any brain region or TG (Fig. 1C 1D). Therefore, HSV-1 favors specific regions of the brain but is ultimately cleared by 12–14 DPI.
FIGURE 1.

Kinetics of HSV-1 replication in the nervous system during acute encephalitis. (A) Schematic of represented brain regions and the trigeminal ganglia (TG) dissected for plaque assay. (B) Viral titer results from total virus obtained from the tissue from the TG, brain stem (BS), olfactory bulb (OB), cerebellum (CB). (C) Viral titers recovered trending at a greater PFU during acute encephalitis (8 DPI) from the brain limbic cortical regions including the frontal lobe (FL), midbrain (MB), hippocampus (HC), and subventricular zone (SVZ) from 8 DPI to 14 DPI (n=4–6/ time point) (B–C). Data is displayed as mean ± SEM.
HSV-1 lytic cycle genes are exclusively expressed in the ependyma by 60 DPI
Since infectious virions were more readily detected in limbic-cortical regions of the brain during acute infection, we next determined if these same regions harbored latent virus. LATs are the primary indicator of HSV latency as they are abundantly expressed while lytic cycle genes are significantly repressed within the TG by 30 DPI (38, 39).
LATs were detected in the brain EP including the MB, HC, and SVZ, areas of abundant infectious virus in moribund animals (Fig. 2A). However, LAT expression in the TG was significantly more abundant at 30 and 60 DPI (Fig. 2A). LAT expression was also examined in the BS as it receives sensory neural projections from the TG and has been reported as a site of HSV-1 reactivation (40). At 30 DPI, the level of LAT expression within the BS was similar to those found in the EP but also far less than transcripts expressed in the TG (Fig. 2A). By 60 DPI, LAT expression remained similar within the BS and EP but remained below the level detected within the TG (Fig 2A).
FIGURE 2.

HSV-1 lytic gene expression is elevated in the ependymal rich (EP) brain region during latency. (A–E) Total RNA was extracted from latent (30 or 60 DPI) HSV-1-infected TG, BS, and EP and subjected to qRT-PCR. (A) LAT expression during latency (30 DPI n=6, 60 DPI, ICP0 n=7, all other genes n=10). (B–C) HSV-1 lytic gene ICP0, ICP27, TK, and gB expression at 30 (B) and 60 (C) DPI. Lytic gene data represents 2–3 independent experiments (n=4 (D30) n=6 (D60) for (ICP0) and n=6–7 (D30) n=7–10 (D60) for (ICP27, TK, gB) (mean ± SEM). *p<0.05 **p<0.005 comparing the indicated groups as determined by a one-way ANOVA Kruskal-Wallis with Dunn’s multiple comparisons post-test. (D–E) Average linkage cluster diagram of lytic gene data correlates lytic gene expression changes within respective tissue from similar animals. (D) At 30 DPI, mice that express lytic genes in the BS also express lytic genes in the EP. (E) By 60 DPI, most samples from the EP express lytic genes as opposed to the TG and BS (E). Heat Map represented by the Euclidean distance method was analyzed utilizing the CIMminer Genomics and Bioinformatics Group website.
It is understood that HSV-1 latency occurs in the TG following primary infection of the cranial mucosa route (11–13, 41). However, recent observations suggest that latently-infected neurons will express viral lytic genes associated with altered intrinsic transcriptional profiles (21). Therefore, to determine if susceptible CNS regions expressed lytic genes during latency, HSV-1 lytic genes were measured by qRT-PCR including the immediate early genes infected cell protein (ICP) 0 and ICP27, the early gene viral thymidine kinase (TK), and the leaky-late gene, glycoprotein B (gB), all of which can occur before viral DNA synthesis, yet are indicative of an active replication process (42). HSV-1 lytic genes were limited in expression at 30 and 60 DPI in the TG demonstrating “classic” latency (Fig. 2B–2E). Conversely, ICP0, ICP27, TK, and gB transcripts were uniformly detected in the BS and all but ICP0 in the EP at 30 DPI (Fig. 2B). By 60 DPI, EP lytic gene expression levels continued to rise while lytic gene expression decreased in the BS. Every lytic gene measured became statistically elevated in the EP in comparison to the TG, and ICP0, ICP27, and gB expression increased in comparison to the BS (Fig. 2C). Heat map analysis further demonstrates that by 60 DPI HSV-1 lytic genes are predominantly expressed in the EP compared to the TG and BS (Fig. 2D–E). At 30 DPI, (Fig 2E) lytic genes expressed in the BS are also expressed in the EP and the inverse is true for the TG and EP.
As the EP contains the SVZ and HC, which harbor neural progenitor cells (NPC), we investigated whether NPC cells also expressed viral lytic genes and LAT at 30 and 60 DPI. Using nestin-GFP+ reporter mice (43), nestin+ and nestin− sorted cells were found to express viral lytic genes and LAT at 30 and 60 DPI (Fig. 3). The expression of all lytic genes was evident by 60 DPI in the HC and SVZ with no bias in levels of expression comparing nestin+ to nestin− cells. Nestin− infected cells likely include ependymal cells as these cells are highly susceptible in neonate brain sections (7) and upon direct brain infection (6, 8). Taken together, we find that the EP is unique in that it harbors HSV-1 lytic gene expression that includes highly susceptible NPC.
FIGURE 3.

HSV-1 genes expressed in nestin+ or nestin− NPCs. (A–D) Total RNA was removed from NPCs sorted from either the HC or SVZ based on nestin-GFP positive or negative selection and analyzed for HSV-1 lytic genes or LAT by qRT-PCR. Data shown represents 2–3 independent experiments with n=4–5 (lytic genes) n=3 (LAT).
Resident brain immune cells display an activated phenotype in HSE-recovered mice
ICP0 is a strong activator of viral gene expression required for lytic infection and reactivation from latency (44). Since ICP0 levels are not expressed abundantly in the EP until 60 DPI, we hypothesized that the local immune response is insufficient to control infection or spontaneous/incomplete reactivation within the EP at 60 DPI. To determine if HSV-1 lytic genes expressed in the EP correlate with changes in the local immune response, CNS-specific resident microglia activity was first examined. In naive animals, microglia display a ramified phenotype that allow for tissue sampling and maintenance of homeostasis. However, under pathogenic conditions, these cells can proliferate and increase MHC class II (MHC II) expression (45, 46). We found microglial cell numbers in the EP and BS at 30 DPI were not significantly different to those recovered from uninfected mice (Fig. 4A–C). By 60 DPI, there was a doubling in the cell number of microglia recovered in the EP (Fig. 4C) but not BS (Fig. 4B) compared to uninfected or 30 DPI animals. Total microglia expressing MHC class II were elevated in the EP and BS of 30 and 60 DPI mice compared to uninfected controls (Fig. 4E, 4F). However, the mean fluorescence intensity (MFI) of the MHC II on microglia residing in the EP was maintained both at 30 and 60 DPI indicating that MHCII expression was elevated on the surface of microglia in the EP through 60 DPI as opposed to that found in the BS (Fig 4H, 4I). Thus, microglia display an activated phenotype during viral latency which is maintained to a greater degree in cells that reside in the EP as opposed to the BS.
FIGURE 4.

EP microglia remain activated and elevated in number during latency. (A–C) Single cell suspensions from harvested tissue were analyzed by flow cytometry to measure total microglia (CD45intCD11b+) (A) from the brain stem (BS) (B) and ependyma (EP) (C) at 30 and 60 DPI compared numbers to naive (Ui) animals. (D) Representative flow plot demonstrating the frequency of CD45int, CD11b+ microglia also expressing MHC Class II (MCH II) designated by the black box for double positive CD11b+ and MHC II cells. 30 and 60 DPI time points were compared to Ui animals from the BS (E) and EP (F). (G) Mean Fluorescent Intensity (MFI) of total MHC II expression on microglia represented by the histogram at 60 DPI EP (black) compared to an Ui control (grey). (H–I) MFI of MHC II expression on microglia (MG) residing in the BS (H) and EP (I) at 30 and 60 DPI compared to Ui controls. Data is presented as a summary of 2–3 independent experiments for 30 DPI n=11, Ui n=6, and 60 DPI n=6/group. All p values represent significance in comparison to Ui controls utilizing the nonparametric one-way Kruskal-Wallis test with the Dunn’s multiple comparisons post-test (*p<0.05 ***p<0.005).
In addition to microglia, dendritic cell (DC) composition was evaluated at 60 DPI in the TG, BS, and EP since these are classic antigen presenting cells. All three tissues possessed conventional (CD11c+CD11b+B220−MHCII+) DCs as well as some plasmacytoid (CD11c+CD11b−B220+) DCs but there was a significantly higher frequency of cDCs residing in the EP compared to the TG at 60 DPI (Fig. 5).
FIGURE 5.

The EP contains the most conventional dendritic cells. (A–B) At 60 DPI, plasmacytoid (CD11c+, CD11b−, B220+) and conventional DCs (CD11c+, CD11b+, B220−) were enumerated by flow cytometry and graphed as percent of CD45hi total cells (A) or CD11c+ cells (B). Data is a summary of 3 independent experiments (n=10) and analyzed by a Kruskal-Wallis multiple comparisons test with *p<0.05, **p<0.005.
T cells persistence is restricted to the EP post-HSE
T lymphocytes are known to create immunologic synapses with latently infected TG neurons which are necessary to control HSV-1 reactivation (47). However, it is unclear whether T cells survey the CNS during HSV-1 latency. To understand the overall T cell response, total CD4+ and CD8+ T cells as well as effector memory cells (TEM) were enumerated by flow cytometry (Fig. 6A). TEM are thought to circulate between lymphoid and peripheral tissue and are capable of rapid activation following antigen recognition (48). When comparing 30 to 60 DPI time points in the TG and BS, both total T and TEM cell numbers peaked at 30 DPI and decreased by 60 DPI (Fig. 6B, 6C). Only in the EP do total CD4+ and CD8+ T cells as well as CD4+ and CD8+ TEM remain elevated to 60 DPI (Fig. 6D). HSV-1 lytic gene expression persists in the EP at this time point and thus, may be the driving force that results in T cell retention.
FIGURE 6.

T cells persist in the ependyma (EP) during latency. (A) Representative gating strategy showing CD4+ and CD8+ T cells by flow cytometry. Effector memory T cells (TEM) were gated for CD44hi and CD62Llo. (B–C) In the TG and BS, total CD4+ T cells, CD8+ T cells, and CD4+ and CD8+ TEM cells at 30 and 60 DPI. (D) Total CD4+ T cells, CD8+ T cells, and CD4+ TEM, CD8+ TEM in the EP. (E) T resident memory cells (TRM) gated by CD3+, CD8+ T cells are selected for CD44 and CD103 expression with further selection by CD69+ expression. (F) TRM in the trigeminal ganglia (TG) and (G) brain stem (BS) 30 DPI. (H) CD8 TRM cells at 30 and 60 DPI in the EP. Graphs represent 2–3 independent experiments per time point with uninfected (Ui) n=4, 30 DPI n=8–10, and 60 DPI n=7/group; *p<0.05 **p<0.005 as determined by a Kruskal-Wallis ANOVA.
Emerging emphasis has been placed on the complexity of memory T cell subsets which has shed light on a true resident T subset, resident memory T cells (TRM). TRM reside in non-lymphoid tissue following activation and can adopt unique lineage-specific signatures (49–51). These cells have not been characterized in HSV-1 latently infected nervous tissue. Therefore, TRM were examined to delineate cells that possess a phenotype consistent with the potential for a more effector cytokine-production capacity (50) and tissue retention (52, 53) (Fig. 6E). TRM tissue levels were retained in the BS and EP at 30 and 60 DPI, though, levels were lost in the TG comparing the 30 to 60 DPI time points (Fig. 6F–6H). Of note, there was a downward trend in TRM cell numbers residing in the BS comparing 30 to 60 DPI whereas this was not the case in the EP.
CD4-TRM cell populations in latently infected CNS tissue
CD4+ T cells are critical for CD8+ T cell priming and effector function but also can dampen CD8+ T cell activity. CD4+ TRM cells (CD44hi, CD103+ and CD69+) were found to persist in the BS and EP at 60 DPI in significant numbers as opposed to that found in the TG (Fig. 7A–7C). Within this population of cells, TRegs were few in number and are likely not instrumental in the overall host CD4+ T cell response in the CNS during latency (Fig. 7D–7F).
FIGURE 7.

Ly6C+ CD4 T cells are reduced in the ependyma (EP) but not trigeminal ganglia (TG) or brain stem (BS) by 60 DPI. (A–C) CD4+ TRM (CD3+ CD4+ CD44+ CD103+ CD69+) cells identified by flow cytometry at 60 DPI in the BS and EP compared to the TG. TRegs (CD4+ CD25+ FoxP3+) in the TG (D), BS (E) and EP (F) at 30–60 DPI. (G–I) Th1-type cells (CD4+ Ly6C+) at 30–60 DPI in the TG (G), BS (H), and EP (I) in comparison to uninfected (Ui) controls. The bars represent the mean + SEM and summarizes 2–3 independent experiments per time point with Ui n=6, 30 DPI n=7, and 60 DPI n=9/group. *p<0.05, **p<0.005 comparing the indicated groups as determined by Kruskal-Wallis ANOVA
Recently, Ly6C-expressing CD4+ T cells have been reported to resemble Th1 cells by secreting IFN-γ, and TNF-α and therefore, may contribute to control viral replication (54). Therefore, we examined the presence of this CD4+ T cell population in select areas of the CNS during HSV-1 latency. Similar numbers of Ly6C+CD4+ T cells were noted in comparison to CD4 TRM at 30 DPI and 60 DPI in the TG and BS (Fig. 7G, 7H). In comparison, Ly6C+ CD4+ T cells were significantly elevated in the EP at 30 DPI but dropped by 60 DPI (Fig. 7I). The summation of the phenotypically-defined CD4+ T cell populations indicate there is a unique signature in the EP region with a loss of the Th1-like Ly6C+CD4+ T cells by 60 DPI relative to an insignificant loss in the TG and BS. This loss is inversely proportional to lytic gene expression from the 30 to 60 DPI time points.
HSV-1 specific cognate T cell responses display subdominant changes in the TG
It is well documented that at least 50% of CD8+ T cells present in the TG during latency recognize the HSV-1 glycoprotein gB498–505 (gB) (55) while a lower percentage will display subdominant epitope specificity (56). Since HSV-specific CD8+ T cell populations have not been clearly defined in the CNS of HSV-1 latently-infected mice, we investigated their presence using dominant and subdominant HSV-1 epitopes defined by tetramer staining of cells residing in the TG. In using this approach, we found that 60% of HSV-1 gB-specific CD8+ T (gB-T) cells persist in the TG while 70–80% persist in the BS and EP at 30 and 60 DPI (Fig. 8A–8F and 8H). Total gB-specific CD8+ T cell numbers also remain consistent from 30 to 60 DPI (Fig. 8G). Examination of other subdominant viral protein epitope reactivity including ribonucleotide reductase 1 (RRI822–829) and ICP8 (57) by CD8+ T cells found the percentage of RRI-specific CD8+ T cells modestly but insignificantly increased in the TG at 60 DPI, yet significantly decreased in the BS (Fig. 8A–8D, 8I, 8J). There was no noticeable change in the RRI-specific CD8+ T cell population residing in the EP comparing 30 to 60 DPI (Fig. 8E–8F, 8K, 8L). Of note, ICP8-specific CD8+ T cells are completely lost in all tissues examined by 60 DPI (Fig. 8A–8F, 8K, 8L).
FIGURE 8.

Immunodominant and subdominant HSV-1- specific cognate CD8 T cell profile during latency. (A–F) The mean percent of HSV-1 specific CD8 H-2K(b) tetramer bound antigens to gB, RRI, and ICP8 within the trigeminal ganglia, TG (A, B) brain stem, BS (C, D), and ependyma, EP (E, F). (G) Total HSV-1 gB-specific CD8+ T cells from 30–60 DPI in TG, BS, and EP. (H) Frequency of HSV-1 gB specific CD8+ T cells from 30 to 60 DPI. (I) Total HSV-1 RRI-specific CD8+ T cells from 30–60 DPI in TG, BS, and EP, and % change comparing day 30 and 60 (J). (K) HSV ICP8-specific T cells from 30–60 DPI and % changes (L) in TG, BS, and EP. Bars represent the mean + SEM from 2–3 independent experiments at 30 DPI n=6/group and 60 DPI n=10/group; *p<0.05 comparing the indicated groups as determined by a non-parametric Mann-Whitney test.
Specific interferon-inducible gene expression is reduced in the EP during latency
In addition to T cells, type I IFNs and other cytokines contribute to viral surveillance in the CNS (58–60), and IFN-β specifically in the EP (61). Therefore, we evaluated the expression of select anti-viral cytokine and type I IFN genes in the TG, BS, and EP at 30 and 60 DPI. The relative abundance of several IFN genes were found to be greater in the TG at 60 DPI compared to those expressed in the BS or EP (Fig. 9A–9C). Of interest, IFN-γ transcript levels dropped in the TG from 30 to 60 DPI (Fig. 9A). In the EP at both 30 and 60 DPI, IFN-γ was not expressed above uninfected controls (Fig. 9C). To further dissect the tissue-specific IFN signaling response, downstream IFN-inducible gene expression was measured (Fig. 9D, 9E). Of the genes investigated, all IFN-inducible genes but Irf7 were reduced in the EP in comparison to the TG (Fig. 9D, 9E). Conversely, Irf7 was up-regulated in the EP (Figure 9D). Overall, IFN-γ and key downstream antiviral IFN-inducible genes are not expressed in the EP at a level similar to what is found in the TG at 60 DPI. Such results coincide with the continued expression of HSV lytic genes in the EP during latency.
FIGURE 9.

Interferon gene expression and downstream IFN-inducible genes are elevated in the trigeminal ganglia (TG). IFN genes were measured by qRT-PCR using the ΔΔCT method in the TG (A), brain stem, BS (B), and ependyma, EP (C) at 30–60 DPI. IFN-inducible genes measured as above are presented as low (D) and high (E) expressing genes. (A–C) Data are normalized to the mean of uninfected tissue n=5, with 30 DPI n=5–6 /group and 60 DPI n=8/group, *p<0.05 comparing 30–60 DPI time points determined by the Mann-Whitney U t-test. (D–E) Data was analyzed using the non-parametric Mann-Whitney U test, *p<0.05, **p<0.005, TG (n=5) and EP (n=7).
Isolated EP T cells are less functional than those from the TG
Recognizing that HSV-1 lytic genes are expressed in the EP in the presence of TRM and gB specific-CD8 T cells, it is possible that these cells have become functionally exhausted due to prolonged antigen exposure. In order to test the functionality of resident T cells from 30 and 60 DPI, TG and EP T cells were isolated and co-cultured with HSV-1 gB peptide-pulsed CD11b+ splenocytes (Fig. 10A–10B). At 30 DPI, EP and TG T cells secreted equivalent amounts of IL-2, IL-6, and IFN- γ (Fig. 10A). However, by 60 DPI, EP T cells secreted significantly less IFN-γ in comparison to TG T cells without a significant change in IL-2 or IL-6 levels although, a downward trend was evident with p=0.06 (Fig. 10B). To determine if a functional anomaly also existed with antigen presentation, CD11b+ cells were removed from the TG and EP at 30 and 60 DPI and examined for antigen presentation capacity. Specifically, these cells were pulsed with gB peptide and co-cultured with HSV-1 gB-specific transgenic T cell receptor (gBT-I.1) T cells. Culture supernatants were then assayed for cytokine content. At 30 DPI, cytokine levels were elevated in the EP cultures compared to the TG cultures with a significant increase in IL-2 and IFN-γ levels (Fig. 10C). However, by 60 DPI there was no significant difference in the cytokine levels found comparing TG and EP cultures (Fig. 10D).
To test the capability of EP T cells to control infection, at 60 DPI, Thy1.2+ cells were removed from both the TG and EP. An ex vivo culture system was generated from primary naive TG cell cultures infected with HSV-1 at an MOI of 0.01. EP and TG Thy1.2+ cells were then plated with the infected cultures and assayed 24 hrs later for viral content. EP T cells were unable to control infection with levels similar to that of cultures infected in the absence of T cells (Fig. 10E). In comparison, there was a significant reduction in infectious virus recovered from cultures that contained TG T cells similar to that recovered in cultures containing gBT-I.1 transgenic T cells (Fig. 10E). Additionally, EP T cells were more susceptible to infection as their total numbers plummeted at 48 hrs in culture (Fig. 10F). Both TG and EP T cells from 60 DPI tissue survived at similar levels when added to TG cell cultures without virus (Fig. 10G). Taken together, there is a deficiency at the level of T cells residing in the EP to respond to HSV-1 antigen and active infection compared to T cells residing in the TG by 60 DPI not observed at 30 DPI.
EP CD8+ T cells express and co-express exhaustion markers
To further characterize the phenotype of the resident T cells within TG or EP tissue, we evaluated their expression of anergic and/or exhaustion ligands. As chronic infection or cancer models can invoke persistent antigen exposure or inflammation which can result in exhaustion of local T cells (62), we evaluated exhaustion ligand expression in our HSV-1 latency model. Indeed, at 30 and 60 DPI an abundance of EP T cells express or co-express anergic (LAG-3+PD1+) or exhaustive T cell markers LAG-3,TIM-3,PD1,CD160, and KLRG-1(63) (Fig. 11). Moreover, the expression is more pronounced in comparison to the TG at 60 DPI (Fig 11). The overall percentage of CD8 T cells expressing exhaustive markers at 30 DPI averaged 2% in TG and 5% in the EP. By 60 DPI, the frequency of CD8 T cells that co-expressed exhaustion markers in the TG averaged 12% in comparison 35% in the EP (data not shown). More specifically, co-expression of total cells expressing the inhibitory markers LAG-3+, TIM-3+, and PD1+ is apparent in EP T cells by 60 DPI. This observation is consistent with the idea that the upregulation and co-expression of multiple inhibitory receptors are a key aspect to the loss of effector T cell function (62–64).
Figure 11.
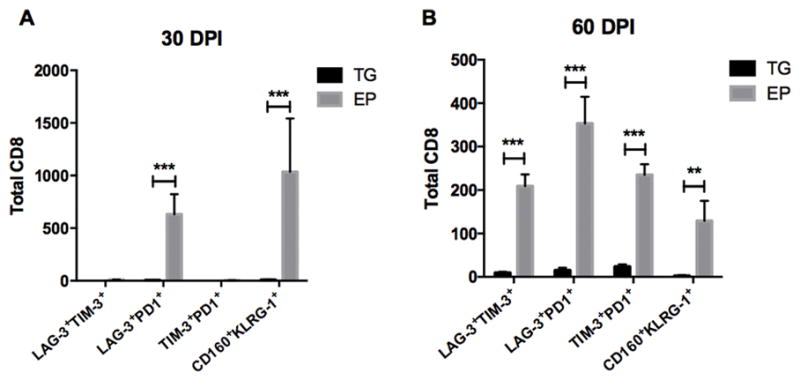
EP CD8+ T cells upregulate and co-express exhaustion inhibitory markers. The co-expression of LAG-3 and TIM-3, LAG-3 and PD1, TIM-3 and PD-1, and CD160 and KLRG-1 by CD8+ T cells are enumerated by flow cytometry from the TG and the EP at 30 (A) and 60 DPI (B). Data is represented by 2 independent experiments for each time point, n=7, p<0.05, **p<0.005, **p<0.0005 from a Mann-Whitney (t) test comparing cell counts from the TG versus EP.
Discussion
Neurological sequelae are common in post-HSE patients, and often patients suffer from signs of clinical relapse (4, 26, 65, 66). Given that there is a persistent immune response in the TG of latently-infected mice (31, 67–69), this study was undertaken to determine if the CNS harbored latent virus and elicited a similar immune profile in susceptible brain regions of mice that survive HSE. Although the HSV-1 genome is frequently found in the CNS of latently infected mice (14, 17, 70, 71) and humans (72–74), latency within the CNS along with immune events that may occur in the CNS during latency are largely unexplored and understudied.
In the current investigation, specific areas of the brain were identified to express lytic viral genes and establish a latent state of infection as defined by LAT expression. However, the levels of LAT expression during latency were disproportionate with infectious virus recovered during acute infection. Namely, the EP including the SVZ and HC was found to contain copious amounts of infectious virus 8 DPI but modest levels of LAT at 30 DPI compared to the TG. As the EP of moribund mice contained large amounts of virus and a HSE resistant mouse strain (CXCR3−/−) possess reduced viral titers in the EP (61), we interpret the results to suggest that animals that survive HSE harbor less virus in this region. The abundance of LAT and quiescent lytic gene expression within the TG at 30 and 60 DPI is consistent with the TG as a principal site of viral latency (38, 75–80).
In the current study, low levels of lytic genes including ICP0 or TK were detected infrequently in TG samples at 30 DPI consistent with previous reports (38). Another study using a different route of infection identified that 59% of latently infected dorsal route ganglia express lytic genes (21). In the present study and in contrast to the TG, viral lytic gene expression was more robust in the BS at 30 DPI but nearly resolved by 60 DPI. By comparison, the EP displayed a log fold increase in lytic gene expression by 60 DPI. We reasoned that the persistent expression of viral lytic genes in the EP during latency was the result of the unique microenvironment of the tissue or a change in the host immune response to viral surveillance over time.
During acute encephalitis, HSV-1 readily replicates within lateral ventricle ependymal cells and NPCs ultimately resulting in their loss and altered differentiation (6, 8). In the present study, NPCs removed from the EP expressed lytic genes as did the negative-sorted cell fraction at 30 and 60 DPI. We speculate HSV-1 replicates at low levels in the renewable neuroepithelial ependymal cells and NPCs accounting for the continual lytic gene expression. Changes or loss in the dynamics of NPC differentiation as a result of HSV-1 infection could explain the long-term neurological deficits observed in human HSE patients that recover from the illness (4, 65, 66).
The increase of EP viral lytic gene expression during latency from 30 to 60 DPI could also be explained by a transition in the local immune response to a form of exhaustion. We evaluated the T cell subtypes phenotypically classified at TEM and TRM in the TG, BS, and EP, but found a numerical loss in the TG and BS and maintenance of such cells in the EP. Likewise, evaluating the ability of antigen presenting cells to present viral peptide was not compromised in cells isolated from the EP as their capacity to present antigen was similar to those isolated from the TG. However, T cells isolated from the TG and EP exhibited distinct responses to peptide-pulsed antigen presenting cells with EP-isolated CD8+ T cells displaying a muted response based on IFN-γ, IL-2, and IL6 secretion at 60 DPI. Moreover, the loss of cytokine production cannot be explained by a reduction in peptide-specific T cells as there were more gB-specific CD8+ T cells in number and percentage of total T cells in the EP compared to the TG. While this analysis was restricted to CD8+ T cells, the results are consistent with an exhausted T cell response (81, 82) and would help illuminate the inability to block lytic infection. To corroborate these findings, we further recognized that the CD8+ EP T cells expressed a number of exhaustive phenotypic markers at 30 DPI and more CD8+ cells co-expressed these markers by 60 DPI. These results are consistent with those reported herein in which T cells removed from the EP did not survive and control infection in comparison to T cells isolated from the TG in primary TG cell cultures.
In addition to T cells, type 1 IFNs have been found to enhance resistance to HSV-1 infection in the CNS (6, 58). As type 1 IFNs are critical in establishing an anti-viral state of the cell, a deficiency of type 1 IFN could enable HSV-1 to more readily replicate in neurons and cells within the EP (83). Specific HSV-1 proteins like ICP0 can antagonize IFN signaling by re-directing cellular proteins for degradation (84, 85) thus allowing viral lytic gene expression and reactivation (44). In the present study, ICP0 was not detected in the EP until 60 DPI when lytic genes were readily expressed in 9 out of 10 mice assessed. Concurrent with ICP0 expression, the type 1 IFN mean expression was much lower in the EP compared to the TG. Furthermore, downstream IFN-inducible gene expression was reduced in the EP in comparison to the TG at 60 DPI with the exception of Irf7. As Irf7 can be induced independently of the Jak-STAT pathway-triggered IFN pathway, other events may drive Irf7 expression (86).
Overall, we have identified a susceptible brain region, the EP to retain HSV-1 lytic gene expression during a classically defined latency period. Therefore, not only do neurons in the CNS harbor latent virus, cells within the EP such as NPCs express viral lytic genes. As HSV-1 lytic infection is characterized by three ordered transcriptional cascades (87), and we find expression of genes from all three stages, it is possible lytic infection occurs just at the level below detection of infectious virions. This line of reasoning is consistent with the persistent yet dysfunctional T cell response found in the EP during latency. How such events ultimately influence the dynamics of brain function including reseeding of lost neurons to injury or infection is unknown. It is interesting to note that memory, behavior abnormalities, and post-encephalitic epilepsy are all common post-HSE neurological impairments reported (88, 89). Experimentally, we have previously found that the lateral ventricles of encephalitic mice and a subpopulation of HSE-diagnosed human patients are enlarged (6). As the SVZ is proximal to the lateral ventricles and NPCs are infected during HSE (8), it is tempting to speculate the neurologic deficits observed in the majority of surviving HSE patients are due to the simmering HSV lytic infection that alters environmental cues of NPC differentiation within the EP as a result of the host anergic T cell response to infection. To this end, experimental evidence suggests latent HSV-1 infection does alter NPC proliferation as a result of FGF2 deficits (90) resulting in behavioral changes in mice (10).
Acknowledgments
The authors would also like to acknowledge Blake Hopiavuori for help with HC and SVZ dissections. We acknowledge the NIH Tetramer Core Facility for provision of the MHC class I tetramer (National Institute of Allergy and Infectious Diseases, contract # HHSN272201300006C).
Footnotes
This work was supported by NIH/NIAID grant R01 AI053108 and NIH/NEI P30 EY021725. Additional Support was provided by an unrestricted grant from Research to Prevent Blindness. CMM was supported, in part, by NIAID training grant, 5T32A1007633-14.
References
- 1.Banatvala JE. Herpes simplex encephalitis. Lancet Infect Dis. 2011;11:80–81. doi: 10.1016/S1473-3099(11)70012-3. [DOI] [PubMed] [Google Scholar]
- 2.Granerod J, Ambrose HE, Davies NW, Clewley JP, Walsh AL, Morgan D, Cunningham R, Zuckerman M, Mutton KJ, Solomon T, Ward KN, Lunn MP, Irani SR, Vincent A, Brown DW, Crowcroft NS U. K. H. P. A. A. o. E. S. Group. Causes of encephalitis and differences in their clinical presentations in England: a multicentre, population-based prospective study. Lancet Infect Dis. 2010;10:835–844. doi: 10.1016/S1473-3099(10)70222-X. [DOI] [PubMed] [Google Scholar]
- 3.Kimberlin DW. Management of HSV encephalitis in adults and neonates: diagnosis, prognosis and treatment. Herpes. 2007;14:11–16. [PubMed] [Google Scholar]
- 4.McGrath N, Anderson NE, Croxson MC, Powell KF. Herpes simplex encephalitis treated with acyclovir: diagnosis and long term outcome. J Neurol Neurosurg Psychiatry. 1997;63:321–326. doi: 10.1136/jnnp.63.3.321. [DOI] [PMC free article] [PubMed] [Google Scholar]
- 5.Kennedy PG, Chaudhuri A. Herpes simplex encephalitis. J Neurol Neurosurg Psychiatry. 2002;73:237–238. doi: 10.1136/jnnp.73.3.237. [DOI] [PMC free article] [PubMed] [Google Scholar]
- 6.Conrady CD, Zheng M, van Rooijen N, Drevets DA, Royer D, Alleman A, Carr DJ. Microglia and a functional type I IFN pathway are required to counter HSV-1-driven brain lateral ventricle enlargement and encephalitis. J Immunol. 2013;190:2807–2817. doi: 10.4049/jimmunol.1203265. [DOI] [PMC free article] [PubMed] [Google Scholar]
- 7.Braun E, Zimmerman T, Hur TB, Reinhartz E, Fellig Y, Panet A, Steiner I. Neurotropism of herpes simplex virus type 1 in brain organ cultures. J Gen Virol. 2006;87:2827–2837. doi: 10.1099/vir.0.81850-0. [DOI] [PubMed] [Google Scholar]
- 8.Chucair-Elliott AJ, Conrady C, Zheng M, Kroll CM, Lane TE, Carr DJ. Microglia-induced IL-6 protects against neuronal loss following HSV-1 infection of neural progenitor cells. Glia. 2014;62:1418–1434. doi: 10.1002/glia.22689. [DOI] [PMC free article] [PubMed] [Google Scholar]
- 9.Marques CP, Cheeran MC, Palmquist JM, Hu S, Urban SL, Lokensgard JR. Prolonged microglial cell activation and lymphocyte infiltration following experimental herpes encephalitis. J Immunol. 2008;181:6417–6426. doi: 10.4049/jimmunol.181.9.6417. [DOI] [PMC free article] [PubMed] [Google Scholar]
- 10.Armien AG, Hu S, Little MR, Robinson N, Lokensgard JR, Low WC, Cheeran MC. Chronic cortical and subcortical pathology with associated neurological deficits ensuing experimental herpes encephalitis. Brain Pathol. 2010;20:738–750. doi: 10.1111/j.1750-3639.2009.00354.x. [DOI] [PMC free article] [PubMed] [Google Scholar]
- 11.Walz MA, Price RW, Notkins AL. Latent ganglionic infection with herpes simplex virus types 1 and 2: viral reactivation in vivo after neurectomy. Science. 1974;184:1185–1187. doi: 10.1126/science.184.4142.1185. [DOI] [PubMed] [Google Scholar]
- 12.Price RW, Katz BJ, Notkins AL. Latent infection of the peripheral ANS with herpes simplex virus. Nature. 1975;257:686–688. doi: 10.1038/257686a0. [DOI] [PubMed] [Google Scholar]
- 13.Imai Y, Apakupakul K, Krause PR, Halford WP, Margolis TP. Investigation of the mechanism by which herpes simplex virus type 1 LAT sequences modulate preferential establishment of latent infection in mouse trigeminal ganglia. J Virol. 2009;83:7873–7882. doi: 10.1128/JVI.00043-09. [DOI] [PMC free article] [PubMed] [Google Scholar]
- 14.Cabrera CV, Wohlenberg C, Openshaw H, Rey-Mendez M, Puga A, Notkins AL. Herpes simplex virus DNA sequences in the CNS of latently infected mice. Nature. 1980;288:288–290. doi: 10.1038/288288a0. [DOI] [PubMed] [Google Scholar]
- 15.Chen SH, Yao HW, Huang WY, Hsu KS, Lei HY, Shiau AL, Chen SH. Efficient reactivation of latent herpes simplex virus from mouse central nervous system tissues. J Virol. 2006;80:12387–12392. doi: 10.1128/JVI.01232-06. [DOI] [PMC free article] [PubMed] [Google Scholar]
- 16.Knotts FB, Cook ML, Stevens JG. Latent herpes simplex virus in the central nervous system of rabbits and mice. J Exp Med. 1973;138:740–744. doi: 10.1084/jem.138.3.740. [DOI] [PMC free article] [PubMed] [Google Scholar]
- 17.Yao HW, Ling P, Chen SH, Tung YY, Chen SH. Factors affecting herpes simplex virus reactivation from the explanted mouse brain. Virology. 2012;433:116–123. doi: 10.1016/j.virol.2012.07.018. [DOI] [PubMed] [Google Scholar]
- 18.Javier RT, Stevens JG, Dissette VB, Wagner EK. A herpes simplex virus transcript abundant in latently infected neurons is dispensable for establishment of the latent state. Virology. 1988;166:254–257. doi: 10.1016/0042-6822(88)90169-9. [DOI] [PubMed] [Google Scholar]
- 19.Ecob-Prince MS, Rixon FJ, Preston CM, Hassan K, Kennedy PG. Reactivation in vivo and in vitro of herpes simplex virus from mouse dorsal root ganglia which contain different levels of latency-associated transcripts. J Gen Virol. 1993;74(Pt 6):995–1002. doi: 10.1099/0022-1317-74-6-995. [DOI] [PubMed] [Google Scholar]
- 20.Liu T, Khanna KM, Chen X, Fink DJ, Hendricks RL. CD8(+) T cells can block herpes simplex virus type 1 (HSV-1) reactivation from latency in sensory neurons. J Exp Med. 2000;191:1459–1466. doi: 10.1084/jem.191.9.1459. [DOI] [PMC free article] [PubMed] [Google Scholar]
- 21.Ma JZ, Russell TA, Spelman T, Carbone FR, Tscharke DC. Lytic gene expression is frequent in HSV-1 latent infection and correlates with the engagement of a cell-intrinsic transcriptional response. PLoS Pathog. 2014;10:e1004237. doi: 10.1371/journal.ppat.1004237. [DOI] [PMC free article] [PubMed] [Google Scholar]
- 22.Verjans GM, Hintzen RQ, van Dun JM, Poot A, Milikan JC, Laman JD, Langerak AW, Kinchington PR, Osterhaus AD. Selective retention of herpes simplex virus-specific T cells in latently infected human trigeminal ganglia. Proc Natl Acad Sci U S A. 2007;104:3496–3501. doi: 10.1073/pnas.0610847104. [DOI] [PMC free article] [PubMed] [Google Scholar]
- 23.Fu H, Qi Y, Tan M, Cai J, Hu X, Liu Z, Jensen J, Qiu M. Molecular mapping of the origin of postnatal spinal cord ependymal cells: evidence that adult ependymal cells are derived from Nkx6.1+ ventral neural progenitor cells. J Comp Neurol. 2003;456:237–244. doi: 10.1002/cne.10481. [DOI] [PubMed] [Google Scholar]
- 24.Abramson JS, Roach ES, Levy HB. Postinfectious encephalopathy after treatment of herpes simplex encephalitis with acyclovir. Pediatr Infect Dis. 1984;3:146–147. doi: 10.1097/00006454-198403000-00016. [DOI] [PubMed] [Google Scholar]
- 25.Kimura H, Aso K, Kuzushima K, Hanada N, Shibata M, Morishima T. Relapse of herpes simplex encephalitis in children. Pediatrics. 1992;89:891–894. [PubMed] [Google Scholar]
- 26.Skoldenberg B, Aurelius E, Hjalmarsson A, Sabri F, Forsgren M, Andersson B, Linde A, Strannegard O, Studahl M, Hagberg L, Rosengren L. Incidence and pathogenesis of clinical relapse after herpes simplex encephalitis in adults. J Neurol. 2006;253:163–170. doi: 10.1007/s00415-005-0941-6. [DOI] [PubMed] [Google Scholar]
- 27.McMillan TM, Papadopoulos H, Cornall C, Greenwood RJ. Modification of severe behaviour problems following herpes simplex encephalitis. Brain Inj. 1990;4:399–406. doi: 10.3109/02699059009026193. [DOI] [PubMed] [Google Scholar]
- 28.Kapur N, Barker S, Burrows EH, Ellison D, Brice J, Illis LS, Scholey K, Colbourn C, Wilson B, Loates M. Herpes simplex encephalitis: long term magnetic resonance imaging and neuropsychological profile. J Neurol Neurosurg Psychiatry. 1994;57:1334–1342. doi: 10.1136/jnnp.57.11.1334. [DOI] [PMC free article] [PubMed] [Google Scholar]
- 29.Conrady CD, Zheng M, Stone DU, Carr DJ. CD8+ T cells suppress viral replication in the cornea but contribute to VEGF-C-induced lymphatic vessel genesis. J Immunol. 2012;189:425–432. doi: 10.4049/jimmunol.1200063. [DOI] [PMC free article] [PubMed] [Google Scholar]
- 30.Mueller SN, Heath W, McLain JD, Carbone FR, Jones CM. Characterization of two TCR transgenic mouse lines specific for herpes simplex virus. Immunol Cell Biol. 2002;80:156–163. doi: 10.1046/j.1440-1711.2002.01071.x. [DOI] [PubMed] [Google Scholar]
- 31.Halford WP, Gebhardt BM, Carr DJ. Persistent cytokine expression in trigeminal ganglion latently infected with herpes simplex virus type 1. J Immunol. 1996;157:3542–3549. [PubMed] [Google Scholar]
- 32.Austin BA, Halford W, Silverman RH, Williams BR, Carr DJ. OAS and PKR are not required for the antiviral effect of Ad:IFN-gamma against acute HSV-1 in primary trigeminal ganglia cultures. J Interferon Cytokine Res. 2006;26:220–225. doi: 10.1089/jir.2006.26.220. [DOI] [PMC free article] [PubMed] [Google Scholar]
- 33.Royer DJ, Zheng M, Conrady CD, Carr DJ. Granulocytes in Ocular HSV-1 Infection: Opposing Roles of Mast Cells and Neutrophils. Investigative ophthalmology & visual science. 2015;56:3763–3775. doi: 10.1167/iovs.15-16900. [DOI] [PMC free article] [PubMed] [Google Scholar]
- 34.Halford WP, Gebhardt BM, Carr DJ. Mechanisms of herpes simplex virus type 1 reactivation. J Virol. 1996;70:5051–5060. doi: 10.1128/jvi.70.8.5051-5060.1996. [DOI] [PMC free article] [PubMed] [Google Scholar]
- 35.Engel JP, Madigan TC, Peterson GM. The transneuronal spread phenotype of herpes simplex virus type 1 infection of the mouse hind footpad. J Virol. 1997;71:2425–2435. doi: 10.1128/jvi.71.3.2425-2435.1997. [DOI] [PMC free article] [PubMed] [Google Scholar]
- 36.Stroop WG, McKendall RR, Battles EJ, Schaefer DC, Jones B. Spread of herpes simplex virus type 1 in the central nervous system during experimentally reactivated encephalitis. Microb Pathog. 1990;8:119–134. doi: 10.1016/0882-4010(90)90076-3. [DOI] [PubMed] [Google Scholar]
- 37.Lo L, Anderson DJ. A Cre-dependent, anterograde transsynaptic viral tracer for mapping output pathways of genetically marked neurons. Neuron. 2011;72:938–950. doi: 10.1016/j.neuron.2011.12.002. [DOI] [PMC free article] [PubMed] [Google Scholar]
- 38.Spivack JG, Fraser NW. Detection of herpes simplex virus type 1 transcripts during latent infection in mice. J Virol. 1987;61:3841–3847. doi: 10.1128/jvi.61.12.3841-3847.1987. [DOI] [PMC free article] [PubMed] [Google Scholar]
- 39.Nicoll MP, Proenca JT, Efstathiou S. The molecular basis of herpes simplex virus latency. FEMS Microbiol Rev. 2012;36:684–705. doi: 10.1111/j.1574-6976.2011.00320.x. [DOI] [PMC free article] [PubMed] [Google Scholar]
- 40.Yao HW, Ling P, Tung YY, Hsu SM, Chen SH. In vivo reactivation of latent herpes simplex virus 1 in mice can occur in the brain before occurring in the trigeminal ganglion. J Virol. 2014;88:11264–11270. doi: 10.1128/JVI.01616-14. [DOI] [PMC free article] [PubMed] [Google Scholar]
- 41.Ramakrishna C, Ferraioli A, Calle A, Nguyen TK, Openshaw H, Lundberg PS, Lomonte P, Cantin EM. Establishment of HSV1 latency in immunodeficient mice facilitates efficient in vivo reactivation. PLoS Pathog. 2015;11:e1004730. doi: 10.1371/journal.ppat.1004730. [DOI] [PMC free article] [PubMed] [Google Scholar]
- 42.Kim DB, Zabierowski S, DeLuca NA. The initiator element in a herpes simplex virus type 1 late-gene promoter enhances activation by ICP4, resulting in abundant late-gene expression. J Virol. 2002;76:1548–1558. doi: 10.1128/JVI.76.4.1548-1558.2002. [DOI] [PMC free article] [PubMed] [Google Scholar]
- 43.Mignone JL, Kukekov V, Chiang AS, Steindler D, Enikolopov G. Neural stem and progenitor cells in nestin-GFP transgenic mice. J Comp Neurol. 2004;469:311–324. doi: 10.1002/cne.10964. [DOI] [PubMed] [Google Scholar]
- 44.Lukashchuk V, Everett RD. Regulation of ICP0-null mutant herpes simplex virus type 1 infection by ND10 components ATRX and hDaxx. J Virol. 2010;84:4026–4040. doi: 10.1128/JVI.02597-09. [DOI] [PMC free article] [PubMed] [Google Scholar]
- 45.Weinstein DL, Walker DG, Akiyama H, McGeer PL. Herpes simplex virus type I infection of the CNS induces major histocompatibility complex antigen expression on rat microglia. J Neurosci Res. 1990;26:55–65. doi: 10.1002/jnr.490260107. [DOI] [PubMed] [Google Scholar]
- 46.Rock RB, Gekker G, Hu S, Sheng WS, Cheeran M, Lokensgard JR, Peterson PK. Role of microglia in central nervous system infections. Clin Microbiol Rev. 2004;17:942–964. doi: 10.1128/CMR.17.4.942-964.2004. table of contents. [DOI] [PMC free article] [PubMed] [Google Scholar]
- 47.Khanna KM, Bonneau RH, Kinchington PR, Hendricks RL. Herpes simplex virus-specific memory CD8+ T cells are selectively activated and retained in latently infected sensory ganglia. Immunity. 2003;18:593–603. doi: 10.1016/s1074-7613(03)00112-2. [DOI] [PMC free article] [PubMed] [Google Scholar]
- 48.Beura LK, Anderson KG, Schenkel JM, Locquiao JJ, Fraser KA, Vezys V, Pepper M, Masopust D. Lymphocytic choriomeningitis virus persistence promotes effector-like memory differentiation and enhances mucosal T cell distribution. J Leukoc Biol. 2015;97:217–225. doi: 10.1189/jlb.1HI0314-154R. [DOI] [PMC free article] [PubMed] [Google Scholar]
- 49.Casey KA, Fraser KA, Schenkel JM, Moran A, Abt MC, Beura LK, Lucas PJ, Artis D, Wherry EJ, Hogquist K, Vezys V, Masopust D. Antigen-independent differentiation and maintenance of effector-like resident memory T cells in tissues. J Immunol. 2012;188:4866–4875. doi: 10.4049/jimmunol.1200402. [DOI] [PMC free article] [PubMed] [Google Scholar]
- 50.Mackay LK, Rahimpour A, Ma JZ, Collins N, Stock AT, Hafon ML, Vega-Ramos J, Lauzurica P, Mueller SN, Stefanovic T, Tscharke DC, Heath WR, Inouye M, Carbone FR, Gebhardt T. The developmental pathway for CD103(+)CD8+ tissue-resident memory T cells of skin. Nat Immunol. 2013;14:1294–1301. doi: 10.1038/ni.2744. [DOI] [PubMed] [Google Scholar]
- 51.Wakim LM, Woodward-Davis A, Bevan MJ. Memory T cells persisting within the brain after local infection show functional adaptations to their tissue of residence. Proc Natl Acad Sci U S A. 2010;107:17872–17879. doi: 10.1073/pnas.1010201107. [DOI] [PMC free article] [PubMed] [Google Scholar]
- 52.Park CO, Kupper TS. The emerging role of resident memory T cells in protective immunity and inflammatory disease. Nat Med. 2015;21:688–697. doi: 10.1038/nm.3883. [DOI] [PMC free article] [PubMed] [Google Scholar]
- 53.Turner DL, Farber DL. Mucosal resident memory CD4 T cells in protection and immunopathology. Front Immunol. 2014;5:331. doi: 10.3389/fimmu.2014.00331. [DOI] [PMC free article] [PubMed] [Google Scholar]
- 54.Hu Z, Blackman MA, Kaye KM, Usherwood EJ. Functional heterogeneity in the CD4+ T cell response to murine gamma-herpesvirus 68. J Immunol. 2015;194:2746–2756. doi: 10.4049/jimmunol.1401928. [DOI] [PMC free article] [PubMed] [Google Scholar]
- 55.Wallace ME, Keating R, Heath WR, Carbone FR. The cytotoxic T-cell response to herpes simplex virus type 1 infection of C57BL/6 mice is almost entirely directed against a single immunodominant determinant. J Virol. 1999;73:7619–7626. doi: 10.1128/jvi.73.9.7619-7626.1999. [DOI] [PMC free article] [PubMed] [Google Scholar]
- 56.St Leger AJ, Peters B, Sidney J, Sette A, Hendricks RL. Defining the herpes simplex virus-specific CD8+ T cell repertoire in C57BL/6 mice. J Immunol. 2011;186:3927–3933. doi: 10.4049/jimmunol.1003735. [DOI] [PMC free article] [PubMed] [Google Scholar]
- 57.St Leger AJ, Jeon S, Hendricks RL. Broadening the repertoire of functional herpes simplex virus type 1-specific CD8+ T cells reduces viral reactivation from latency in sensory ganglia. J Immunol. 2013;191:2258–2265. doi: 10.4049/jimmunol.1300585. [DOI] [PMC free article] [PubMed] [Google Scholar]
- 58.Vollstedt S, Arnold S, Schwerdel C, Franchini M, Alber G, Di Santo JP, Ackermann M, Suter M. Interplay between alpha/beta and gamma interferons with B, T, and natural killer cells in the defense against herpes simplex virus type 1. J Virol. 2004;78:3846–3850. doi: 10.1128/JVI.78.8.3846-3850.2004. [DOI] [PMC free article] [PubMed] [Google Scholar]
- 59.Rosato PC, Leib DA. Neuronal Interferon Signaling Is Required for Protection against Herpes Simplex Virus Replication and Pathogenesis. PLoS Pathog. 2015;11:e1005028. doi: 10.1371/journal.ppat.1005028. [DOI] [PMC free article] [PubMed] [Google Scholar]
- 60.Wang JP, Bowen GN, Zhou S, Cerny A, Zacharia A, Knipe DM, Finberg RW, Kurt-Jones EA. Role of specific innate immune responses in herpes simplex virus infection of the central nervous system. J Virol. 2012;86:2273–2281. doi: 10.1128/JVI.06010-11. [DOI] [PMC free article] [PubMed] [Google Scholar]
- 61.Kroll CM, Zheng M, Carr DJ. Enhanced resistance of CXCR3 deficient mice to ocular HSV-1 infection is due to control of replication in the brain ependyma. J Neuroimmunol. 2014;276:219–223. doi: 10.1016/j.jneuroim.2014.08.005. [DOI] [PMC free article] [PubMed] [Google Scholar]
- 62.Wherry EJ, Kurachi M. Molecular and cellular insights into T cell exhaustion. Nat Rev Immunol. 2015;15:486–499. doi: 10.1038/nri3862. [DOI] [PMC free article] [PubMed] [Google Scholar]
- 63.Crespo J, Sun H, Welling TH, Tian Z, Zou W. T cell anergy, exhaustion, senescence, and stemness in the tumor microenvironment. Curr Opin Immunol. 2013;25:214–221. doi: 10.1016/j.coi.2012.12.003. [DOI] [PMC free article] [PubMed] [Google Scholar]
- 64.Vali B, Jones RB, Sakhdari A, Sheth PM, Clayton K, Yue FY, Gyenes G, Wong D, Klein MB, Saeed S, Benko E, Kovacs C, Kaul R, Ostrowski MA. HCV-specific T cells in HCV/HIV co-infection show elevated frequencies of dual Tim-3/PD-1 expression that correlate with liver disease progression. Eur J Immunol. 2010;40:2493–2505. doi: 10.1002/eji.201040340. [DOI] [PubMed] [Google Scholar]
- 65.Steiner I. Herpes simplex virus encephalitis: new infection or reactivation? Curr Opin Neurol. 2011;24:268–274. doi: 10.1097/WCO.0b013e328346be6f. [DOI] [PubMed] [Google Scholar]
- 66.Utley TF, Ogden JA, Gibb A, McGrath N, Anderson NE. The long-term neuropsychological outcome of herpes simplex encephalitis in a series of unselected survivors. Neuropsychiatry Neuropsychol Behav Neurol. 1997;10:180–189. [PubMed] [Google Scholar]
- 67.Cantin EM, Hinton DR, Chen J, Openshaw H. Gamma interferon expression during acute and latent nervous system infection by herpes simplex virus type 1. J Virol. 1995;69:4898–4905. doi: 10.1128/jvi.69.8.4898-4905.1995. [DOI] [PMC free article] [PubMed] [Google Scholar]
- 68.Liu T, Tang Q, Hendricks RL. Inflammatory infiltration of the trigeminal ganglion after herpes simplex virus type 1 corneal infection. J Virol. 1996;70:264–271. doi: 10.1128/jvi.70.1.264-271.1996. [DOI] [PMC free article] [PubMed] [Google Scholar]
- 69.Shimeld C, Whiteland JL, Nicholls SM, Grinfeld E, Easty DL, Gao H, Hill TJ. Immune cell infiltration and persistence in the mouse trigeminal ganglion after infection of the cornea with herpes simplex virus type 1. J Neuroimmunol. 1995;61:7–16. doi: 10.1016/0165-5728(95)00068-d. [DOI] [PubMed] [Google Scholar]
- 70.Rock DL, Fraser NW. Detection of HSV-1 genome in central nervous system of latently infected mice. Nature. 1983;302:523–525. doi: 10.1038/302523a0. [DOI] [PubMed] [Google Scholar]
- 71.Smith C, Lachmann RH, Efstathiou S. Expression from the herpes simplex virus type 1 latency-associated promoter in the murine central nervous system. J Gen Virol. 2000;81:649–662. doi: 10.1099/0022-1317-81-3-649. [DOI] [PubMed] [Google Scholar]
- 72.Lewandowski G, Zimmerman MN, Denk LL, Porter DD, Prince GA. Herpes simplex type 1 infects and establishes latency in the brain and trigeminal ganglia during primary infection of the lip in cotton rats and mice. Arch Virol. 2002;147:167–179. doi: 10.1007/s705-002-8309-9. [DOI] [PubMed] [Google Scholar]
- 73.Fraser NW, Lawrence WC, Wroblewska Z, Gilden DH, Koprowski H. Herpes simplex type 1 DNA in human brain tissue. Proc Natl Acad Sci U S A. 1981;78:6461–6465. doi: 10.1073/pnas.78.10.6461. [DOI] [PMC free article] [PubMed] [Google Scholar]
- 74.Yamada S, Kameyama T, Nagaya S, Hashizume Y, Yoshida M. Relapsing herpes simplex encephalitis: pathological confirmation of viral reactivation. J Neurol Neurosurg Psychiatry. 2003;74:262–264. doi: 10.1136/jnnp.74.2.262. [DOI] [PMC free article] [PubMed] [Google Scholar]
- 75.Croen KD, Ostrove JM, Dragovic LJ, Smialek JE, Straus SE. Latent herpes simplex virus in human trigeminal ganglia. Detection of an immediate early gene “anti-sense” transcript by in situ hybridization. N Engl J Med. 1987;317:1427–1432. doi: 10.1056/NEJM198712033172302. [DOI] [PubMed] [Google Scholar]
- 76.Deatly AM, Spivack JG, Lavi E, Fraser NW. RNA from an immediate early region of the type 1 herpes simplex virus genome is present in the trigeminal ganglia of latently infected mice. Proc Natl Acad Sci U S A. 1987;84:3204–3208. doi: 10.1073/pnas.84.10.3204. [DOI] [PMC free article] [PubMed] [Google Scholar]
- 77.Feldman LT, Ellison AR, Voytek CC, Yang L, Krause P, Margolis TP. Spontaneous molecular reactivation of herpes simplex virus type 1 latency in mice. Proc Natl Acad Sci U S A. 2002;99:978–983. doi: 10.1073/pnas.022301899. [DOI] [PMC free article] [PubMed] [Google Scholar]
- 78.Kramer MF, Coen DM. Quantification of transcripts from the ICP4 and thymidine kinase genes in mouse ganglia latently infected with herpes simplex virus. J Virol. 1995;69:1389–1399. doi: 10.1128/jvi.69.3.1389-1399.1995. [DOI] [PMC free article] [PubMed] [Google Scholar]
- 79.Maillet S, Naas T, Crepin S, Roque-Afonso AM, Lafay F, Efstathiou S, Labetoulle M. Herpes simplex virus type 1 latently infected neurons differentially express latency-associated and ICP0 transcripts. J Virol. 2006;80:9310–9321. doi: 10.1128/JVI.02615-05. [DOI] [PMC free article] [PubMed] [Google Scholar]
- 80.Stevens JG, Wagner EK, Devi-Rao GB, Cook ML, Feldman LT. RNA complementary to a herpesvirus alpha gene mRNA is prominent in latently infected neurons. Science. 1987;235:1056–1059. doi: 10.1126/science.2434993. [DOI] [PubMed] [Google Scholar]
- 81.Wherry EJ, Blattman JN, Murali-Krishna K, van der Most R, Ahmed R. Viral persistence alters CD8 T-cell immunodominance and tissue distribution and results in distinct stages of functional impairment. J Virol. 2003;77:4911–4927. doi: 10.1128/JVI.77.8.4911-4927.2003. [DOI] [PMC free article] [PubMed] [Google Scholar]
- 82.Wherry EJ, Ha SJ, Kaech SM, Haining WN, Sarkar S, Kalia V, Subramaniam S, Blattman JN, Barber DL, Ahmed R. Molecular signature of CD8+ T cell exhaustion during chronic viral infection. Immunity. 2007;27:670–684. doi: 10.1016/j.immuni.2007.09.006. [DOI] [PubMed] [Google Scholar]
- 83.De Regge N, Van Opdenbosch N, Nauwynck HJ, Efstathiou S, Favoreel HW. Interferon alpha induces establishment of alphaherpesvirus latency in sensory neurons in vitro. PLoS One. 2010;5 doi: 10.1371/journal.pone.0013076. [DOI] [PMC free article] [PubMed] [Google Scholar]
- 84.Harle P, Sainz B, Jr, Carr DJ, Halford WP. The immediate-early protein, ICP0, is essential for the resistance of herpes simplex virus to interferon-alpha/beta. Virology. 2002;293:295–304. doi: 10.1006/viro.2001.1280. [DOI] [PubMed] [Google Scholar]
- 85.Halford WP, Weisend C, Grace J, Soboleski M, Carr DJ, Balliet JW, Imai Y, Margolis TP, Gebhardt BM. ICP0 antagonizes Stat 1-dependent repression of herpes simplex virus: implications for the regulation of viral latency. Virol J. 2006;3:44. doi: 10.1186/1743-422X-3-44. [DOI] [PMC free article] [PubMed] [Google Scholar]
- 86.Ning S, Huye LE, Pagano JS. Regulation of the transcriptional activity of the IRF7 promoter by a pathway independent of interferon signaling. J Biol Chem. 2005;280:12262–12270. doi: 10.1074/jbc.M404260200. [DOI] [PubMed] [Google Scholar]
- 87.Harkness JM, Kader M, DeLuca NA. Transcription of the herpes simplex virus 1 genome during productive and quiescent infection of neuronal and nonneuronal cells. J Virol. 2014;88:6847–6861. doi: 10.1128/JVI.00516-14. [DOI] [PMC free article] [PubMed] [Google Scholar]
- 88.Mayer SA, Claassen J, Lokin J, Mendelsohn F, Dennis LJ, Fitzsimmons BF. Refractory status epilepticus: frequency, risk factors, and impact on outcome. Arch Neurol. 2002;59:205–210. doi: 10.1001/archneur.59.2.205. [DOI] [PubMed] [Google Scholar]
- 89.Sellner J, Trinka E. Seizures and epilepsy in herpes simplex virus encephalitis: current concepts and future directions of pathogenesis and management. J Neurol. 2012;259:2019–2030. doi: 10.1007/s00415-012-6494-6. [DOI] [PubMed] [Google Scholar]
- 90.Rotschafer JH, Hu S, Little M, Erickson M, Low WC, Cheeran MC. Modulation of neural stem/progenitor cell proliferation during experimental Herpes Simplex encephalitis is mediated by differential FGF-2 expression in the adult brain. Neurobiol Dis. 2013;58:144–155. doi: 10.1016/j.nbd.2013.05.018. [DOI] [PMC free article] [PubMed] [Google Scholar]