

Abstract
Background
Lower body-mass index (BMI) in late life has been associated with an increased risk of dementia, and weight loss has been associated with more rapid decline in Alzheimer disease (AD) dementia.
Objective
To explore the association between BMI and cortical amyloid burden in clinically normal (CN) elderly at risk for AD dementia.
Methods
Cross-sectional analyses were completed using baseline data from the Harvard Aging Brain Study, consisting of 280 community-dwelling CN older adults aged 62–90. Assessments included medical histories and physical exam, Pittsburgh compound B (PiB) positron emission tomography (PET) amyloid imaging, and apolipoprotein E ɛ4 (APOE4) genotyping. For the primary analysis, a general linear regression model was used to evaluate the association of BMI with PiB retention. Covariates included age, sex, years of education, and APOE4 carrier status. Secondary analyses were performed for BMI subdivisions (normal, overweight, obese), APOE4 carriers, and BMI × APOE4 interaction.
Results
In the primary analysis, greater PiB retention was associated with lower BMI (β=−0.14, p=0.02). In the secondary analyses, APOE4 carrier status (β=−0.27, p=0.02) and normal BMI (β=−0.25, p=0.01), as opposed to overweight or obese BMI, were associated with greater PiB retention. The BMI × APOE4 interaction was also significant (β=−0.14, p=0.04).
Conclusions
This finding offers new insight into the role of BMI at the preclinical stage of AD, wherein lower BMI late in life is associated with greater cortical amyloid burden. Future studies are needed to elucidate the mechanism behind this association, especially in those with lower BMI who are APOE4 carriers.
Keywords: Alzheimer’s disease, amyloid, apolipoprotein E, body-mass index, clinically normal elderly, Pittsburgh compound B, positron emission tomography
Introduction
An obesity paradox [1] exists in Alzheimer disease (AD) and dementia. Midlife obesity can increase the risk of late-life dementia [2, 3], but lower late-life body-mass index (BMI) is also related to worse AD outcomes. Higher late-life BMI is associated with decreased risk of dementia [4, 5], better cognition [6], slower progression of AD [7], and decreased mortality [8].
Weight loss over the clinical course of AD has been shown in several large cohort studies [9–13]. Early reports focused on those only in the dementia phase of AD, but later studies have explored earlier stages of the disease [7]. Patients with AD enter the dementia phase at a lower weight, and this weight loss increases mortality [13].
A 2007 study has suggested that weight loss for all causes of dementia may start 10–20 years prior to diagnosis [11]. Autopsy studies have reported that AD pathology has been associated with low body weight [14, 15]. An inverse relationship was reported by in studies using the Alzheimer’s Disease Neuroimaging Initiative (ADNI) database for BMI and AD biomarkers, including cortical amyloid as measured by Pittsburgh compound B positron emission tomography (PiB-PET) and cerebrospinal fluid (CSF) amyloid-beta and tau markers [16–18]. Apolipoprotein ɛ4 (APOE4) may also be associated with weight loss in AD [19, 20].
In recent years, the concept of preclinical AD has been gaining traction leading to the first proposed research criteria for preclinical AD [21]. Based on these criteria, elderly individuals who are cognitively normal and have elevated amyloid as visualized by amyloid PET or measured in the CSF are hypothesized to be in the preclinical stage of AD. Using that definition, multiple recent studies have demonstrated greater rate of cognitive decline over time in cognitively normal individuals with elevated amyloid at baseline, especially in the presence of an APOE4 allele or proxies of neurodegeneration, when compared to individuals without elevated amyloid [22–25].
In the current study, we explored the relationship between BMI and cortical amyloid burden visualized by PiB-PET in clinically normal (CN) elderly participating in the Harvard Aging Brain Study (HABS), which leverages multi-modality imaging biomarkers and extensive clinical assessments in older adults at risk for preclinical AD. We aimed to investigate whether the obesity paradox is already evident in the preclinical phase of AD. Specifically, we hypothesized that in CN elderly, lower BMI will be associated with greater cortical amyloid burden, supporting the late-life component of the obesity paradox described above; this association will also be evident in the group of individuals with elevated amyloid burden above a specific threshold, consistent with the presence of preclinical AD; and this association will be modified by the presence of APOE4, such that APOE4 carriers with lower BMI will have greater amyloid burden.
Methods
Participants
Baseline data from 280 participants in HABS, a longitudinal observational study of normal cognitive aging and preclinical AD at the Massachusetts General Hospital (MGH) were included in this study. Inclusion criteria for HABS were as follows: English-speaking, community dwelling, age 62–90, good general medical health as determined by a study physician after extensive review of medical history, and normal cognition based on a Clinical Dementia Rating (CDR) [26] global score of 0, education-adjusted Mini-Mental State Exam (MMSE) [27] score of 27–30, and normal education-adjusted memory performance on the Logical Memory delayed paragraph recall of the Wechsler Memory Scale-Revised [28]. All participants underwent informed consent approved by the Partners Human Research Committee prior to undergoing study procedures.
The baseline visit involved a comprehensive review of participants’ medical, neurological, and psychiatric health to confirm their status as clinically normal. A survey of the medical history, a general physical and neurological exam performed by a study physician, vital signs, laboratory tests, and neuroimaging studies were completed for each participant. Exclusion criteria included serious and unstable medical, neurological, or psychiatric illness, substance use, history of traumatic brain injury, extensive cerebrovascular disease visualized on magnetic resonance imaging (MRI), and a Modified Hachinski Ischemic Scale score of ≥ 4. However, participants with stable, treated vascular risk factors, such as hyperlipidemia, hypertension, and diabetes, or cardiovascular disease were not excluded.
Body-Mass Index data
Each participant had their height measured in inches and weight measured in pounds. These values were then converted to metric units in order to calculate BMI, which is kilograms divided by meters squared. The study used the standard formula for calculating BMI as outlined by the National Institute of Health (NIH) [29]. BMI subdivisions for secondary analysis were also taken from NIH guidelines for application to participants’ baseline data. They were characterized as follows: underweight (BMI < 18.5), normal (BMI 18.5–24.9), overweight (25–29.9), and obese (BMI > 30). Analyses using weight only and BMI-squared were also performed, and results were nearly identical to those using BMI (data not shown).
APOE data
APOE4 genotyping was performed for each participant, and APOE4 carrier status was determined by having at least one APOE4 allele.
PET data
PiB has been used in the past decade to quantify fibrillar cortical amyloid burden. Participants underwent PiB-PET imaging at baseline at the MGH PET facility. C11-PiB synthesis and imaging, using a Siemens/CTI ECAT EXACT HR+ PET scanner (3D mode; 63 image planes; 15.2 cm axial field of view; 5.6 mm transaxial resolution and 2.4 mm slice interval; 39 frames: 8 × 15 s,4 × 60 s,27 × 120 s), were performed as previously reported [30,[31,[32,[33]. Briefly, 8.5 to 15 mCi of C11-PiB was injected intravenously as a bolus with dynamic acquisition occurring for 60 min immediately after. PET data were reconstructed and attenuation corrected. PiB distribution volume ratio (DVR) using the Logan graphical analysis technique (cerebellar grey reference) was calculated for an aggregate of cortical regions that typically have elevated PiB retention in AD dementia, including frontal, lateral parietal and temporal, and retrosplenial cortices. PiB retention was used as a continuous variable and was positively skewed. Therefore, higher PiB values may have given more weight to the analyses proposed. Log transformation improved the skewness, but results were essentially the same (data not shown).
Statistical analyses
All statistical analyses were performed using IBM SPSS version 22. We employed general linear regression models incorporating BMI and PiB retention. The primary model evaluated the association between BMI (predictor of interest) and PiB retention (dependent variable) after adjusting for covariates. PiB was chosen as the dependent variable for ease of interpretation of BMI among standard controls for PiB.
Three secondary models were evaluated: 1) the association of continuous measures of BMI and PiB within BMI categories (normal, overweight, obese), 2) the association of continuous BMI and PiB within groups defined by APOE4 carrier status, and 3) the association of continuous BMI and PiB including an interaction term for BMI and APOE4 status.
Demographic covariates included age, sex, and years of education. All analyses were also adjusted for APOE4 carrier status, except for secondary model 2 in which groups were divided based on APOE4 carrier status.
Results
Baseline characteristics
All 280 subjects were clinically normal at baseline by CDR, MMSE, and logical memory score (see Table 1). They were on average college-educated, 59% female, and 73.7 ± 6.2 years old. Twenty-nine percent were APOE4 carriers. Subjects were roughly average for the American population in terms of prevalence for hypertension (59%) and statin use (43%), but had less diabetes mellitus type 2 (9%) and active smoking (4%). BMI was normally distributed, with a mean of 26.9 (range 16.3–40.7). Mean cortical PiB retention was 1.17 (range 0.95–1.82).
Table 1.
Baseline characteristics of participants in the Harvard Aging Brain Study (n=280).
| Characteristic | Mean (Range) |
|---|---|
|
| |
| Age | 73.7 (62.5–90 years) |
|
| |
| Sex | Females 58.8% (n=164) |
| Males 41.2% (n=116) | |
|
| |
| Years of Education | 15.8 (6–20 years) |
|
| |
| Clinical Dementia Rating global score | 0 |
|
| |
| Mini-Mental State Exam | 29 (25–30) |
|
| |
| APOE4 Carriers | 28.9% |
|
| |
| Body-Mass Index | 26.9 (16–41) |
| - Underweight (BMI<18.5) | 2.5% (n=7) |
| - Normal (BMI 18.5–24.9) | 31.8% (n=89) |
| - Overweight (BMI 25–29.9) | 41.4% (n=116) |
| - Obese (BMI>30) | 24.3% (n=68) |
|
| |
| Statin Use | 43.6% |
|
| |
| Antihypertensive Use | 58.2% |
|
| |
| Smoking | 4.3% |
|
| |
| Diabetes mellitus | 8.8% |
|
| |
| Cortical PiB retention (DVR) | 1.17 (0.95–1.82) |
APOE4 (apolipoprotein ɛ4), BMI (body-mass index), DVR (distribution volume ratio), PiB (Pittsburgh Compound B).
BMI subdivisions
Two-thirds of the sample was overweight or obese (Table 1). Only 2.5% (n=7) were underweight. These underweight participants were excluded from further BMI subdivision analyses given lack of power. The BMI distribution revealed 31.8% were normal weight, 41.4% were overweight, and 24.3% were obese. APOE4 carrier status was nearly identical in all BMI subdivisions, about 30%. There was no significant difference in other baseline characteristics between BMI subdivisions except for age (overweight participants were older than normal participants who were older than obese participants, p=0.001).
Primary analysis
Lower BMI scores were associated with greater PiB retention (β=−0.14, p=0.02, model R2=0.19) in the linear regression model adjusted for age, sex, years of education, and APOE4 carrier status (see Figure 1). APOE4 carrier status was also significant in the model (β=0.38, p<0.001), with APOE4 carriers having greater PiB retention compared to non-carriers as expected. None of the demographic covariates were significant. When PiB retention was dichotomized into positive (DVR≥1.2) and negative (DVR<1.2), BMI was still significant in the model, but more so in the PiB-positive group (β=−0.32, p=0.009, model R2=0.15).
Figure 1.
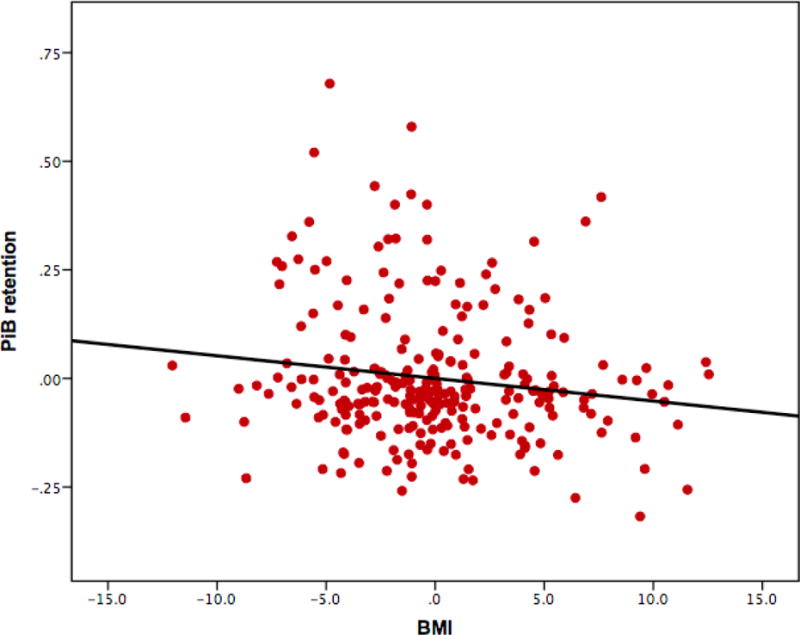
Partial regression plot from primary analysis of BMI and PiB retention (DVR). The model was adjusted for age, sex, years of education, and APOE4 carrier status. BMI and APOE4 were significant predictors. See text for details. APOE4 (apolipoprotein ɛ4), BMI (body-mass index), DVR (distribution volume ratio), PiB (Pittsburgh Compound B).
Secondary analyses
Model 1 with BMI subdivisions revealed that the negative association (lower BMI scores associated with greater PiB retention) remained significant only in the normal BMI subdivision model (β=−0.25, p=0.01). Those in the overweight category (β=−0.15, p=0.08) and obese category (β=−0.10, p=0.47) did not have a significant relationship between BMI and PiB retention (see Table 2 and Figures 2 and 3).
Table 2.
Secondary analyses of BMI and PiB retention.
| Dependent Variable: PiB PET | β | P-value | |
|---|---|---|---|
| Model 1* | Normal: BMI | −0.253 | 0.01 |
| Overweight: BMI | −0.154 | 0.08 | |
| Obese: BMI | −0.098 | 0.47 | |
| Model 2 | APOE4 carrier: BMI | −0.267 | 0.02 |
| APOE4 non-carrier: BMI | −0.074 | 0.33 | |
| Model 3 | BMI | −0.054 | 0.45 |
| APOE4 carrier | 0.381 | <0.001 | |
| BMI × APOE4 interaction term | −0.142 | 0.04 | |
All models are adjusted for age, sex, and years of education.
Model 1 is also adjusted for APOE4 carrier status.
APOE4 (apolipoprotein ɛ4), BMI (body-mass index), PET (positron emission tomography), PiB (Pittsburgh Compound B).
Figure 2.

Secondary analysis - BMI and PiB retention (DVR) association within BMI subdivisions. The scatter plot reflects raw values for ease of interpretation. Underweight (blue) subjects are reflected here at the far left, but linear extrapolation is not shown due to the low number of participants. Participants with normal BMI are green. Participants with overweight BMI are red. Participants with obese BMI are purple. BMI (body-mass index), DVR (distribution volume ratio), PiB (Pittsburgh Compound B).
Figure 3.


Secondary analysis - BMI and PiB retention (DVR) association within BMI subdivisions shown separately for each subdivision. The scatter plots reflect raw values for ease of interpretation. Participants with normal BMI are green (A). Participants with overweight BMI are red (B). Participants with obese BMI are purple (C). BMI (body-mass index), DVR (distribution volume ratio), PiB (Pittsburgh Compound B).
Model 2 with APOE4 carrier status revealed that the BMI-PiB relationship is only significant in those who are APOE4 carriers (β=−0.27, p=0.02). The relationship in APOE4 non-carriers was not significant (β=−0.07, p=0.33) (see Table 2 and Figure 4).
Figure 4.
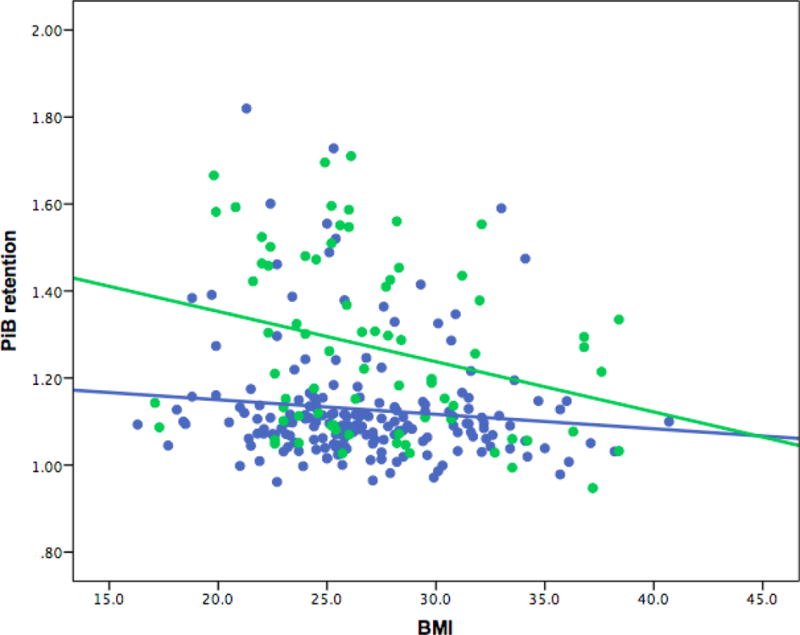
Secondary Analysis - BMI and PiB retention (DVR) association divided by APOE ɛ4 carrier status. The scatter plot reflects raw values for ease of interpretation. The model was adjusted for age, sex, and years of education. Participants who are APOE4 carriers are green. Participants who are APOE4 non-carriers are blue. APOE4 (apolipoprotein ɛ4), BMI (body-mass index), DVR (distribution volume ratio), PiB (Pittsburgh Compound B).
Model 3 added a BMI × APOE4 interaction term to the primary model in order to evaluate if the interaction is stronger than the main effect of BMI alone. This interaction term was significant (β=−0.14, p=0.04), whereas BMI alone was not (β=−0.05, p=0.45). As expected, APOE4 remained significant in the model (β=−0.38, p<0.001) (see Table 2).
Other secondary models were explored, including those divided by sex and PiB-positivity, but they were either not significant, as it was for the model divided by sex, or did not shed further insight into the BMI-PiB association (revealing similar results to those reported above).
Discussion
We found that lower baseline late-life BMI was associated with greater PiB retention, a well-established biomarker for cortical amyloid deposition and increased risk for future development of AD dementia. Our cross-sectional analyses included only CN elderly and support the result found in the study using the ADNI database, which analyzed CN, mild cognitive impairment (MCI), and mild AD dementia participants [18]. Notably, our CN sample was about twice as large as the largest ADNI CN sample used in a study employing CSF measures of amyloid-beta [16], and despite having fewer participants with elevated amyloid burden in our sample due to not including participants with MCI and mild AD dementia, we were able to find an association with BMI. When divided into BMI categories, the association was only significant at lower (normal) BMI levels, as opposed to higher BMI levels (overweight and obese) in late-life, again consistent with the ADNI results. The relationship between BMI and PiB retention was also seen for those who are APOE4 carriers, and the significant interaction of BMI with APOE4 in predicting PiB retention suggests another possible route for APOE4 to affect amyloid levels in the brain. These analyses support the obesity paradox that has been observed across different studies where mid-life higher BMI increases risk of dementia, while late-life lower BMI increases risk of dementia [1]. In the current study, the presence of high amyloid burden in cognitively normal elderly, which is consistent with the presence of preclinical AD, is the marker of increased dementia risk, and we are able to relate that directly to BMI. Furthermore, these findings demonstrate that BMI can be independently associated with amyloid status and has the potential to generate further hypotheses of biomarker dynamics in AD pathophysiology.
Change in BMI may reflect the presence of other alterations connected to preclinical AD. First, olfactory dysfunction [34] commonly occurs in those who eventually develop AD dementia. The connection between olfactory tracts and lower BMI likely centers around the medial temporal lobe, specifically the entorhinal cortex. This pathway warrants future analysis. We recently reported that among CN participants in the HABS cohort, which was used in the current analyses, in those with elevated cortical amyloid, there was an association between reduced entorhinal cortex thickness and worse odor identification [35].
Second, several studies have connected the syndrome of frailty to AD pathophysiology [36–38]. Frailty is a well-established phenomenon in geriatric medicine wherein certain physical markers, such as lower BMI, slowed gait speed, and loss of grip strength, are independently related to poorer medical outcomes. In our sample, all subjects were found to be cognitively normal. As we follow these individuals over time we may determine if examining late-life BMI alone, eventually predicts who will develop frailty and possibly symptoms of AD.
Third, neuropsychiatric symptoms are common in the entire spectrum of AD, including the preclinical stage [39, 40]. Those with lower BMI and higher amyloid burden may have been suffering from depressive symptoms prior to the onset of cognitive decline. Evaluating the effects of syndromal, and even subsyndromal psychiatric symptoms, in the preclinical phase may help further unravel this association between BMI and amyloid.
Ultimately, exploring the relationship between BMI and amyloid burden could enhance ongoing AD clinical trials and future clinical care [21]. As a potential marker of disease, BMI may fit well into the current research scheme of preclinical AD as a way to quantify risk of progressing to later stages of AD. Combining multiple variables, including BMI, may help researchers to develop an AD risk score similar to those currently used in cardiovascular medicine. Bridging APOE4 with BMI may generate more hypotheses about AD pathophysiology [41].
The strengths of this study are the number of clinically normal adults who had amyloid burden measured by PiB PET, as well as the secondary analyses that evaluated APOE4 effect and its interaction with BMI. HABS has been one of a handful of large studies successfully enrolling participants who were all clinically normal at baseline and characterizing them with multiple AD biomarkers to track longitudinal change. Future studies of BMI will be able to leverage this baseline data, as well as harmonize with other datasets that have been similarly structured. From the literature, we had hypothesized that APOE4 may play a role outside of its effect on amyloid, which led to this analysis with BMI.
It is important to note that our study had several limitations. All participants were eligible for enrolling into the study only if they were medically stable and did not have extensive cerebrovascular disease, which may have introduced a selection bias. However, the frequency of vascular risk factors in our participants was mostly comparable to that of the general population. The assessment of the combined effect of such multiple vascular risk factors on AD biomarkers is beyond the scope of the current study and will be the focus of future analyses. It is also reassuring that the inverse relationship between late-life BMI and PiB was also found in ADNI, a well-validated multi-center cohort.
Second, adiposity can be measured in many ways, and BMI is only one method [42–44]. Though BMI has been the most conventional way to measure adiposity, some researchers have begun to evaluate lean body mass and waist-to-hip ratio in connection to AD or other dementia syndromes. The goal in those studies has been to try to unravel some of the discrepancies between BMI levels in predicting future dementia. We agree that adiposity changes as one gets older, and future research may help to ascertain a more accurate measurement of adiposity.
Third, we have only begun to analyze BMI with AD biomarkers. Though PiB retention was used in this study, BMI may also have an association with other biomarkers, such as CSF Amyloid-beta, total tau, phospho-tau, in vivo tau PET imaging, as well as other PET and MRI measures. Analyzing whether lower late-life BMI scores predict greater tau burden in the neocortex may support the hypothesis that BMI and tau are associated. Assessment of the strength of the relationships between BMI, amyloid, and tau would also help to isolate the pathology in question.
Fourth, due to the known significant association between APOE4 carrier status and amyloid burden in CN elderly, there is a concern that these markers of AD are measuring the same thing. As expected, in our sample there was a strong association between APOE4 and PiB retention (p<0.0001). However, APOE4 explained only 15% of the variance of PiB retention. Therefore, although these two measures are clearly associated, they do have independent effects on individuals at risk for AD and it is statistically appropriate to include them in same model as we did in our attempts to determine the association with BMI.
Finally, the timing of change in BMI can be further analyzed by looking at participants in each of the preclinical stages of AD: stage 1 consists of presence of elevated amyloid only; stage 2 consists of elevated amyloid and evidence of neurodegeneration; and stage 3 consists of elevated amyloid, neurodegeneration, and subtle cognitive decline not significant enough to meet criteria for MCI [21]. One hypothesis is that BMI drops significantly in stage 3 where minimal symptoms are present rather than stage 2, thus adding another phenotype that can be tracked in the clinical setting and incorporated into clinical trials. We currently do not have information about when participants’ weight started declining. This is a critical piece of information that likely explains much of the association we reported. Therefore, longitudinal follow-up focused on change in BMI, AD biomarkers, and cognitive function will more decisively confirm or refute the current cross-sectional results.
In summary, lower baseline late-life BMI was found to be associated with greater cortical amyloid burden in the HABS cohort of clinically normal older individuals, and this relationship was modified by APOE4 carrier status. Future longitudinal studies can further assess the association of BMI levels with amyloid, as well as other AD biomarkers.
Acknowledgments
We would like to acknowledge other Members of the Sperling and Johnson Lab Groups: Alexander Dagley, BA; Catherine Munro, BA; Margaret Chute, BA; Tamy-Fee Meneide, BA; Sehily Jaimes, BA; Sarah Wigman, BA; Jasmeer Chhatwal, MD, PhD; Donald McLaren, PhD; Trey Hedden, PhD; J. Alex Becker, PhD.
This study was supported by the Harvard Aging Brain Study (NIH/NIA P01 AG036694, R01 AG037497, and R01 AG046396), K23 AG033634, K24 AG035007, and the Massachusetts Alzheimer’s Disease Research Center (P50 AG005134). The funding sources had no role in the design and conduct of the study; collection, management, analysis, and interpretation of the data; and preparation, review, or approval of the manuscript.
Footnotes
Results of this manuscript were presented at the 9th Human Amyloid Imaging meeting on January 15, 2015.
The authors have no relevant conflicts of interest to disclose.
References
- 1.Lainscak M, von Haehling S, Doehner W, Anker SD. The obesity paradox in chronic disease: facts and numbers. J Cachexia Sarcopenia Muscle. 2012;3(1):1–4. doi: 10.1007/s13539-012-0059-5. [DOI] [PMC free article] [PubMed] [Google Scholar]
- 2.Whitmer RA, Gunderson EP, Barrett-Connor E, Quesenberry CP, Jr, Yaffe K. Obesity in middle age and future risk of dementia: a 27 year longitudinal population based study. BMJ. 2005;330(7504):1360. doi: 10.1136/bmj.38446.466238.E0. [DOI] [PMC free article] [PubMed] [Google Scholar]
- 3.Xu WL, Atti AR, Gatz M, Pedersen NL, Johansson B, Fratiglioni L. Midlife overweight and obesity increase late-life dementia risk: a population-based twin study. Neurology. 2011;76(18):1568–1574. doi: 10.1212/WNL.0b013e3182190d09. [DOI] [PMC free article] [PubMed] [Google Scholar]
- 4.Atti AR, Palmer K, Volpato S, Winblad B, De Ronchi D, Fratiglioni L. Late-life body mass index and dementia incidence: nine-year follow-up data from the Kungsholmen Project. J Am Geriatr Soc. 2008;56(1):111–116. doi: 10.1111/j.1532-5415.2007.01458.x. [DOI] [PubMed] [Google Scholar]
- 5.Hughes TF, Borenstein AR, Schofield E, Wu Y, Larson EB. Association between late-life body mass index and dementia: The Kame Project. Neurology. 2009;72(20):1741–1746. doi: 10.1212/WNL.0b013e3181a60a58. [DOI] [PMC free article] [PubMed] [Google Scholar]
- 6.Kuo HK, Jones RN, Milberg WP, Tennstedt S, Talbot L, Morris JN, Lipsitz LA. Cognitive function in normal-weight, overweight, and obese older adults: an analysis of the Advanced Cognitive Training for Independent and Vital Elderly cohort. J Am Geriatr Soc. 2006;54(1):97–103. doi: 10.1111/j.1532-5415.2005.00522.x. [DOI] [PMC free article] [PubMed] [Google Scholar]
- 7.Besser LM, Gill DP, Monsell SE, Brenowitz W, Meranus DH, Kukull W, Gustafson DR. Body mass index, weight change, and clinical progression in mild cognitive impairment and Alzheimer disease. Alzheimer Dis Assoc Disord. 2014;28(1):36–43. doi: 10.1097/WAD.0000000000000005. [DOI] [PMC free article] [PubMed] [Google Scholar]
- 8.Luchsinger JA, Patel B, Tang MX, Schupf N, Mayeux R. Body mass index, dementia, and mortality in the elderly. J Nutr Health Aging. 2008;12(2):127–131. doi: 10.1007/BF02982565. [DOI] [PMC free article] [PubMed] [Google Scholar]
- 9.Buchman AS, Wilson RS, Bienias JL, Shah RC, Evans DA, Bennett DA. Change in body mass index and risk of incident Alzheimer disease. Neurology. 2005;65(6):892–897. doi: 10.1212/01.wnl.0000176061.33817.90. [DOI] [PubMed] [Google Scholar]
- 10.Johnson DK, Wilkins CH, Morris JC. Accelerated weight loss may precede diagnosis in Alzheimer disease. Arch Neurol. 2006;63(9):1312–1317. doi: 10.1001/archneur.63.9.1312. [DOI] [PubMed] [Google Scholar]
- 11.Knopman DS, Edland SD, Cha RH, Petersen RC, Rocca WA. Incident dementia in women is preceded by weight loss by at least a decade. Neurology. 2007;69(8):739–746. doi: 10.1212/01.wnl.0000267661.65586.33. [DOI] [PubMed] [Google Scholar]
- 12.Stewart R, Masaki K, Xue QL, Peila R, Petrovitch H, White LR, Launer LJ. A 32-year prospective study of change in body weight and incident dementia: the Honolulu-Asia Aging Study. Arch Neurol. 2005;62(1):55–60. doi: 10.1001/archneur.62.1.55. [DOI] [PubMed] [Google Scholar]
- 13.White H, Pieper C, Schmader K. The association of weight change in Alzheimer’s disease with severity of disease and mortality: a longitudinal analysis. J Am Geriatr Soc. 1998;46(10):1223–1227. doi: 10.1111/j.1532-5415.1998.tb04537.x. [DOI] [PubMed] [Google Scholar]
- 14.Buchman AS, Schneider JA, Wilson RS, Bienias JL, Bennett DA. Body mass index in older persons is associated with Alzheimer disease pathology. Neurology. 2006;67(11):1949–1954. doi: 10.1212/01.wnl.0000247046.90574.0f. [DOI] [PubMed] [Google Scholar]
- 15.Grundman M, Corey-Bloom J, Jernigan T, Archibald S, Thal LJ. Low body weight in Alzheimer’s disease is associated with mesial temporal cortex atrophy. Neurology. 1996;46(6):1585–1591. doi: 10.1212/wnl.46.6.1585. [DOI] [PubMed] [Google Scholar]
- 16.Ewers M, Schmitz S, Hansson O, Walsh C, Fitzpatrick A, Bennett D, Minthon L, Trojanowski JQ, Shaw LM, Faluyi YO, Vellas B, Dubois B, Blennow K, Buerger K, Teipel SJ, Weiner M, Hampel H, Alzheimer’s Disease Neuroimaging I Body mass index is associated with biological CSF markers of core brain pathology of Alzheimer’s disease. Neurobiol Aging. 2012;33(8):1599–1608. doi: 10.1016/j.neurobiolaging.2011.05.005. [DOI] [PMC free article] [PubMed] [Google Scholar]
- 17.Toledo JB, Toledo E, Weiner MW, Jack CR, Jr, Jagust W, Lee VM, Shaw LM, Trojanowski JQ, Alzheimer’s Disease Neuroimaging I Cardiovascular risk factors, cortisol, and amyloid-beta deposition in Alzheimer’s Disease Neuroimaging Initiative. Alzheimers Dement. 2012;8(6):483–489. doi: 10.1016/j.jalz.2011.08.008. [DOI] [PMC free article] [PubMed] [Google Scholar]
- 18.Vidoni ED, Townley RA, Honea RA, Burns JM, Alzheimer’s Disease Neuroimaging I Alzheimer disease biomarkers are associated with body mass index. Neurology. 2011;77(21):1913–1920. doi: 10.1212/WNL.0b013e318238eec1. [DOI] [PMC free article] [PubMed] [Google Scholar]
- 19.Rajan KB, Skarupski KA, Rasmussen HE, Evans DA. Gene-environment interaction of body mass index and apolipoprotein E epsilon4 allele on cognitive decline. Alzheimer Dis Assoc Disord. 2014;28(2):134–140. doi: 10.1097/WAD.0000000000000013. [DOI] [PMC free article] [PubMed] [Google Scholar]
- 20.Vanhanen M, Kivipelto M, Koivisto K, Kuusisto J, Mykkanen L, Helkala EL, Hanninen T, Kervinen K, Kesaniemi YA, Laakso MP, Soininen H, Laakso M. APOE-epsilon4 is associated with weight loss in women with AD: a population-based study. Neurology. 2001;56(5):655–659. doi: 10.1212/wnl.56.5.655. [DOI] [PubMed] [Google Scholar]
- 21.Sperling RA, Aisen PS, Beckett LA, Bennett DA, Craft S, Fagan AM, Iwatsubo T, Jack CR, Jr, Kaye J, Montine TJ, Park DC, Reiman EM, Rowe CC, Siemers E, Stern Y, Yaffe K, Carrillo MC, Thies B, Morrison-Bogorad M, Wagster MV, Phelps CH. Toward defining the preclinical stages of Alzheimer’s disease: recommendations from the National Institute on Aging-Alzheimer’s Association workgroups on diagnostic guidelines for Alzheimer’s disease. Alzheimers Dement. 2011;7(3):280–292. doi: 10.1016/j.jalz.2011.03.003. [DOI] [PMC free article] [PubMed] [Google Scholar]
- 22.Mormino E, Betensky R, Hedden T, Schultz A, Ward A, Hujibers W, Rentz D, Johnson K, Sperling R. Amyloid and APOE ɛ4 interact to influence short-term decline in preclinical Alzheimer disease. Neurology. 2014;82(20):1760–1767. doi: 10.1212/WNL.0000000000000431. [DOI] [PMC free article] [PubMed] [Google Scholar]
- 23.Mormino EC, Betensky RA, Hedden T, Schultz AP, Amariglio RE, Rentz DM, Johnson KA, Sperling RA. Synergistic effect of beta-amyloid and neurodegeneration on cognitive decline in clinically normal individuals. JAMA Neurol. 2014;71(11):1379–1385. doi: 10.1001/jamaneurol.2014.2031. [DOI] [PMC free article] [PubMed] [Google Scholar]
- 24.Vos SJ, Xiong C, Visser PJ, Jasielec MS, Hassenstab J, Grant EA, Cairns NJ, Morris JC, Holtzman DM, Fagan AM. Preclinical Alzheimer’s disease and its outcome: a longitudinal cohort study. Lancet Neurol. 2013;12(10):957–965. doi: 10.1016/S1474-4422(13)70194-7. [DOI] [PMC free article] [PubMed] [Google Scholar]
- 25.Petersen RC, Wiste HJ, Weigand SD, Rocca WA, Roberts RO, Mielke MM, Lowe VJ, Knopman DS, Pankratz VS, Machulda MM, Geda YE, Jack CR., Jr Association of Elevated Amyloid Levels With Cognition and Biomarkers in Cognitively Normal People From the Community. JAMA Neurol. 2016;73(1):85–92. doi: 10.1001/jamaneurol.2015.3098. [DOI] [PMC free article] [PubMed] [Google Scholar]
- 26.Morris JC. The Clinical Dementia Rating (CDR): current version and scoring rules.[see comment] Neurology. 1993;43(11):2412–2414. doi: 10.1212/wnl.43.11.2412-a. [DOI] [PubMed] [Google Scholar]
- 27.Folstein MF, Folstein SE, McHugh PR. “Mini-mental state”. A practical method for grading the cognitive state of patients for the clinician. J Psychiatr Res. 1975;12(3):189–198. doi: 10.1016/0022-3956(75)90026-6. [DOI] [PubMed] [Google Scholar]
- 28.Weschler D. WMS-R: Weschler Memory Scale – Revised Manual. New York: Psychological Corporation; 1987. [Google Scholar]
- 29.Jensen MD, Ryan DH, Apovian CM, Ard JD, Comuzzie AG, Donato KA, Hu FB, Hubbard VS, Jakicic JM, Kushner RF, Loria CM, Millen BE, Nonas CA, Pi-Sunyer FX, Stevens J, Stevens VJ, Wadden TA, Wolfe BM, Yanovski SZ, Jordan HS, Kendall KA, Lux LJ, Mentor-Marcel R, Morgan LC, Trisolini MG, Wnek J, Anderson JL, Halperin JL, Albert NM, Bozkurt B, Brindis RG, Curtis LH, DeMets D, Hochman JS, Kovacs RJ, Ohman EM, Pressler SJ, Sellke FW, Shen WK, Smith SC, Jr, Tomaselli GF, American College of Cardiology/American Heart Association Task Force on Practice G, Obesity S 2013 AHA/ACC/TOS guideline for the management of overweight and obesity in adults: a report of the American College of Cardiology/American Heart Association Task Force on Practice Guidelines and The Obesity Society. Circulation. 2014;129(25 Suppl 2):S102–138. doi: 10.1161/01.cir.0000437739.71477.ee. [DOI] [PMC free article] [PubMed] [Google Scholar]
- 30.Becker JA, Hedden T, Carmasin J, Maye J, Rentz DM, Putcha D, Fischl B, Greve DN, Marshall GA, Salloway S, Marks D, Buckner RL, Sperling RA, Johnson KA. Amyloid-beta associated cortical thinning in clinically normal elderly. Ann Neurol. 2011;69(6):1032–1042. doi: 10.1002/ana.22333. [DOI] [PMC free article] [PubMed] [Google Scholar]
- 31.Hedden T, Mormino EC, Amariglio RE, Younger AP, Schultz AP, Becker JA, Buckner RL, Johnson KA, Sperling RA, Rentz DM. Cognitive profile of amyloid burden and white matter hyperintensities in cognitively normal older adults. J Neurosci. 2012;32(46):16233–16242. doi: 10.1523/JNEUROSCI.2462-12.2012. [DOI] [PMC free article] [PubMed] [Google Scholar]
- 32.Johnson KA, Gregas M, Becker JA, Kinnecom C, Salat DH, Moran EK, Smith EE, Rosand J, Rentz DM, Klunk WE, Mathis CA, Price JC, Dekosky ST, Fischman AJ, Greenberg SM. Imaging of amyloid burden and distribution in cerebral amyloid angiopathy. Ann Neurol. 2007;62(3):229–234. doi: 10.1002/ana.21164. [DOI] [PubMed] [Google Scholar]
- 33.Klunk WE, Engler H, Nordberg A, Wang Y, Blomqvist G, Holt DP, Bergstrom M, Savitcheva I, Huang GF, Estrada S, Ausen B, Debnath ML, Barletta J, Price JC, Sandell J, Lopresti BJ, Wall A, Koivisto P, Antoni G, Mathis CA, Langstrom B. Imaging brain amyloid in Alzheimer’s disease with Pittsburgh Compound-B. Ann Neurol. 2004;55(3):306–319. doi: 10.1002/ana.20009. [DOI] [PubMed] [Google Scholar]
- 34.Albers MW, Tabert MH, Devanand DP. Olfactory dysfunction as a predictor of neurodegenerative disease. Curr Neurol Neurosci Rep. 2006;6(5):379–386. doi: 10.1007/s11910-996-0018-7. [DOI] [PubMed] [Google Scholar]
- 35.Growdon ME, Schultz AP, Dagley AS, Amariglio RE, Hedden T, Rentz DM, Johnson KA, Sperling RA, Albers MW, Marshall GA. Odor identification and Alzheimer disease biomarkers in clinically normal elderly. Neurology. 2015;84(21):2153–2160. doi: 10.1212/WNL.0000000000001614. [DOI] [PMC free article] [PubMed] [Google Scholar]
- 36.Buchman AS, Schneider JA, Leurgans S, Bennett DA. Physical frailty in older persons is associated with Alzheimer disease pathology. Neurology. 2008;71(7):499–504. doi: 10.1212/01.wnl.0000324864.81179.6a. [DOI] [PMC free article] [PubMed] [Google Scholar]
- 37.Buchman AS, Yu L, Wilson RS, Schneider JA, Bennett DA. Association of brain pathology with the progression of frailty in older adults. Neurology. 2013;80(22):2055–2061. doi: 10.1212/WNL.0b013e318294b462. [DOI] [PMC free article] [PubMed] [Google Scholar]
- 38.Kelaiditi E, Cesari M, Canevelli M, van Kan GA, Ousset PJ, Gillette-Guyonnet S, Ritz P, Duveau F, Soto ME, Provencher V, Nourhashemi F, Salva A, Robert P, Andrieu S, Rolland Y, Touchon J, Fitten JL, Vellas B, Iana/Iagg Cognitive frailty: rational and definition from an (I.A.N.A./I.A.G.G.) international consensus group. J Nutr Health Aging. 2013;17(9):726–734. doi: 10.1007/s12603-013-0367-2. [DOI] [PubMed] [Google Scholar]
- 39.Berger AK, Fratiglioni L, Forsell Y, Winblad B, Backman L. The occurrence of depressive symptoms in the preclinical phase of AD: a population-based study. Neurology. 1999;53(9):1998–2002. doi: 10.1212/wnl.53.9.1998. [DOI] [PubMed] [Google Scholar]
- 40.Kim NH, Kim HS, Eun CR, Seo JA, Cho HJ, Kim SG, Choi KM, Baik SH, Choi DS, Park MH, Han C, Kim NH. Depression is associated with sarcopenia, not central obesity, in elderly korean men. J Am Geriatr Soc. 2011;59(11):2062–2068. doi: 10.1111/j.1532-5415.2011.03664.x. [DOI] [PubMed] [Google Scholar]
- 41.Mormino EC. The relevance of beta-amyloid on markers of Alzheimer’s disease in clinically normal individuals and factors that influence these associations. Neuropsychol Rev. 2014;24(3):300–312. doi: 10.1007/s11065-014-9267-4. [DOI] [PMC free article] [PubMed] [Google Scholar]
- 42.Burns JM, Johnson DK, Watts A, Swerdlow RH, Brooks WM. Reduced lean mass in early Alzheimer disease and its association with brain atrophy. Arch Neurol. 2010;67(4):428–433. doi: 10.1001/archneurol.2010.38. [DOI] [PMC free article] [PubMed] [Google Scholar]
- 43.Gustafson D. Adiposity indices and dementia. Lancet Neurol. 2006;5(8):713–720. doi: 10.1016/S1474-4422(06)70526-9. [DOI] [PubMed] [Google Scholar]
- 44.Kerwin DR, Gaussoin SA, Chlebowski RT, Kuller LH, Vitolins M, Coker LH, Kotchen JM, Nicklas BJ, Wassertheil-Smoller S, Hoffmann RG, Espeland MA, Women’s Health Initiative Memory S Interaction between body mass index and central adiposity and risk of incident cognitive impairment and dementia: results from the Women’s Health Initiative Memory Study. J Am Geriatr Soc. 2011;59(1):107–112. doi: 10.1111/j.1532-5415.2010.03219.x. [DOI] [PubMed] [Google Scholar]