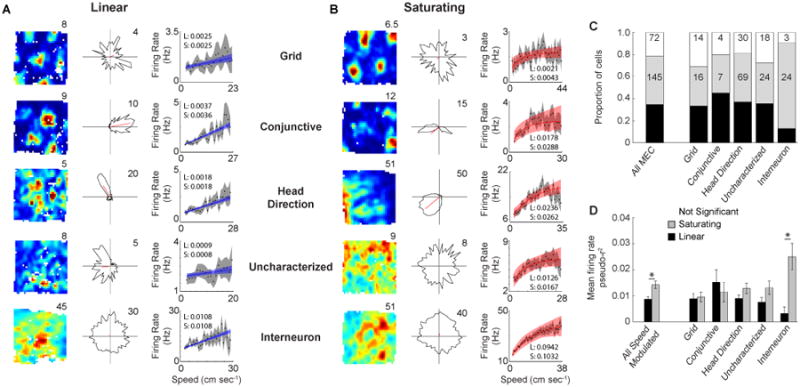
Figure 1.

Linear and saturating coding of running speed by the firing rate of MEC neurons. A. Spatial rate map (left), head direction polar plot (middle) and firing rate versus running speed plot (right) for a grid cell, conjunctive cell, head direction cell, uncharacterized cell and interneuron (top to bottom) that linearly code running speed. Each plot shows the best fit function with confidence intervals (blue and red for linear and saturating cells respectively) as obtained using maximum likelihood estimation on temporal bins and also shows the mean value of running speed bins (black dots) and associated confidence intervals (gray). The inset values in each plot are the pseudo-r2 values for the linear (L) and saturating (S) fits. B. Same as in A, but for saturating cells. C. Proportions of each cell type coding running speed linearly and exponentially. The values indicate the number of cells. D. Mean +/- SEM firing rate pseudo-r2 values for linear and saturating cells. * p < 0.005
