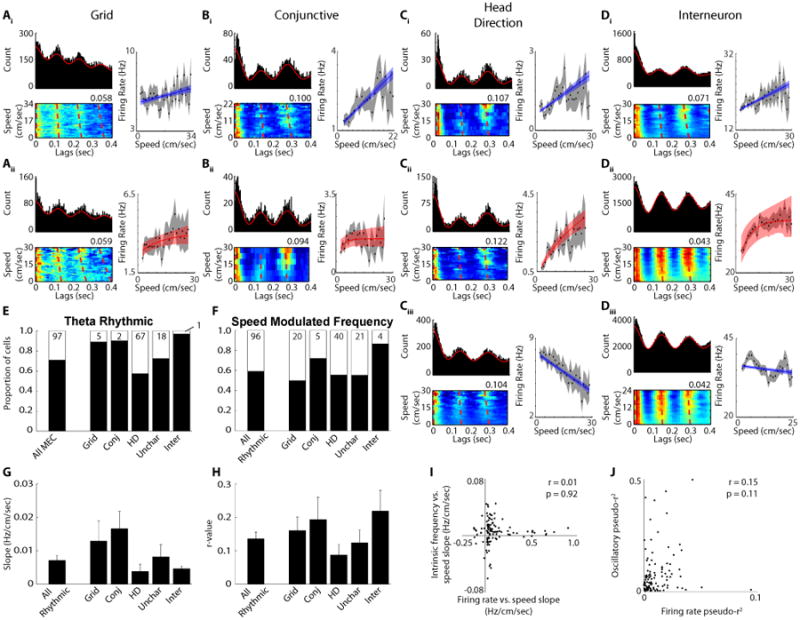
Figure 3.

Speed modulation of oscillatory theta frequency. A - D) Three plots are shown for ten different example neurons. Traditional autocorrelations showing theta rhythmicity (top left plot), spike time lags as a function of running speed (the value at the top right corner of each plot indicates the maximum conditional probability of firing (red) shown in the plot with the sum of each running speed row equals a conditional probability of 1) (bottom left plot) and firing rate versus running speed (right). Ai - Di) Cells with positive linear relationships between firing rate and running speed. Aii - Dii) Cells with saturating relationships between firing rate and running speed. Ciii - Diii) Cells with negative linear relationships between firing rate and running speed. E) The proportion of cells with significant theta modulation. F) The proportion of theta rhythmic neurons with significantly speed modulated oscillatory frequencies. G) The mean +/- SEM slope of the relationship between oscillatory frequency and running speed. H) The mean +/- SEM r-value of the relationship between oscillatory frequency and running speed. I) There is no relationship between the firing rate versus running speed slopes and the oscillatory frequency versus running speed slopes. J) There is no relationship between the firing rate pseudo-r2 values and the oscillatory frequency pseudo-r2 values.
