Abstract
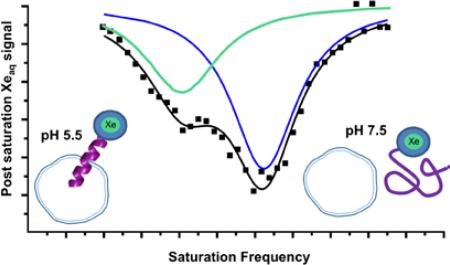
Here we present a “smart” xenon-129 NMR biosensor that undergoes a peptide conformational change and labels cancer cells at acidic pH. To a cryptophane host molecule with high Xe affinity, we conjugated a 30mer EALA-repeat peptide that is alpha-helical at pH 5.5 and disordered at pH 7.5. The 129Xe NMR chemical shift at rt was strongly pH-dependent (Δδ = 3.4 ppm): δ = 64.2 ppm at pH 7.5 vs. δ = 67.6 ppm at pH 5.5 where Trp(peptide)-cryptophane interactions were evidenced by Trp fluorescence quenching. Using Hyper-CEST NMR, we probed peptido-cryptophane detection limits at low-picomolar (10−11 M) concentration, which compares favourably to other NMR pH sensors at 10−2−10−3 M. Finally, in biosensor-HeLa cell solutions, peptide-cell membrane insertion at pH 5.5 generated a 13.4 ppm downfield cryptophane-129Xe NMR chemical shift relative to pH 7.5 studies. This highlights new uses for 129Xe as an ultrasensitive probe of peptide structure and function, along with potential applications for pH-dependent cell labeling in cancer diagnosis and treatment.
Graphical Abstract
INTRODUCTION
Magnetic resonance imaging (MRI) and spectroscopy (MRS) are versatile and commonly employed techniques for the diagnosis and staging of disease.1 The development of targeted and stimuli-responsive (i.e., “smart”) contrast agents improves the capabilities of MRI/MRS for molecular imaging.2 Targeted therapeutic and diagnostic imaging techniques are typically directed to one or more receptors associated with a disease state. However, in cancer, as a result of large natural variations between cells and the heterogeneous nature of tissue within a tumor, there is also need for more general biomarkers.3,4 For example, hypoxia and acidification occur in 90% of tumors and are key microenvironmental factors in progression and treatment resistance in solid tumors.5,6 Tumors have been shown to acidify their micro-environment to levels between 5.7-6.9 (from a normal pH of 7.4) to aid in metastasis, mutation rate, and viability.4,7,8 Therefore, pH detection has practical importance in the design of cancer therapies and controlled-release drug delivery mechanisms.8 Additionally, acidic environments can mitigate the efficacy of weakly basic chemotherapeutics such as doxorubicin, necessitating methodologies to probe extracellular pH (pHe).9 Here, we present an ultrasensitive xenon-based MR contrast agent that can identify and label cell populations based on their pHe.
A variety of pH-responsive MR contrast agents have been designed, including Gd complexes,10,11 tunable micelle-encapsulated polymers and 19F compounds,12,13 Gd and super-paramagnetic iron oxide (SPIO) glycol chitosan,14,15 and CEST agents,16-20 among others.21 Applications with these reagents are generally limited by relatively low detection sensitivity on a per-monomer basis (i.e., low mM).22,23 One strategy for improving NMR detection sensitivity involves the use of exogenously supplied “hyperpolarized” (hp) nuclei, e.g., 129Xe, 13C, and 3He, with magnetic spin reservoirs that exceed the normal Boltzmann distribution by several orders of magnitude. Xe binds void spaces in materials24 and proteins,25 but shows highest affinity and useful exchange kinetics for a class of host molecules known as cryptophane.26-31 Perturbation of the large (~42 Å3 volume) 129Xe electron cloud can produce significant nuclear magnetic chemical shift changes and results in a nearly 300 ppm chemical shift window when bound to different cryptophanes in aqueous solution.27,32,33
Based on these principles, we and others have developed 129Xe-cryptophane NMR biosensors for the sensitive detection of protein receptors,34-37 enzymes,38 DNA,39 and metal ions in solution.40 In one proof-of-concept experiment, Berthault et al. decorated cryptophane with six carboxylic acids to create a pH sensor: unique chemical shifts were measured over the pH 3.5-5.5 range with a total Δδ of 3.55 ppm.41 However, solubility issues precluded work near neutral pH.
Recent studies have moved xenon biosensing from buffer solutions to lipid membrane suspensions and living cells. Meldrum et al. discovered that cryptophane associated with a dilute suspension of sub-micron Intralipid vesicles yielded a 129Xe NMR peak that was shifted ~10 ppm downfield from the aqueous 129Xe-cryptophane peak;42 similar results were later obtained with different lipid compositions.43 Most recently, Klippel et al. performed hp 129Xe chemical exchange saturation transfer (Hyper-CEST) NMR spectroscopy and imaging studies in cells loaded with lipophilic cryptophane and found a similar 9-11 ppm downfield chemical shift change, likely due to membrane association.44-46 These studies highlight the large 129Xe NMR chemical shift changes that can be achieved by engineering cryptophane-lipid membrane interactions.
Building on these examples, we set out to develop an ultra-sensitive 129Xe NMR pH sensor for biological applications. We hypothesized that our previously reported tripropargyl cryptophane-A derivative (with two cyclotriveratrylene units tethered by three ethylene linkers)47 would allow facile attachment of a pH-responsive peptide and two water-solubilizing moieties (Scheme 1), which mitigate the potential for cryptophane aggregation.45 Recent work from our laboratory48 and elsewhere49-51 has demonstrated nM-to-pM detection of water-soluble cryptophane using Hyper-CEST NMR spectroscopy. Thus, Hyper-CEST NMR should enable ultrasensitive pHe sensing, provided that 129Xe-cryptophane NMR signals vary over the pH range 5.5-7.5.
Scheme 1.
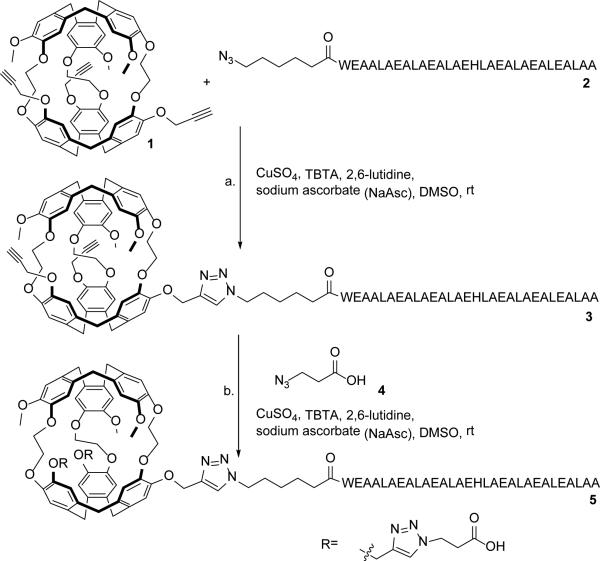
Synthesis of water-soluble EALA-cryptophane (WEC): a. 1 (1 eq), 2 (1 eq), CuSO4 (1 eq), TBTA (5 eq), 2,6-lutidine (1 eq), NaAsc (10 eq), 12 h; b. 3 (crude), 4 (10 eq), CuSO4 (1 eq), TBTA (5 eq), 2,6-lutidine (1 eq), NaAsc (10 eq), 12 h.
In order to modulate 129Xe NMR chemical shift in response to physiologic pH changes, we modified cryptophane with an EALA-repeat peptide: WEAALAEALAEALAEHLAEALAEALEALAA.52 Upon a decrease in pH from 7.5 to 5.5, the 30mer peptide undergoes a conformational change from random coil to alpha-helix, due to neutralization of charge repulsion between glutamate residues.53 This change is readily observable by electronic circular dichroism (ECD) spectroscopy. The poly-glutamic acid nature of the peptide elevates the pKa to around 6, resulting in a conformational change over a biologically relevant pH range.53 Based on our prior study of a cryptophane-peptide biosensor,37 we sought to promote tryptophan-cryptophane interactions as a means of increasing 129Xe NMR chemical shift sensitivity to peptide conformational changes occurring over large distances.
Building on work from the Pines41 and Schröder44,45 labs we strove to take advantage also of the chemical shift perturbation afforded by membrane association in the design of our pH sensor. The synthetic EALA-repeat peptide design was inspired by hemagglutinin (HA), which membrane inserts in low-pH environments.52 As the glutamates are protonated, the peptide becomes more helical and hydrophobic, and it bidirectionally inserts into lipophilic membranes.57 This pH-dependent membrane insertion has been used in living cells to facilitate endosomal escape of both nanocapsule and gene payloads.54-56 Thus, by appending a membrane-inserting EALA peptide to cryptophane we endeavored to generate a xenon biosensor capable of being “activated” in acidic cell environments to label cell membranes and give large 129Xe NMR chemical shift changes.
RESULTS AND DISCUSSION
Synthetic Procedures
Scheme 1 shows the synthesis of the water-soluble EALA-cryptophane (WEC) pH sensor 5, the details of which are provided in the Supporting Information. Briefly, the synthesis of tripropargyl cryptophane 1 was performed in six steps with modifications to previously published methods,58 with an overall yield of 9.9% (Scheme S1). The azido-EALA-repeat peptide 2 was prepared with standard Fmoc synthetic methods (Figures S1-S2). The peptide was attached to the cryptophane via copper(I)-catalyzed [3+2] azide-alkyne cycloaddition (CuAAC) to form 3.59,60 The mono-peptide cryptophane was achieved in preference by controlling reaction stoichiometry. The resulting triazole-hexyl spacer kept the peptide in close proximity to the 129Xe nucleus while minimizing steric clashes with cryptophane during conjugation. Formation of compound 3 was confirmed by MALDI-MS and the yield quantified by analytical reverse-phase HPLC to be 60-80% (Figures S3-S4). A solubilizing linker, 3-azidopropionic acid 4, was synthesized in one step from the commercially available β-propiolactone (see Supporting Information)36,38 and reacted with crude 3 via a second CuAAC. Starting from tripropargyl cryptophane 1, pH sensor 5 was isolated in ~40% yield after sequential CuAAC reactions with 2 and 4 and HPLC purification to remove unreacted EALA and unreacted cryptophane (Figures S5-S6).
Electronic Circular Dichroism (ECD) Spectroscopy
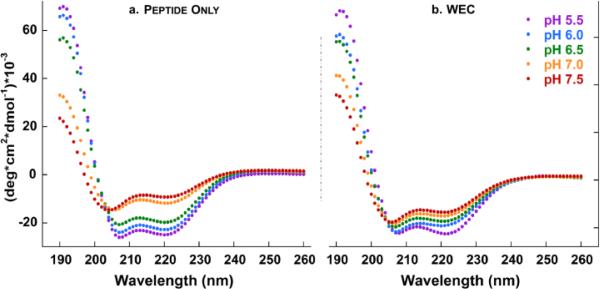
For ECD studies, all samples of azido-peptide 2 or WEC were prepared at 30 μM concentration in 10 mM sodium phosphate buffer, as confirmed by UV-vis spectroscopy (peptide: ε280 = 5,700 M−1cm−1, WEC: ε280 = 17,700 M−1cm−1) and pH adjusted with 1 M HCl or 1 M NaOH. We used ECD spectroscopy to confirm that azido-peptide 2 maintained pH sensitivity (Figure 1a):52,61,62 indeed, percent helicity increased from 25% to 67% as the pH was decreased from 7.5 to 5.5 (Table S1). The ECD signal at pH 5.5 had pronounced local minima at 208 and 222 nm, indicative of an alpha-helical secondary structure. At pH 7.5, the spectrum approached a minimum at 204 nm while subsequently decreasing in negative ellipticity at 222 nm, characteristic of a more disordered state. For the WEC pH sensor (Figure 1b, Figure S7), we observed a similar increase in EALA helicity from 36% (pH 7.5) to 61% (pH 5.5). These data established that the peptide still undergoes a significant conformational change when conjugated to the cryptophane. Samples showed reproducible and reversible secondary structure changes between pH 5.5 and 7.5 (Figure S8). Interestingly, WEC was more ordered at pH 7.5 than peptide alone, suggesting that the cryptophane elevated the conjugated peptide pKa. pKa elevation was previously observed for the analogous tris-propionic acid cryptophane, due to the bulky, hydrophobic cryptophane disfavoring the ionized propionates.29
Figure 1.
pH titrations monitored by ECD spectroscopy for a. azido-EALA peptide and b. water-soluble EALA-cryptophane (WEC). Samples (30 μM) were in 10 mM sodium phosphate buffer over the pH range 5.5-7.5 at 298 K.
Tryptophan Fluorescence
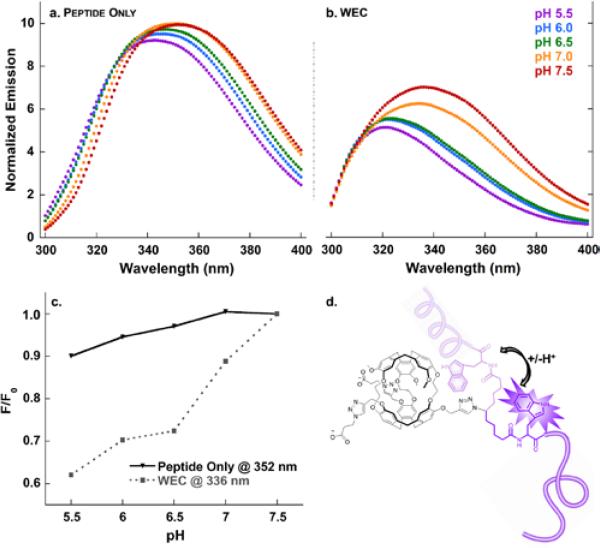
The EALA-repeat peptide contains a single N-terminal tryptophan that we hypothesized should provide a useful local probe of peptide conformation, as well as peptide-cryptophane interaction. Fluorescence studies (λex = 280 nm) with peptide 2 demonstrated blue-shifted and somewhat quenched Trp emission with decreasing pH: 352 nm (pH 7.5) to 343 nm (pH 5.5), Figure 2a. Trp maximum emission wavelength for the WEC decreased from 336 nm to 322 nm over the same pH range (Figure 2b), which was considerably blue-shifted relative to peptide 2 alone, consistent with the Trp experiencing a less solvated environment near cryptophane. We note that the fluorescence signal for the amino acid tryptophan is typically not perturbed by pH changes in the range of 4-8,63 whereas Trp incorporated within peptides can exhibit emission that is very sensitive to the peptide folded state. Cryptophane fluoresces (λmax = 313 nm) with comparable intensity to Trp, which further blue-shifts the observed emission spectrum.29,37 At all pH values, cryptophane quenched Trp emission, as compared to the free peptide (Figure 2c). Plots of F/F0 vs. pH (Figure 2c) confirmed that cryptophane quenching increased from pH 7.5 down to pH 5.5, where cryptophane-Trp interactions were presumably favoured by the relatively uncharged, alpha-helical peptide. This analysis is in agreement to an earlier work with a peptide-cryptophane conjugate where we examined the interaction between Trp and cryptophane with a temperature-dependent quenching assay and Stern-Volmer analysis.37 These experiments revealed that Trp(peptide)-cryptophane complex formation resulted in loss of Trp fluorescence. Previous studies identified high-affinity interactions between C60 (an aromatic molecule with similar dimensions and spherical shape to cryptophane) and Trp-containing proteins, which also resulted in Trp fluorescence quenching and blue-shifted emission.64-66 These results support a mechanism by which the EALA peptide can mediate Trp-crptophane complex formation in WEC (Figure 2d) and result in pH-dependent Trp fluorescence quenching. Importantly, Trpcryptophane pi-stacking interactions have the potential to deshield 129Xe within the cryptophane cavity, and produce a downfield chemical shift.67-69
Figure 2.
pH titration monitored by Trp fluorescence for a. azido-EALA peptide; b. water-soluble EALA-cryptophane (WEC); c. plot of F/F0 for the λmax of peptide only (352 nm) and WEC (336 nm) as a function of pH change; and, d. representation of alpha-helical and disordered peptide-cryptophane interaction. Samples (30 μM) were in 10 mM sodium phosphate buffer over the pH range 5.5-7.5 at 298 K.
129Xe NMR Spectroscopy
We performed hp 129Xe NMR studies to examine the sensitivity of the cryptophane-encapsulated 129Xe chemical shift to the nearby peptide conformational state. NMR samples were identically prepared at 30 μM concentrations in 10 mM sodium phosphate buffer. Repeated trials at 300 ± 1 K ([Xe] = 6.2 mM)70 with the pH sensor at pH 7.5, 6.5, and 5.5 gave reproducible chemical shifts (Figure 3). A single peak was observed at both pH 5.5 (67.6 ± 0.5 ppm) and pH 7.5 (64.2 ± 0.5 ppm), with a chemical shift difference of 3.4 ppm. The double peak observed at pH 6.5 (δ = 67.0 and 64.4 ppm) is indicative of a roughly 1:1 mixture of the pH sensor in the alpha-helical and more disordered conformation, consistent with the CD spectra (Figure 1b). Interestingly, although the cryptophane itself is a racemic mixture of stereoisomers and the EALA-repeat peptide is chiral, we did not observe a pair of diastereomeric peaks at pH 7.5 or pH 5.5 as we reported for a previous peptide-cryptophane xenon biosensor37 and has been seen for various racemic xenon biosensors complexed to protein active sites.40 We hypothesize that the two diastereomers provide a very similar environment for the bound xenon atom, and produce what appears to be a single 129Xe NMR peak at both pH values. This is consistent with the solubilizing propionates promoting open, xenon-binding conformations of the cryptophane, regardless of peptide conformation.
Figure 3.
Hyperpolarized 129Xe NMR spectra (average of 16 scans, line-broadening = 60 Hz) of WEC (30 μM) in 10 mM sodium phosphate buffer at 300 ± 1 K, with peak widths (FWHM) indicated in Hz: a. pH 5.5, 211 Hz; b. pH 6.5, 317 and 214 Hz; c. pH 7.5, 154 Hz.
Hyper-CEST 129Xe NMR
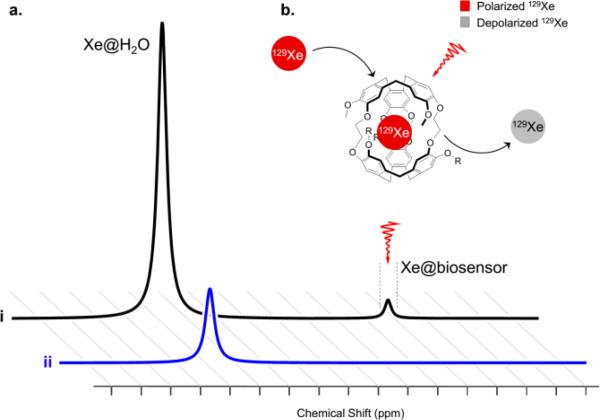
To improve detection sensitivity with this pH sensor over direct detection by nearly six orders of magnitude, we employed Hyper-CEST NMR spectroscopy. This indirect detection method took advantage of the exchanging 129Xe population between bulk aqueous solution and the xenon host molecule (Figure 4a) by selectively saturating the bound signal (Figure 4b). Because of xenon exchange, the selective depolarization resulted in a concomitant signal loss from the 129Xe@water peak, which was readily monitored (Figure 4). This signal was compared with a reference measurement where an “off resonance” saturation was applied to account for the natural self relaxation of the 129Xe@water over time.
Figure 4.
Hyper-CEST detection scheme for WEC-encapsulated 129Xe. a. Representative spectra are shown for i. the initial spectrum and ii. the resulting spectrum from selective “on resonance” saturation of the WEC-encapsulated 129Xe and commensurate bulk 129Xe@H2O depolarization; b. selective radio frequency depolarization of WEC-encapsulated 129Xe.
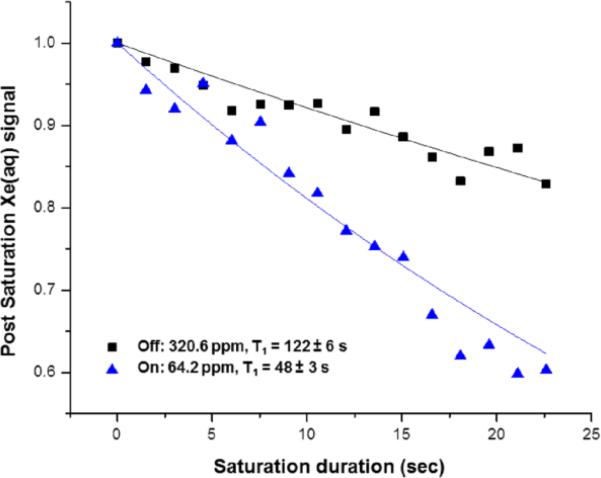
Using 33.8 pM WEC (pH 7.5, 310 K, [Xe] = 0.15 mM) indirect detection via Hyper-CEST was performed by applying shaped radiofrequency saturation pulses at the chemical shift of 129Xe@WEC resonant frequency and measuring the residual aqueous 129Xe signal for different saturation duration (Figure 5). WEC was observed to “catalyze” this depolarization process through on-resonance (64.2 ppm) saturation rf pulses with 129Xe@WEC in pH 7.5 buffer. In contrast, saturation pulses applied off-resonance (320.6 ppm) gave a depolarization time that approximates the natural T1 of hp 129Xe in water.
Figure 5.
Hyper-CEST signal decay with 33.8 pM WEC at pH 7.5, 310 K. Depolarization rates were measured with radiofrequency pulses either on-resonance (64.2 ppm) or off-resonance (320.6 ppm) with hp 129Xe@WEC.
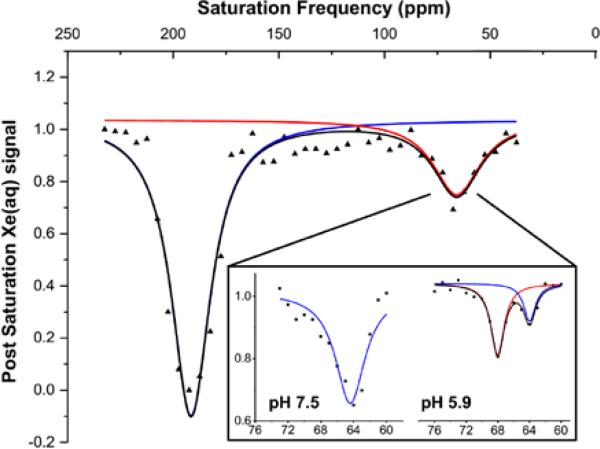
We also investigated the precision of pH measurements with WEC by using a 1-ppm saturation pulse to look at “normal” (pH 7.5) and acidic (pH 5.9) buffer solutions, Figure 6. Because the depolarization efficiency is decreased with the narrower saturation pulse, WEC was employed at 1 μM concentrations, which is still at least 103-fold more dilute than demonstrated for other CEST pH reporters.22 Prior to detecting a free xenon signal, a loop of selective Dsnob-shaped saturation pulses was scanned over the chemical shift range of 40-230 ppm in 5-ppm (700 Hz) steps, which corresponded to pulse length of 3748.6 μs and field strength of 77 μT. Two saturation responses centered at 195 ppm (129Xe@H2O) and 65 ppm (129Xe@WEC) were observed (Figure 6, full image). By decreasing the frequency scanning step size to 1 ppm (138.2 Hz), which corresponded to shaped pulse length of 19014 μs and field strength of 15 μT, we were able to distinguish the WEC-encapsulated 129Xe peak for pH 7.5 and pH 5.9 samples at 300 K (Figure 6, inset). The total time to record the Hyper-CEST NMR spectra was composed of xenon delivery time (20 s) and data collection time. For the latter, each data point required time T:
Figure 6.
Hyper-CEST scan of WEC (1 μM) at 300 K. Full image was collected with 5-ppm step and individual peaks with 1-ppm step at pH 7.5 and pH 5.9 (inset).
In the 5-ppm step scanning experiments, sp6 (saturation pulse length) = 3.748 ms, d12 (delay between saturation pulses) = 20 μs, L6 (number of saturation cycles) = 400, d1 (delay before acquisition pulse) = 0.5 s, p1 (acquisition pulse) = 22 μs. Thus, the total time needed to acquire the whole spectrum was 860 s. In the 1-ppm step scanning experiments, sp6 = 19.014 ms, L6 = 600, and the total time needed was 478 s. The observed ~2:1 ratio of peaks corresponding to alpha-helical/disordered peptide at pH 5.9 was consistent with hp 129Xe NMR data collected for 30 μM WEC by direct detection, where 1:1 ratio of alpha-helical/disordered peptide was observed at pH 6.5 (Figure 3). As illustrated by these data, the Hyper-CEST 129Xe NMR spectrum readily distinguished between physiologically normal and acidic pH values.
Cellular Hyper-CEST 129Xe NMR
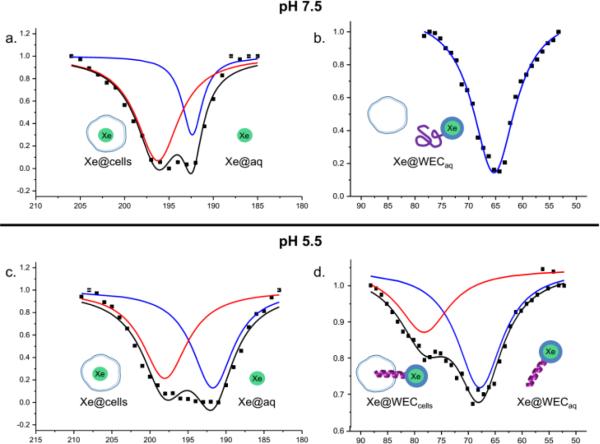
Finally, we investigated the utility of the WEC pH sensor in a biological setting through in vitro 129Xe-NMR studies. Human cervical carcinoma (HeLa) cells were grown in a flask to confluency. Cells were washed and suspended in either pH 7.5 or 5.5 sodium phosphate buffer containing 5-10 μM WEC to give 1 × 10⁷ cells/mL concentrations. Pluronic L-81 (0.1% final conc.) was added to reduce foaming that can result from Xe bubbling.44 Cells were incubated in these conditions for 45-60 min and then transferred to the NMR tube. Spectra were acquired at both pH values with frequency scanning step size of 1 ppm (138.2 Hz), 400 cycles, which corresponded to shaped pulse length of 19014 μs and field strength of 15 μT. Figure 7a shows xenon internalized in cells (red trace) and xenon dissolved in aqueous solution of HeLa cells suspended in pH 7.5 buffer with WEC (blue trace). Figure 7b shows WEC-encapsulated xenon in the same sample. 129Xe@WECaq, pH 7.5 gave a chemical shift of 65.0 ppm, which corresponds to free biosensor in buffer at pH 7.5. In pH 5.5 experiments, Figure 7c shows two peaks, one for Xe@cells (red trace) and one for Xe@aq (blue trace). Figure 7d shows the biosensor region of the same sample and exhibits two peaks, one at 68.0 ppm corresponding to free alpha-helical WEC in buffer (blue trace) and one at 78.4 ppm that we assign to WEC inserted in cell membrane (red trace). Notably, upon biosensor-membrane insertion at pH 5.5, we observed a 13.4 ppm downfield chemical shift compared to biosensor-cell solutions at pH 7.5. Contrary to previous 129Xe NMR cell studies performed with a more lipophilic cryptophane, we did not observe cryptophane-membrane association at pH 7.5.42 This result is also consistent with previous studies with the EALA peptide that showed no membrane association at pH 7.5.71 By targeting pH as a general cancer biomarker, along with membrane association we further increased the shift of Xe@biosensorcells relative to Xe@biosensoraq as compared to earlier studies.43-45
Figure 7.
Hyper-CEST 129Xe NMR spectra for 5-10 μM WEC in 10 mM sodium phosphate buffer with 0.1% pluronic in a suspension of 10 × 106 cells/mL. Data were collected at pH 7.5, a. Xe@cells-red trace, Xe@aq-blue trace; b. Xe@WECaq; and at pH 5.5, c. Xe@cells-red trace, Xe@aq-blue trace; d. Xe@WECcells-red trace and Xe@WECaq blue trace. Exponential Lorentzian fits are shown as coloured, solid lines and the corresponding sums are shown as solid black lines.
CONCLUSIONS
In summary, by attaching a pH-responsive, membrane-inserting peptide and two water-solubilizing moieties to a tripropargyl cryptophane host, we were able to generate an ultrasensitive 129Xe NMR pH sensor capable of labeling cells in acidic microenvironments. This xenon biosensor is unique for undergoing a reversible conformational change (over a range of physiologic pH values) as well as functional changes: at pH 5.5, the pendant EALA-repeat peptide was mostly alpha-helical and gained membrane-insertion capabilities. This expands the palette of “smart” 129Xe MR contrast agents, which in previous examples have bound specific targets (e.g., protein receptors, DNA) or undergone a modification event (i.e., enzyme-mediated peptide cleavage).
Significantly, this study demonstrated that appending the peptide to the ~1 nm diameter, hydrophobic cryptophane did not significantly reduce its ability to undergo a conformational change. Circular dichroism, Trp fluorescence, and hp 129Xe NMR spectroscopies were employed to measure the change in helical character of the peptide in the pH range 5.5-7.5. EALA peptide helix formation resulted in a 129Xe NMR downfield chemical shift change of 3.4 ppm, which was likely enhanced by significant cryptophane interactions with the nearby, N-terminal Trp residue. This suggests a general strategy for engineering larger chemical shift changes in xenon biosensors, particularly to monitor molecular events occurring nanometers away from the xenon-cryptophane reporter. These data represent a significant advance over the previous example of a peptido-cryptophane biosensor, which monitored MMP-7 activity: only a 0.5 ppm chemical shift change observed upon enzyme-mediated peptide cleavage, perhaps because the Trp was positioned much farther from the cryptophane.37
More generally, these experiments highlight the utility of hp 129Xe as a biophysical probe. Monitoring peptide (or protein) conformational changes with Hyper-CEST NMR requires only a single-site modification with cryptophane and may present significant advantages relative to FRET and other optical techniques with regard to detection sensitivity, particularly in turbid media. Picomolar concentrations of WEC pH sensor were detected by Hyper-CEST NMR, making this approach nearly 10 orders of magnitude more sensitive than conventional MR contrast agents.
With our long-range goal to develop ultrasensitive 129Xe MR contrast agents for cancer detection and diagnosis, we employed an EALA peptide capable of membrane insertion at acidic pH.57,62 Pioneering studies in the Pines and Schroder laboratories have shown that cryptophane insertion into membranes induces significant downfield 129Xe NMR chemical shift changes.57,62 We exploited this property in designing the WEC pH sensor, and demonstrated a 13.4 ppm downfield chemical shift from disordered-peptide biosensor at “normal” pH to the helical, membrane-inserted biosensor at pH 5.5. The development and cellular implementation of this “smart” xenon biosensor are important steps towards biomedical applications.
Supplementary Material
ACKNOWLEDGMENT
This work was supported by NIH R01-GM097478 and CDMRP-LCRP Concept Award #LC130824. We thank Dr. Rakesh Kohli for assistance with MALDI-MS (supported by NSF MRI-0820996). We thank Drs. George Furst and Jun Gu for assistance with NMR spectroscopy. We thank Dr. E. James Petersson for use of a fluorometer. We also thank Dr. Christopher Lanci of the University of Pennsylvania Biological Chemistry Resource Center for automated peptide synthesis supported by UPenn Laboratory for Research on the Structure of Matter (NSF MRSEC DMR 0520020, 1120901). Dr. Jacob Goldberg provided assistance with CD spectroscopy. We thank Rebecca Wissner for synthetic advice, Judith Currano and Sean Yeldell for editorial assistance.
Footnotes
ASSOCIATED CONTENT
Supporting Information
Experimental and characterization details, including HPLC analysis, and MALDI/MS characterization of biosensor and precursors. This material is available free of charge via the Internet at http://pubs.acs.org.
The authors declare no competing financial interest.
REFERENCES
- 1.Caravan P. Chem. Soc. Rev. 2006;35:512–523. doi: 10.1039/b510982p. [DOI] [PubMed] [Google Scholar]
- 2.Shao HL, Yoon TJ, Liong M, Weissleder R, Lee H. Beilstein J. Nanotechnol. 2010;1:142–154. doi: 10.3762/bjnano.1.17. [DOI] [PMC free article] [PubMed] [Google Scholar]
- 3.An M, Wijesinghe D, Andreev OA, Reshetnyak YK, Engelman DM. Proc. Natl. Acad. Sci. U. S. A. 2010;107:20246–20250. doi: 10.1073/pnas.1014403107. [DOI] [PMC free article] [PubMed] [Google Scholar]
- 4.Thevenin D, An M, Engelman DM. Chem. Biol. 2009;16:754–762. doi: 10.1016/j.chembiol.2009.06.006. [DOI] [PMC free article] [PubMed] [Google Scholar]
- 5.Vavere AL, Biddlecombe GB, Spees WM, Garbow JR, Wijesinghe D, Andreev OA, Engelman DM, Reshetnyak YK, Lewis JS. Cancer Res. 2009;69:4510–4516. doi: 10.1158/0008-5472.CAN-08-3781. [DOI] [PMC free article] [PubMed] [Google Scholar]
- 6.Andreev OA, Engelman DM, Reshetnyak YK. Mol. Membr. Biol. 2010;27:341–352. doi: 10.3109/09687688.2010.509285. [DOI] [PMC free article] [PubMed] [Google Scholar]
- 7.Gillies RJ, Raghunand N, Garcia-Martin ML, Gatenby RA. IEEE Eng. Med. Biol. Mag. 2004;23:57–64. doi: 10.1109/memb.2004.1360409. [DOI] [PubMed] [Google Scholar]
- 8.Lee ES, Gao ZG, Bae YH. J. Controlled Release. 2008;132:164–170. doi: 10.1016/j.jconrel.2008.05.003. [DOI] [PMC free article] [PubMed] [Google Scholar]
- 9.Gillies RJ, Raghunand N, Karczmar GS, Bhujwalla ZM. J. Magn. Reson. Imaging. 2002;16:430–450. doi: 10.1002/jmri.10181. [DOI] [PubMed] [Google Scholar]
- 10.Martinez GV, Zhang XM, Garcia-Martin ML, Morse DL, Woods M, Sherry AD, Gillies RJ. NMR Biomed. 2011;24:1380–1391. doi: 10.1002/nbm.1701. [DOI] [PMC free article] [PubMed] [Google Scholar]
- 11.Garcia-Martin ML, Martinez GV, Raghunand N, Sherry AD, Zhang SR, Gillies RJ. Magn. Reson. Med. 2006;55:309–315. doi: 10.1002/mrm.20773. [DOI] [PubMed] [Google Scholar]
- 12.Zhang SR, Zhou KJ, Huang G, Takahashi M, Sherry AD, Gao JM. Chem. Commun. 2013;49:6418–6420. doi: 10.1039/c3cc42452a. [DOI] [PMC free article] [PubMed] [Google Scholar]
- 13.Huang XN, Huang G, Zhang SR, Sagiyama K, Togao O, Ma XP, Wang YG, Li Y, Soesbe TC, Sumer BD, Takahashi M, Sherry AD, Gao JM. Angew. Chem. Int. Ed. Engl. 2013;52:8074–8078. doi: 10.1002/anie.201301135. [DOI] [PMC free article] [PubMed] [Google Scholar]
- 14.Nwe K, Huang CH, Tsourkas A. J. Med. Chem. 2013;56:7862–7869. doi: 10.1021/jm4012565. [DOI] [PMC free article] [PubMed] [Google Scholar]
- 15.Crayton SH, Tsourkas A. Acs Nano. 2011;5:9592–9601. doi: 10.1021/nn202863x. [DOI] [PMC free article] [PubMed] [Google Scholar]
- 16.Sheth VR, Li YG, Chen LQ, Howison CM, Flask CA, Pagel MD. Magn. Reson. Med. 2012;67:760–768. doi: 10.1002/mrm.23038. [DOI] [PMC free article] [PubMed] [Google Scholar]
- 17.Zhang S, Merritt M, Woessner DE, Lenkinski RE, Sherry AD. Acc. Chem. Res. 2003;36:783–790. doi: 10.1021/ar020228m. [DOI] [PubMed] [Google Scholar]
- 18.Dorazio SJ, Olatunde AO, Tsitovich PB, Morrow JR. J. Biol. Inorg. Chem. 2014;19:191–205. doi: 10.1007/s00775-013-1059-4. [DOI] [PMC free article] [PubMed] [Google Scholar]
- 19.Hancu I, Dixon WT, Woods M, Vinogradov E, Sherry AD, Lenkinski RE. Acta Radiol. 2010;51:910–923. doi: 10.3109/02841851.2010.502126. [DOI] [PMC free article] [PubMed] [Google Scholar]
- 20.McMahon MT, Gilad AA, DeLiso MA, Berman SMC, Bulte JWM, Zijl P. C. M. v. Magn. Reson. Med. 2008;60:803–812. doi: 10.1002/mrm.21683. [DOI] [PMC free article] [PubMed] [Google Scholar]
- 21.Chan KW, Yu T, Qiao Y, Liu Q, Yang M, Patel H, Liu G, Kinzler KW, Vogelstein B, Bulte JW, van Zijl PC, Hanes J, Zhou S, McMahon MT. J. Controlled Release. 2014;180:51–59. doi: 10.1016/j.jconrel.2014.02.005. [DOI] [PMC free article] [PubMed] [Google Scholar]
- 22.Zhang X, Lin Y, Gillies RJ. J. Nucl. Med. 2010;51:1167–1170. doi: 10.2967/jnumed.109.068981. [DOI] [PMC free article] [PubMed] [Google Scholar]
- 23.Gallagher FA, Kettunen MI, Brindle KM. NMR Biomed. 2011;24:1006–1015. doi: 10.1002/nbm.1742. [DOI] [PubMed] [Google Scholar]
- 24.Xu Y, Tang P. BBA-Biomembranes. 1997;1323:154–162. doi: 10.1016/s0005-2736(96)00184-8. [DOI] [PubMed] [Google Scholar]
- 25.Rubin SM, Lee SY, Ruiz EJ, Pines A, Wemmer DE. J. Mol. Biol. 2002;322:425–440. doi: 10.1016/s0022-2836(02)00739-8. [DOI] [PubMed] [Google Scholar]
- 26.Kim BS, Ko YH, Kim Y, Lee HJ, Selvapalam N, Lee HC, Kim K. Chem. Commun. 2008:2756–2758. doi: 10.1039/b805724a. [DOI] [PubMed] [Google Scholar]
- 27.Fogarty HA, Berthault P, Brotin T, Huber G, Desvaux H, Dutasta JP. J. Am. Chem. Soc. 2007;129:10332–10333. doi: 10.1021/ja073771c. [DOI] [PubMed] [Google Scholar]
- 28.Huber G, Brotin T, Dubois L, Desvaux H, Dutasta JP, Berthault P. J. Am. Chem. Soc. 2006;128:6239–6246. doi: 10.1021/ja060266r. [DOI] [PubMed] [Google Scholar]
- 29.Hill PA, Wei Q, Eckenhoff RG, Dmochowski IJ. J. Am. Chem. Soc. 2007;129:11662–11662. doi: 10.1021/ja072965p. [DOI] [PubMed] [Google Scholar]
- 30.Hill PA, Wei Q, Troxler T, Dmochowski IJ. J. Am. Chem. Soc. 2009;131:3069–3077. doi: 10.1021/ja8100566. [DOI] [PMC free article] [PubMed] [Google Scholar]
- 31.Jacobson DR, Khan NS, Colle R, Fitzgerald R, Laureano-Perez L, Bai Y, Dmochowski IJ. Proc. Natl. Acad. Sci. U. S. A. 2011;108:10969–10973. doi: 10.1073/pnas.1105227108. [DOI] [PMC free article] [PubMed] [Google Scholar]
- 32.Raftery D. Annu. Rep. NMR Spectro. 2006;57:205–270. [Google Scholar]
- 33.Fairchild RM, Joseph AI, Holman KT, Fogarty HA, Brotin T, Dutasta JP, Boutin C, Huber G, Berthault P. J. Am. Chem. Soc. 2010;132:15505–15507. doi: 10.1021/ja1071515. [DOI] [PubMed] [Google Scholar]
- 34.Spence MM, Rubin SM, Dimitrov IE, Ruiz EJ, Wemmer DE, Pines A, Yao SQ, Tian F, Schultz PG. Proc. Natl. Acad. Sci. U. S. A. 2001;98:10654–10657. doi: 10.1073/pnas.191368398. [DOI] [PMC free article] [PubMed] [Google Scholar]
- 35.Seward GK, Wei Q, Dmochowski IJ. Bioconjugate Chem. 2008;19:2129–2135. doi: 10.1021/bc8002265. [DOI] [PMC free article] [PubMed] [Google Scholar]
- 36.Seward GK, Bai Y, Khan NS, Dmochowski I. Chem. Sci. 2011 doi: 10.1039/C1SC00041A. [DOI] [PMC free article] [PubMed] [Google Scholar]
- 37.Wei Q, Seward GK, Hill PA, Patton B, Dimitrov IE, Kuzma NN, Dmochowski IJ. J. Am. Chem. Soc. 2006;128:13274–13283. doi: 10.1021/ja0640501. [DOI] [PubMed] [Google Scholar]
- 38.Chambers JM, Hill PA, Aaron JA, Han ZH, Christianson DW, Kuzma NN, Dmochowski IJ. J. Am. Chem. Soc. 2009;131:563–569. doi: 10.1021/ja806092w. [DOI] [PMC free article] [PubMed] [Google Scholar]
- 39.Roy V, Brotin T, Dutasta JP, Charles MH, Delair T, Mallet F, Huber G, Desvaux H, Boulard Y, Berthault P. Chemphyschem. 2007;8:2082–2085. doi: 10.1002/cphc.200700384. [DOI] [PubMed] [Google Scholar]
- 40.Kotera N, Tassali N, Leonce E, Boutin C, Berthault P, Brotin T, Dutasta JP, Delacour L, Traore T, Buisson DA, Taran F, Coudert S, Rousseau B. Angew. Chem. Int. Ed. Engl. 2012;51:4100–4103. doi: 10.1002/anie.201109194. [DOI] [PubMed] [Google Scholar]
- 41.Berthault P, Desvaux H, Wendlinger T, Gyejacquot M, Stopin A, Brotin T, Dutasta JP, Boulard Y. Chem. Eur. J. 2010;16:12941–12946. doi: 10.1002/chem.201001170. [DOI] [PubMed] [Google Scholar]
- 42.Meldrum T, Schroder L, Denger P, Wemmer DE, Pines A. J. Magn. Reson. 2010;205:242–246. doi: 10.1016/j.jmr.2010.05.005. [DOI] [PubMed] [Google Scholar]
- 43.Boutin C, Stopin A, Lenda F, Brotin T, Dutasta JP, Jamin N, Sanson A, Boulard Y, Leteurtre F, Huber G, Bogaert-Buchmann A, Tassali N, Desvaux H, Carriere M, Berthault P. Biorg. Med. Chem. 2011;19:4135–4143. doi: 10.1016/j.bmc.2011.05.002. [DOI] [PubMed] [Google Scholar]
- 44.Klippel S, Dopfert J, Jayapaul J, Kunth M, Rossella F, Schnurr M, Witte C, Freund C, Schröder L. Angew. Chem. Int. Ed. Engl. 2014;53:493–496. doi: 10.1002/anie.201307290. [DOI] [PubMed] [Google Scholar]
- 45.Klippel S, Freund C, Schroder L. Nano Lett. 2014;14:5721–5726. doi: 10.1021/nl502498w. [DOI] [PubMed] [Google Scholar]
- 46.Sloniec J, Schnurr M, Witte C, Resch-Genger U, Schroder L, Hennig A. Chem. Eur. J. 2013;19:3110–3118. doi: 10.1002/chem.201203773. [DOI] [PubMed] [Google Scholar]
- 47.Gabard J, Collet A. J. Chem. Soc., Chem. Commun. 1981:1137–1139. [Google Scholar]
- 48.Bai YB, Hill PA, Dmochowski IJ. Anal. Chem. 2012;84:9935–9941. doi: 10.1021/ac302347y. [DOI] [PMC free article] [PubMed] [Google Scholar]
- 49.Schroeder L, Lowery TJ, Hilty C, Wemmer DE, Pines A. Science. 2006;314:446–449. doi: 10.1126/science.1131847. [DOI] [PubMed] [Google Scholar]
- 50.Meldrum T, Seim KL, Bajaj VS, Palaniappan KK, Wu W, Francis MB, Wemmer DE, Pines A. J. Am. Chem. Soc. 2010;132:5936–5937. doi: 10.1021/ja100319f. [DOI] [PubMed] [Google Scholar]
- 51.Stevens TK, Palaniappan KK, Ramirez RM, Francis MB, Wemmer DE, Pines A. Magn. Reson. Med. 2013;69:1245–1252. doi: 10.1002/mrm.24371. [DOI] [PubMed] [Google Scholar]
- 52.Subbarao NK, Parente RA, Szoka FC, Nadasdi L, Pongracz K. Biochemistry. 1987;26:2964–2972. doi: 10.1021/bi00385a002. [DOI] [PubMed] [Google Scholar]
- 53.Nakaya HI, Wrammert J, Lee EK, Racioppi L, Marie-Kunze S, Haining WN, Means AR, Kasturi SP, Khan N, Li GM, McCausland M, Kanchan V, Kokko KE, Li S, Elbein R, Mehta AK, Aderem A, Subbarao K, Ahmed R, Pulendran B. Nat. Immunol. 2011;12:786–795. doi: 10.1038/ni.2067. [DOI] [PMC free article] [PubMed] [Google Scholar]
- 54.Nishimura Y, Takeda K, Ezawa R, Ishii J, Ogino C, Kondo A. J Nanobiotechnol. 2014:12. doi: 10.1186/1477-3155-12-11. [DOI] [PMC free article] [PubMed] [Google Scholar]
- 55.Sasaki K, Kogure K, Chaki S, Nakamura Y, Moriguchi R, Hamada H, Danev R, Nagayama K, Futaki S, Harashima H. Anal. Bioanal. Chem. 2008;391:2717–2727. doi: 10.1007/s00216-008-2012-1. [DOI] [PubMed] [Google Scholar]
- 56.Nouri FS, Wang X, Dorrani M, Karjoo Z, Hatefi A. Biomacromolecules. 2013;14:2033–2040. doi: 10.1021/bm400380s. [DOI] [PubMed] [Google Scholar]
- 57.Nicol F, Nir S, Szoka FC. Biophys. J. 1999;76:2121–2141. doi: 10.1016/S0006-3495(99)77368-6. [DOI] [PMC free article] [PubMed] [Google Scholar]
- 58.Taratula O, Hill PA, Bai Y, Khan NS, Dmochowski IJ. Org. Lett. 2011;13:1414–1417. doi: 10.1021/ol200088f. [DOI] [PMC free article] [PubMed] [Google Scholar]
- 59.Rostovtsev VV, Green LG, Fokin VV, Sharpless KB. Angew. Chem. Int. Ed. Engl. 2002;41:2596–2599. doi: 10.1002/1521-3773(20020715)41:14<2596::AID-ANIE2596>3.0.CO;2-4. [DOI] [PubMed] [Google Scholar]
- 60.Tornoe CW, Christensen C, Meldal M. J. Org. Chem. 2002;67:3057–3064. doi: 10.1021/jo011148j. [DOI] [PubMed] [Google Scholar]
- 61.Haas DH, Murphy RM. J. Pept. Res. 2004;63:9–16. doi: 10.1046/j.1399-3011.2004.00098.x. [DOI] [PubMed] [Google Scholar]
- 62.Li WJ, Nicol F, Szoka FC. Adv. Drug Del. Rev. 2004;56:967–985. doi: 10.1016/j.addr.2003.10.041. [DOI] [PubMed] [Google Scholar]
- 63.De Lauder WB, Wahl P. Biochemistry. 1970;9:2750–2754. doi: 10.1021/bi00815a025. [DOI] [PubMed] [Google Scholar]
- 64.Song M, Liu S, Yin J, Wang H. Int. J. Mol. Sci. 2011;12:4964–4974. doi: 10.3390/ijms12084964. [DOI] [PMC free article] [PubMed] [Google Scholar]
- 65.Liu S, Sui Y, Guo K, Yin Z, Gao X. Nanoscale Res. Lett. 2012;7:433. doi: 10.1186/1556-276X-7-433. [DOI] [PMC free article] [PubMed] [Google Scholar]
- 66.Belgorodsky B, Fadeev L, Ittah V, Benyamini H, Zelner S, Huppert D, Kotlyar AB, Gozin M. Bioconjug. Chem. 2005;16:1058–1062. doi: 10.1021/bc050103c. [DOI] [PubMed] [Google Scholar]
- 67.Pelloni S, Lazzeretti P, Zanasi R. J. Phys. Chem. A. 2007;111:3110–3123. doi: 10.1021/jp067540o. [DOI] [PubMed] [Google Scholar]
- 68.Poater J, Bofill JM, Alemany P, Sola M. J. Org. Chem. 2006;71:1700–1702. doi: 10.1021/jo052095z. [DOI] [PubMed] [Google Scholar]
- 69.Munoz-Castro A. Chem. Phys. Lett. 2011;517:113–115. [Google Scholar]
- 70.Clever HL. Krypton, Xenon, and Radon: Gas Solubilities. Pergamon Press; Oxford: 1979. [Google Scholar]
- 71.Etzerodt TP, Trier S, Henriksen JR, Andresen TL. Soft Matter. 2012;8:5933–5939. [Google Scholar]
Associated Data
This section collects any data citations, data availability statements, or supplementary materials included in this article.


