

In patients with arrhythmogenic right ventricular (RV) dysplasia/cardiomyopathy, ventricular fatty infiltration and late gadolinium enhancement are common, are associated with advanced RV structural disease and proband status, and are seen in a minority of patients with isolated regional RV wall motion abnormalities who do not completely fulfill current diagnostic criteria.
Abstract
Purpose
To determine the incidence of ventricular fatty replacement and late gadolinium enhancement (LGE) at cardiac magnetic resonance (MR) imaging in patients with arrhythmogenic right ventricular (RV) dysplasia/cardiomyopathy (ARVD/C) and the relationship of these findings to disease severity.
Materials and Methods
This was a retrospective institutional review board–approved HIPAA-compliant study. All subjects provided written informed consent. Seventy-six patients with ARVD/C were enrolled from 2002 to 2012. Quantitative and qualitative cardiac MR imaging analyses of the RV and the left ventricle (LV) were performed to determine cardiac MR imaging–specific Task Force Criteria (TFC) and non-TFC features (ARVD/C-type pattern of fatty infiltration and/or nonischemic pattern LGE). Patients were separated into four groups on the basis of cardiac MR imaging TFC: (a) patients with major cardiac MR imaging criteria, (b) patients with minor criteria, (c) patients with partial criteria, and (d) patients with no criterion. Continuous variables were compared by using the independent Student t test and analysis of variance. Categoric variables were compared by using the Fisher exact test.
Results
Of 76 patients (mean age, 34.2 years ± 14 [standard deviation]; 51.3% men), 42 met major cardiac MR imaging criteria, seven met minor criteria, seven met partial criteria, and 20 met no criterion. Most probands (36 [80.0%] of 45) met major or minor cardiac MR imaging criteria. Only 13 (41.9%) of 31 family members met any cardiac MR imaging criterion. The most common non-TFC MR imaging features were RV fatty infiltration (28.9%) and LV LGE (35.5%). Non-TFC cardiac MR imaging features were seen in 88.1% of subjects with major criteria, in 28.6% of those with minor criteria, in 71.4% of those with partial criteria, and in 10.0% of those with no criteria.
Conclusion
In this large cohort of patients with ARVD/C, non-TFC findings of ventricular fatty infiltration and LGE were frequent and were most often found in those who met major cardiac MR imaging criteria and in probands.
© RSNA, 2016
Introduction
Arrhythmogenic right ventricular (RV) dysplasia/cardiomyopathy (ARVD/C) characteristically affects the RV and manifests in ventricular arrhythmias and RV dysfunction (1,2). Histologically, there is fibrofatty replacement of the RV myocardium (3). Diagnosis is challenging because of the disease’s nonspecific findings and is currently based on meeting a set of major and minor criteria (Task Force Criteria [TFC]) that encompass imaging and histopathologic findings, electrocardiographic abnormalities, arrhythmia history, and genetic factors. These criteria were initially proposed in 1994 and were subsequently revised in 2010 (4).
Cardiac magnetic resonance (MR) imaging is a critical tool for evaluating structural cardiac abnormalities in subjects being examined for ARVD/C (5). The cardiac MR imaging criteria described by the 2010 TFC are defined by a combination of both regional RV wall-motion abnormalities (WMAs) and abnormalities in quantitative RV ejection fraction (RVEF) and/or RV end-diastolic volume index (RVEDVI) (4). These criteria were created on the basis of data in a cohort of 44 probands compared with control subjects, with quantitative thresholds of RV volume and RVEF selected to maximize diagnostic specificity (4). With the advent of genetic screening, greater numbers of family members of ARVD/C probands are receiving a diagnosis at an early, asymptomatic stage. The cardiac MR imaging findings in this population have not been well described.
Additional myocardial abnormalities are seen in patients with ARVD/C that were not included in the 2010 TFC, namely, fatty infiltration and late gadolinium enhancement (LGE) (6). We have found that occasionally these non-TFC features suggestive of ARVD/C may be present in patients who would otherwise not meet major or minor cardiac MR imaging criteria. The relationship of these findings to standard quantitative measures of RV function and cardiac MR imaging–specific TFC is not well understood. Therefore, our purpose was to determine the incidence of ventricular fatty replacement and LGE at cardiac MR imaging in patients with ARVD/C and the relationship of these findings to disease severity.
Materials and Methods
Study Population
This was a retrospective study of subjects enrolled in an institutional ARVD/C registry from 2002–2012. All individuals provided written informed consent. The study protocol was Health Insurance Portability and Accountability Act compliant and was approved by the institutional review board. Data for all subjects in the registry with a diagnosis of ARVD/C on the basis of the 2010 TFC (4) and available cardiac MR imaging studies were reviewed (n = 105). Of the available cardiac MR imaging studies, 29 were excluded because they were missing essential sequences for the evaluation of both fat and LGE. Because of the rarity of ARVD/C, some of the members of this patient cohort have been included in previous studies (7–10). Four studies have involved members of this cohort. A study of serial cardiac MR imaging changes in patients at risk for ARVD/C included 21 of the 76 subjects from this study (7). A prior report on the prevalence of biventricular disease in ARVD/C reported data in 49 of the 76 subjects (8). A study of the additive value of cardiac MR imaging for defining prognosis in ARVD/C mutation carriers included 39 of the 76 subjects (9). Finally, a study of the most common locations of RV WMAs in patients with ARVD/C and mutation carriers included 46 of the 76 subjects.
Cardiac MR Imaging Protocol
Studies at the authors’ institution (n = 62) were performed with 1.5-T MR imaging units (CV/I, GE Medical Systems, Waukesha, Wis; or Avanto, Siemens, Erlangen, Germany). A detailed protocol is shown in Table E1 (online) and has been described in previous reports (11). Studies from outside centers (n = 14) were also performed at 1.5 T and with CV/I or Avanto units. For inclusion, studies must have included a minimum of double–inversion recovery fast spin-echo (FSE) sequences, cine functional images in the long- and short-axis planes, and postcontrast breath-hold two-dimensional segmented gradient-echo LGE images.
Quantitative Cardiac MR Analysis
Cardiac MR images were analyzed with dedicated software (QMASS; Medis, Leiden, the Netherlands). Measurements were performed by a single reader with 2 years of cardiac MR imaging experience (N.R.) who was blinded to clinical information. Endocardial margins of the left ventricle (LV) and RV were contoured manually on end-systolic and end-diastolic images. Papillary muscles were included in the blood pool volume. End-systolic volume index, end-diastolic volume index, and ejection fraction for both ventricles were obtained. Volumes were indexed to body surface area (BSA) [BSA = body weight (in kilograms)0.425 × height (in centimeters)0.725 × 0.007184] (12).
Qualitative Cardiac MR Analysis
Cardiac MR images were assessed in consensus by two blinded readers (I.R.K., S.L.Z.) with 10 and 4 years of experience. Examinations were assessed for RV regional dyskinesia, akinesia, or dyssynchronous RV contraction as per the 2010 TFC, with the location recorded on the basis of a five-segment RV model that has been previously described (10). WMAs had to be present on at least two contiguous cine images or in multiple planes to avoid false-positive findings on short-axis images due to partial-volume effects from RV through-plane motion.
Cardiac MR Imaging TFC Scoring
The presence or absence of each of the cardiac MR imaging–specific TFC for ARVD/C was scored on the basis of qualitative and quantitative results. Research review of cardiac MR data was not used to establish the diagnosis of ARVD/C, which was strictly based on 2010 global TFC at the time of clinical diagnosis. As per the 2010 TFC, subjects required a regional WMA combined with either reduced RVEF or increased RVEDVI to meet major or minor criteria. Subjects with major criteria had an RVEDVI of more than 110 mL/m2 (male patients) or more than 100 mL/m2 (female patients) or an RVEF of less than 40%. Subjects with minor criteria had an RVEDVI of more than 100 but less than 110 mL/m2 (male patients) or more than 90 but less than 100 mL/m2 (female patients) or an RVEF of more than 40% but less than 45%. Subjects with findings limited to either a regional WMA or abnormal RVEDVI or RVEF but not both did not meet cardiac MR imaging TFC and were classified in the partial cardiac MR imaging criteria group.
Non-TFC Cardiac MR Imaging Features
The same two blinded readers also scored the presence or absence of fatty infiltration and LGE of both ventricles in consensus. Locations of each were scored by using the same standard LV and RV segmental models used to record WMAs. RV fat infiltration was identified by a pattern of high-signal-intensity fingerlike projections disrupting the normal smooth epicardial contour of the RV on FSE images, as previously described (Fig 1) (13). RV fat infiltration with smooth RV wall thickening was considered a non-ARVD/C pattern and was excluded (Fig 2). LV fat infiltration was identified by high signal intensity within the LV myocardium on FSE images or high signal intensity with India-ink etching artifact on steady-state free precession images (Fig 3) (14,15). In regions with suspected subepicardial fat infiltration, a contour deformity and regional LV wall thinning were required to distinguish epicardial fat outside the LV from fatty infiltration (Fig 3). LGE was identified by regions of increased signal relative to nulled myocardium. Ischemic-pattern LV LGE was excluded. In the RV, LGE was identified by regional wall hyperenhancement visually distinct from nulled RV myocardium. Subjects demonstrating increased FSE and LGE signal in the same segment were considered positive for both fat and LGE, as it was not possible to distinguish mixed fat and fibrosis from pure fat (Fig 3).
Figure 1a:
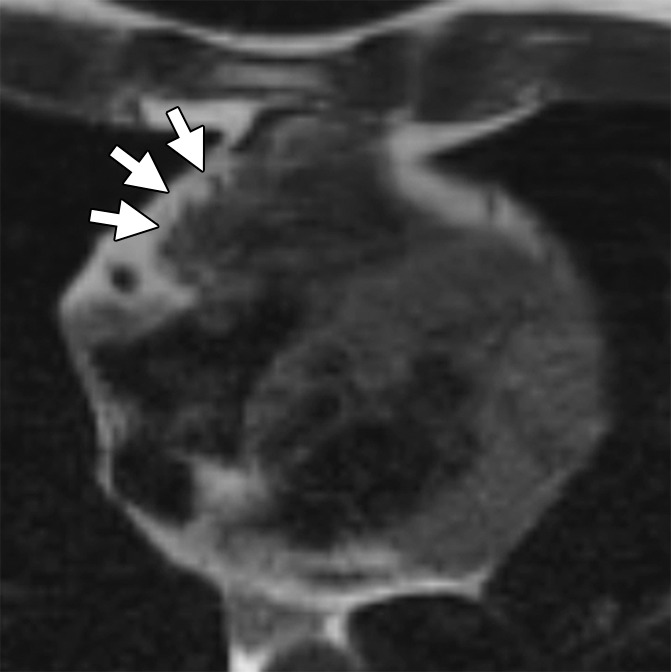
ARVD/C-type pattern of RV fat infiltration. Axial T1-weighted dark-blood MR images (a) without and (b) with fat saturation in a 45-year-old man with ARVD/C and major cardiac MR imaging criteria. There is focal subepicardial fat infiltration in the basilar RV, which has a typical fingerlike pattern of high signal intensity projecting into the thinned RV wall (arrows), with nulling on the fat-saturated image.
Figure 2:
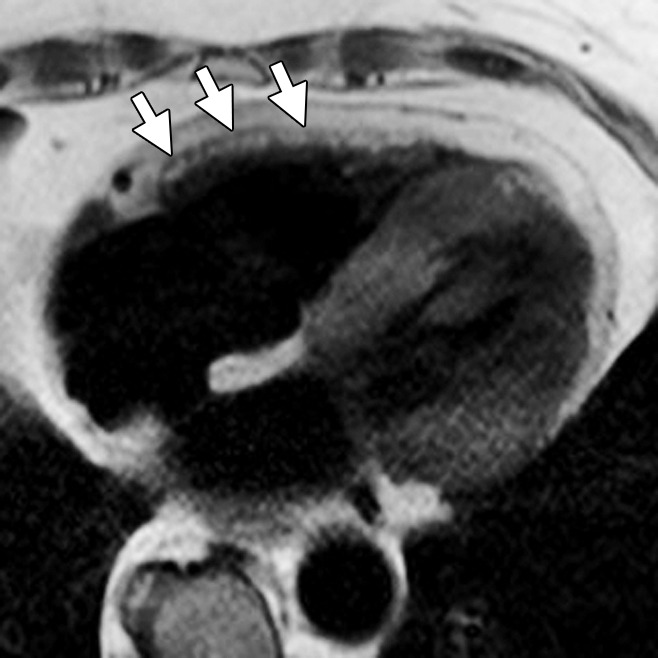
Non-ARVD/C pattern of RV fat. Axial dark-blood MR image in 89-year-old woman with temporal arteritis shows diffuse fatty infiltration in the RV (arrows). In contrast to the ARVD/C pattern, there is smooth thickening of the RV wall with high signal intensity, unlike the irregular fingerlike involvement and thinning seen in patients with ARVD/C.
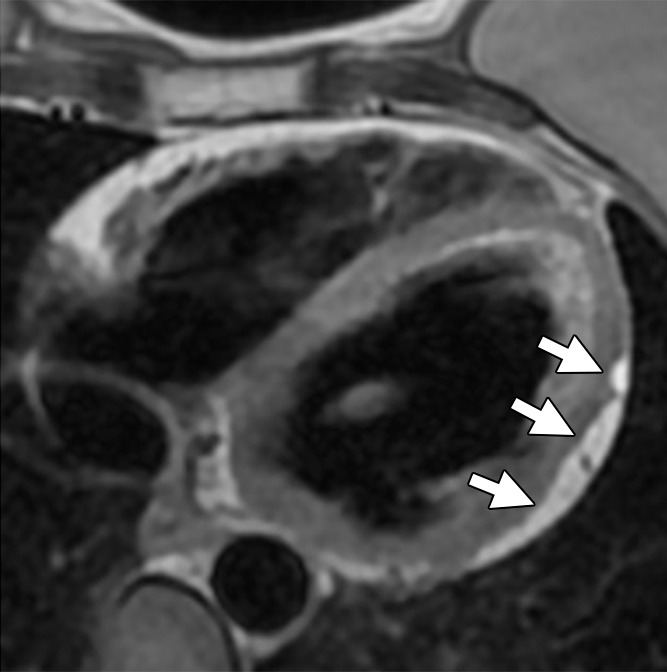
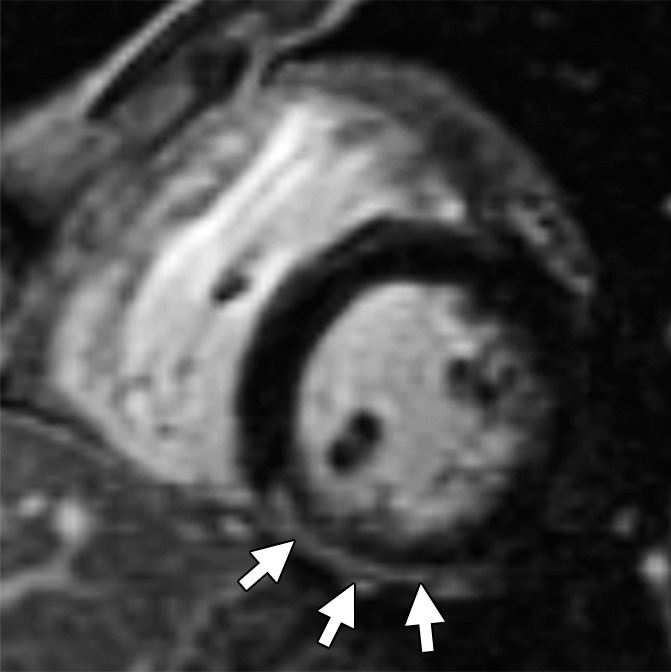
Figure 3a:
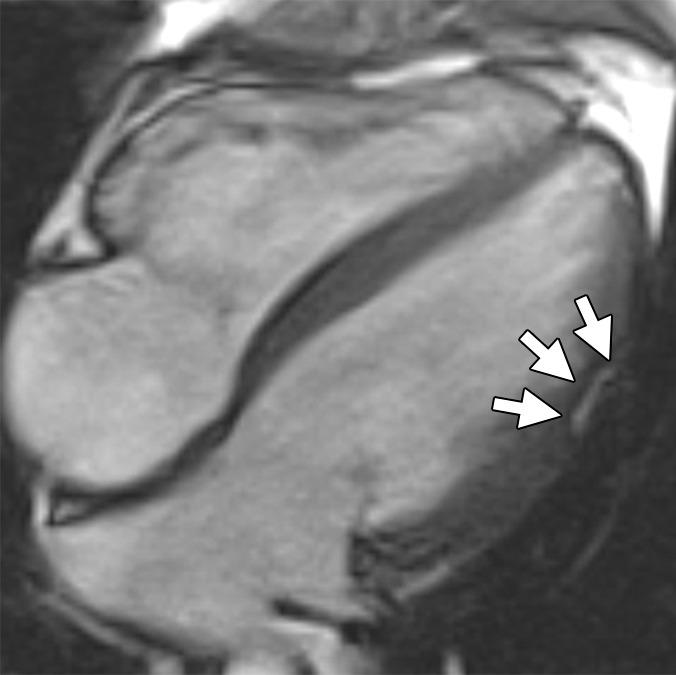
Non-TFC cardiac MR imaging features in a patient with ARVD/C with major cardiac MR imaging criteria. Four-chamber (a) bright-blood and (b) dark-blood MR images in a 27-year-old man who met major clinical and MR imaging criteria for ARVD/C. There is focal subepicardial fat infiltration in the apicolateral wall of the LV (arrows), which demonstrates peripheral etching on the bright-blood image and high signal on the dark-blood T1-weighted image. (c) Four-chamber LGE image. There is focal subepicardial enhancement (arrows) that corresponds to the region of fat infiltration and extends further apically and toward the base.
Figure 1b:
ARVD/C-type pattern of RV fat infiltration. Axial T1-weighted dark-blood MR images (a) without and (b) with fat saturation in a 45-year-old man with ARVD/C and major cardiac MR imaging criteria. There is focal subepicardial fat infiltration in the basilar RV, which has a typical fingerlike pattern of high signal intensity projecting into the thinned RV wall (arrows), with nulling on the fat-saturated image.
Figure 3b:
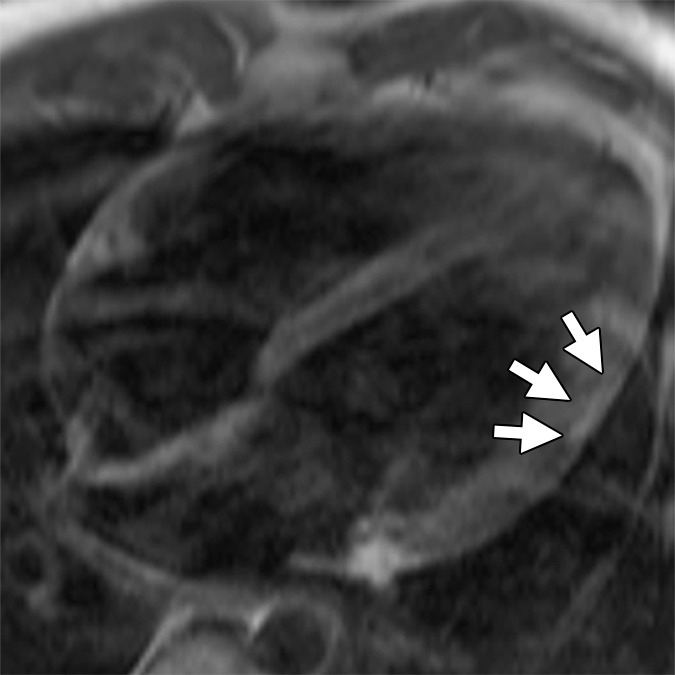
Non-TFC cardiac MR imaging features in a patient with ARVD/C with major cardiac MR imaging criteria. Four-chamber (a) bright-blood and (b) dark-blood MR images in a 27-year-old man who met major clinical and MR imaging criteria for ARVD/C. There is focal subepicardial fat infiltration in the apicolateral wall of the LV (arrows), which demonstrates peripheral etching on the bright-blood image and high signal on the dark-blood T1-weighted image. (c) Four-chamber LGE image. There is focal subepicardial enhancement (arrows) that corresponds to the region of fat infiltration and extends further apically and toward the base.
Figure 3c:
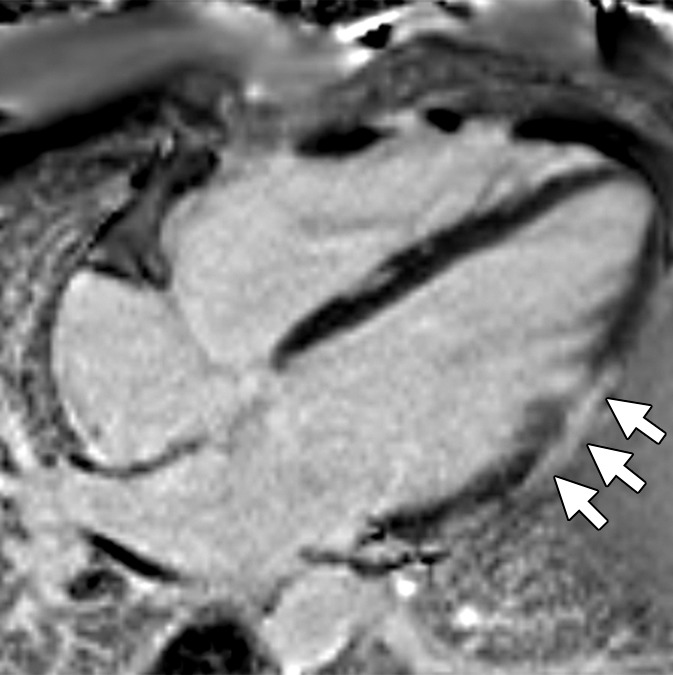
Non-TFC cardiac MR imaging features in a patient with ARVD/C with major cardiac MR imaging criteria. Four-chamber (a) bright-blood and (b) dark-blood MR images in a 27-year-old man who met major clinical and MR imaging criteria for ARVD/C. There is focal subepicardial fat infiltration in the apicolateral wall of the LV (arrows), which demonstrates peripheral etching on the bright-blood image and high signal on the dark-blood T1-weighted image. (c) Four-chamber LGE image. There is focal subepicardial enhancement (arrows) that corresponds to the region of fat infiltration and extends further apically and toward the base.
Statistical Analysis
All continuous variables were reported as means ± standard deviations, and categoric variables were reported as numbers and percentages. Continuous variables were compared by using the independent Student t test for normally distributed variables and the Mann-Whitney U test for non–normally distributed variables. For multiple comparisons of continuous variables, the analysis of variance test was used for normally distributed variables and the Kruskal-Wallis test was used for non–normally distributed variables. Bonferroni post-hoc analysis was used to correct for multiple comparisons. Categoric variables were compared by using the Fisher exact test. Multivariable linear regression analysis was used to evaluate the association of quantitative findings with TFC criteria while controlling for sex. All statistical analyses were performed by using statistical software (STATA, version 12; Stata, College Station, Tex). P < .05 was considered to indicate a statistically significant difference.
Results
Clinical and Demographic Data
We included 76 subjects (mean age, 34.2 years; 51% men) with definite ARVD/C according to the 2010 TFC, of whom 45 (59%) were probands and 31 (40%) had been given a diagnosis at family screening. Forty-five (59%) subjects harbored pathogenic ARVD/C-associated mutations, the majority plakophilin 2 (36 [80%] of 45). There was no significant difference in the prevalence of ARVD/C-associated mutations between probands and family members (53% vs 68%, P = .24), although the power was low for comparing proportions given the small sample sizes.
Quantitative RV and LV Findings for Entire Cohort
Quantitative results for cardiac MR imaging analysis are shown in Table 1. For the entire cohort, mean RV function was reduced (RVEF, 42% ± 10) and RVEDVI was increased (105 mL/m2 ± 26 for the cohort) compared with previously published normal reference values for cardiac MR imaging (RVEF, 61% ± 6; RVEDVI, 91 mL/m2 ± 16) (16). Mean LV function was reduced (LVEF, 54% ± 6) and LV size was enlarged (LVEDVI, 88 mL/m2 ± 19) compared with reference values (LVEF, 69% ± 6; LVEDVI, 80 mL/m2 ± 13) (16). For the whole cohort, quantitative RV volumes and function were worse in probands, with RVESVI and RVEDVI (P < .001 for both) significantly higher and RVEF significantly lower (P < .001) than in family members (Table 1). When male and female subjects were analyzed separately (Table E2 [online]), all measures of quantitative RV volumes and function remained significantly worse for female probands (P < .01 for all). In male subjects, RVEF was significantly worse for probands (P = .02), whereas for RVESVI and RVEDVI, there was no significant difference by pedigree (RVESVI, P = .05; RVEDVI, P = .29). There was no difference in LVEDVI and LVEF in probands compared with family members (P = .49 and P = .10, respectively).
Table 1.
Demographic and Cardiac MR Imaging Data in All Subjects, Probands, and Family Members
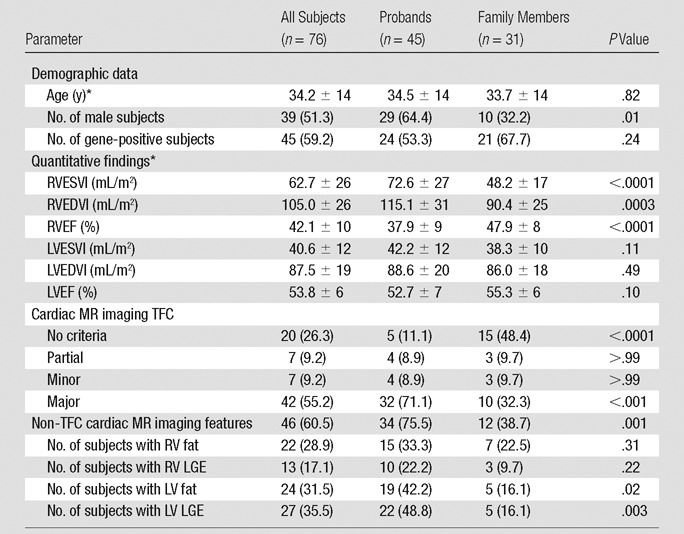
Note.—Unless otherwise specified, data are numbers of subjects, with percentages in parentheses. RVESVI = RV end-systolic volume index, LVEDVI = LV end-diastolic volume index, LVESVI = LV end-systolic volume index, LVEF = LV ejection fraction.
*Data are means ± standard deviations.
Cardiac MR Imaging–specific TFC Findings
Subjects were divided into four groups based on the presence or absence of cardiac MR imaging TFC. The majority of subjects met major cardiac MR imaging TFC (n = 42, 55%), seven (9%) met minor cardiac MR imaging TFC, seven (9%) met partial cardiac MR imaging criteria, and 20 (26%) met no cardiac MR imaging criterion. The relationships of cardiac MR imaging TFC group with quantitative RV measures are shown in Table 2. RVEDVI, RVESVI, and RVEF were significantly different between groups, and, as expected, were most abnormal in the major TFC category. Post-hoc analysis indicated significant differences between major cardiac MR imaging criteria and each of the other groups. Multivariable linear regression analysis showed no significant influence of sex on the association of RV quantitative measures and major criteria. There was a significant P value for the trend of LVESVI and LVEF across the four groups; however, when corrected for multiple comparisons, differences were no longer significant. The majority of subjects who met major cardiac MR imaging criteria were probands (76%), whereas subjects who met no cardiac MR imaging criterion were mostly family members (75%). Differences were due to more severe RV disease in probands (Table 1), reflected by higher RVEDVI (115 mL/m2 ± 31 vs 90 mL/m2 ± 25), lower RVEF (38% ± 9 vs 48% ± 8), and more frequent RV WMAs (89% vs 45%, P < .0001).
Table 2.
Incidence of Cardiac MR Imaging Findings in Four Groups on the Basis of Cardiac MR Imaging TFC Fulfillment
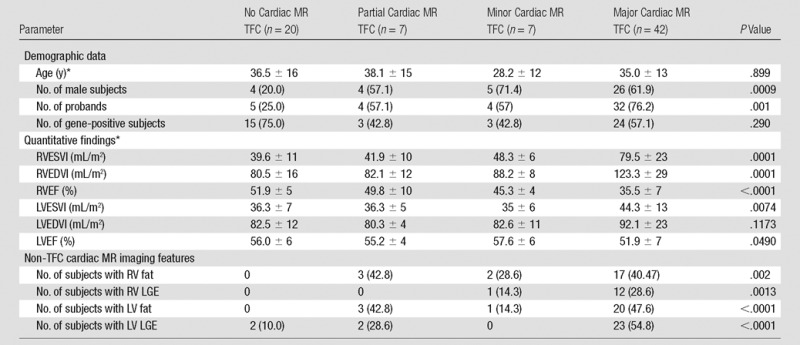
Note.—Unless otherwise specified, data are numbers of subjects, with percentages in parentheses.
*Data are means ± standard deviations.
Non-TFC MR Imaging Features
Non-TFC cardiac MR imaging features grouped by fulfillment of cardiac MR imaging–specific TFC are detailed in Table 2. Complete subject-level data summarizing quantitative and qualitative data for both cardiac MR imaging–specific TFC and non-TFC cardiac MR imaging features for each subject are available in Table E3 (online). All non-TFC cardiac MR imaging features were more common in the major cardiac MR imaging criteria group than in the other groups (P < .05). Non-TFC cardiac MR imaging features were seen in 88% (37 of 42) of the major cardiac MR imaging criteria group and in 28% (two of seven) of the relatively small minor criteria group. Probands had non-TFC cardiac MR imaging features more often than did family members (76% vs 39%, P = .001), reflective of the more extensive RV structural disease in this group. In the RV, 29% of subjects had fat infiltration, most often present in the RV free wall. There was no significant difference in RV fat between probands and family members (33% vs 23%, P = .31). RV fatty infiltration was significantly more common among subjects with the most severe structural disease in the RV, occurring in 40% of subjects who met major cardiac MR imaging TFC, compared with in 9% of subjects who did not meet cardiac MR imaging criteria. RV LGE was less common; it was seen in only 13 subjects (18%), most often in the RV inferior wall. There was no difference in RV LGE between probands and family members (22% vs 10%, P = .22). In the LV, fatty infiltration and LGE were present in approximately one-third of subjects (32% and 36%, respectively), both most common in the lateral wall. LV fat and LV LGE were both more common in probands (fat, 42% vs 16%; LV LGE, 49% vs 16%; P < .05 for both). No subjects had LV LGE in an ischemic-type pattern. Sixty-three percent of ARVD/C subjects diagnosed through family member screening had normal cardiac MR imaging examinations with no detectable structural RV (or LV) disease.
Subjects with Partial Cardiac MR Imaging Criteria
In the partial cardiac MR imaging criteria group, non-TFC cardiac MR imaging features were frequently seen (in five [71.4%] of seven subjects). One subject had a combination of RV fat, LV fat, and LV LGE; one had a combination of LV fat and LV LGE; two had isolated RV fat infiltration; and one had isolated LV fat infiltration (Fig 4). These subjects all had associated RV WMAs. The demographic and clinical features of subjects with partial cardiac MR imaging criteria are detailed in Table E3 (online). Subjects with partial cardiac MR imaging criteria had a wide age range (mean, 38 years; range, 17–62 years), and most (six of seven) were placed in the partial cardiac MR imaging criteria group because they had a focal RV WMA but normal RVEF and RF volumes. This group contained similar numbers of male and female subjects as well as probands and family members.
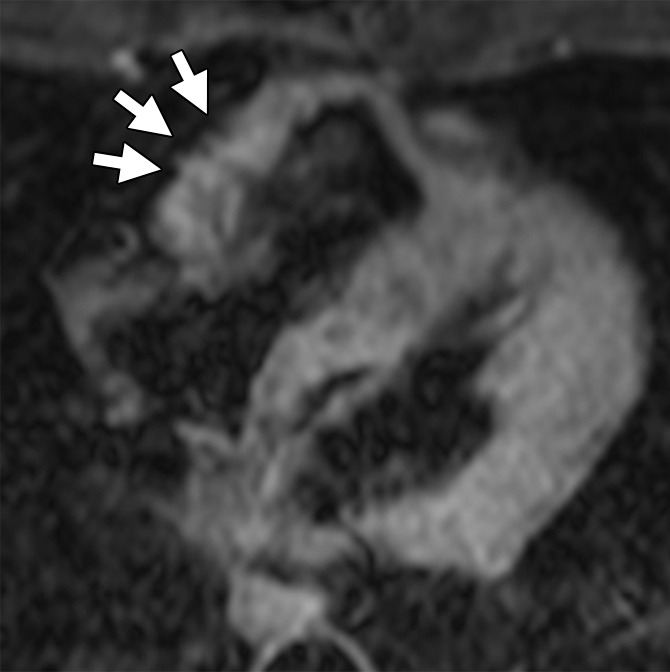
Figure 4a:
Non-TFC cardiac MR imaging features in a 41-year-old with ARVD/C with partial cardiac MR imaging criteria. She had been given a diagnosis of ARVD/C on the basis of clinical criteria. (a) Four-chamber T1-weighted dark-blood MR image and (b) short-axis LGE MR image. The four-chamber image shows focal subepicardial fat infiltration in the apicolateral wall of the LV (arrows), which has high signal intensity. The LGE image shows subepicardial enhancement in the basilar inferior wall (arrows) in a nonischemic pattern.
Figure 4b:
Non-TFC cardiac MR imaging features in a 41-year-old with ARVD/C with partial cardiac MR imaging criteria. She had been given a diagnosis of ARVD/C on the basis of clinical criteria. (a) Four-chamber T1-weighted dark-blood MR image and (b) short-axis LGE MR image. The four-chamber image shows focal subepicardial fat infiltration in the apicolateral wall of the LV (arrows), which has high signal intensity. The LGE image shows subepicardial enhancement in the basilar inferior wall (arrows) in a nonischemic pattern.
Subjects with No Cardiac MR Imaging Criteria
Subjects with ARVD/C who fulfilled no cardiac MR criteria had the lowest RVESVI and RVEDVI and the highest RVEF (Table 2). There were no significant differences in LVEF and LVESVI when they were corrected for multiple comparisons. Only two patients, both with LV LGE, had non-TFC cardiac MR imaging features. No patient had RV fibrofatty infiltration. The first patient was a 43-year-old female proband with normal RV size and function but marked LV dilation and dysfunction (LVEDVI, 102 mL/m2; ejection fraction, 43%) and extensive subepicardial LV LGE. She met criteria on the basis of electrocardiographic findings and a history of arrhythmia; her phenotype was consistent with an LV-predominant or “left-sided” ARVD/C. She was positive for a desmoplakin mutation, which has been associated with the left-sided phenotype. The other patient was a 57-year-old family member with a known extradesmosomal mutation who had multifocal midmyocardial and subepicardial LV LGE but preserved LV size and function.
Discussion
In the current study of fibrofatty changes in a large cohort of subjects with ARVD/C, we report two key findings. First, fat infiltration and/or fibrosis are most common in subjects with RV structural disease that fulfills major cardiac MR imaging criteria, often probands. Second, these features may also be found in patients with ARVD/C with partial cardiac MR imaging criteria, suggesting a potential role for the diagnosis of ARVD/C in patients who would otherwise not meet current cardiac MR imaging criteria.
Myocyte loss with fibrotic and/or fibrofatty replacement is the pathologic hallmark of ARVD/C (3). However, the 2010 TFC do not support the use of either feature for the diagnosis of ARVD/C. Study results have shown that fatty infiltration assessment in the RV is subjective, lacking reproducibility and specificity (17–20). In the North American Multidisciplinary Study of Right Ventricular Dysplasia (21), RV fat was identified in 60% of probands and was less sensitive and specific than quantitative RV measures for the diagnosis of ARVD/C. In this study, RV fat was found in 29% of subjects and was more common in those with severe RV structural disease, occurring in 40% of subjects who met major cardiac MR imaging TFC versus in only 9% of those who did not meet cardiac MR imaging TFC. RV fibrosis has a variable prevalence reported in the literature. In a study of 30 subjects who were suspected of having ARVD/C, RV LGE was found in 67% of those who were eventually given a diagnosis of ARVD/C and in none of 18 subjects without the diagnosis (6). Marra et al (22) found RV LGE in 39% of 23 subjects with ARVD/C. In contrast, we found RV LGE in only 16% of our 76 subjects with ARVD/C, and it localized mostly to the inferior wall. RV LGE was more often seen in probands than in family members and in those who met minor and major cardiac MR imaging TFC.
LV fibrofatty changes are well described in ARVD/C; however, they also play no role in the diagnosis of ARVD/C. In one cohort from the United Kingdom, which included a relatively large number of patients with ARVD/C with a desmoplakin mutation (39 of 200), LV abnormalities were seen in more than 80% of subjects (23). In our cohort of predominantly plakophilin 2 carriers, we found a lower prevalence of LV changes, with fat and fibrosis in 30% and 33% of subjects, respectively. This discrepancy is likely at least partially accounted for by genetic differences between these groups (24). As with RV fibrofatty changes, LV findings increased with proband status and increasing RV structural disease, seen in 48%–55% of subjects with major cardiac MR imaging TFC. Interestingly, LV function was relatively preserved even in the major cardiac MR imaging TFC group (LVEF, 51.9% ± 7), with no significant differences in LVEF between the major, minor, partial, and no TFC groups at individual comparisons.
A significant portion (36%) of the ARVD/C population in our study did not meet either major or minor cardiac MR imaging TFC; the majority of these subjects were revealed through family member screening. Importantly, family members with ARVD/C have a much lower prevalence of structural disease than probands (63% of family members showed no detectable RV disease). Many family members fulfilled global TFC because of points from electrical and genetic criteria. This is not unexpected, given that these subjects generally have mild or even asymptomatic disease. These results support recent suggestions that electrical abnormalities precede structural abnormalities in ARVD/C (9).
We hypothesized that in subjects not meeting cardiac MR imaging TFC, fatty infiltration and/or fibrosis might be early indicators of ARVD/C. Indeed, five (71.5%) of seven subjects with partial cardiac MR imaging criteria had LV or RV fatty infiltration and/or fibrosis. Of these five subjects, all demonstrated some degree of fatty infiltration, with two showing RV involvement; two, LV involvement; and one, a combination of both. LV LGE was seen in two cases; however, none had RV LGE. Given the very small sample size of the partial cardiac MR imaging criteria group, it is impossible to draw definitive conclusions about the significance of these non-TFC findings. However, of these features, we believe that LV fat infiltration in particular merits further study. LV LGE in a nonischemic pattern is nonspecific and can be seen in a multitude of cardiomyopathies, particularly sarcoidosis, which is known to mimic ARVD/C (25). RV LGE is challenging to identify given the limitations of the thin RV wall. LV fat infiltration, however, has not been described in other nonischemic cardiomyopathies, suggesting it could represent a specific, if not sensitive (seen in only 48% of subjects with major cardiac MR imaging criteria) marker for ARVD/C. RV fat infiltration in an ARVD/C-type pattern may also have utility; however, further studies of reproducibility and specificity will be needed, given potential overlap with non-ARVD/C conditions.
There were some limitations to our study. A minority of cases were from outside institutions with some variations in imaging technique. We excluded studies that did not include essential sequences. In addition, we had very small numbers of patients with minor cardiac MR imaging criteria (7) and with partial cardiac MR imaging criteria (7), which limits our ability to draw definitive conclusions. Our adherence to TFC limits application of conclusions to “left-dominant ARVC.” Fat can result in high signal on both FSE and LGE images; therefore, findings in the same location could represent fat or a combination of fat and fibrosis. Future studies involving fat-water separated Dixon techniques could be helpful to distinguish these features.
In conclusion, in subjects with ARVD/C, ventricular fatty infiltration and LGE are common, are associated with advanced RV structural disease and proband status, and are seen in a minority of subjects with isolated regional RV WMAs who do not completely fulfill current criteria. Although these findings are not part of current diagnostic criteria, our results suggest a need for further study to examine the potential additive utility of these findings, particularly LV fat infiltration, which may have utility for the diagnosis of ARVD/C.
Advances in Knowledge
■ Ventricular fatty infiltration and late gadolinium enhancement are common: At least one of these features was found in 61% of all patients with arrhythmogenic right ventricular (RV) dysplasia/cardiomyopathy (ARVD/C).
■ Fibrofatty changes had a higher prevalence in patients with ARVD/C, with more severe RV structural disease, as reflected by fulfillment of cardiac MR imaging Task Force Criteria (TFC); RV fat was seen in 39% of the subjects who met either major or minor cardiac MR imaging TFC, whereas it was not seen in any subjects who did not meet cardiac MR imaging TFC (P < .001).
■ Probands with a diagnosis of ARVD/C were significantly more likely to show ventricular fibrofatty changes than were subjects given a diagnosis on the basis of family-member screening results (76% vs 39%, P = .001).
■ Fibrofatty changes were frequently seen in patients who only partially fulfilled TFC MR imaging criteria (71%).
■ A unique pattern of subepicardial fat infiltration was found in the lateral wall of the left ventricle in patients with ARVD/C.
SUPPLEMENTAL TABLES
Received May 13, 2015; revision requested July 3; revision received October 28; accepted November 3; final version accepted December 11.
Current address: Division of Cardiology, University Medical Center Utrecht, Utrecht, the Netherlands.
H.C. supported by the Dr Francis P. Chiaramonte Private Foundation, St Jude Medical, and Medtronic. There was no industry support specifically for this study. The Johns Hopkins ARVD/C Program is supported by the Leyla Erkan Family Fund for ARVD Research, the Dr Satish, Rupal, and Robin Shah ARVD Fund at Johns Hopkins, the Bogle Foundation, the Healing Hearts Foundation, the Campanella family, the Patrick J. Harrison Family, the Peter French Memorial Foundation, and the Wilmerding Endowments. D.A.B. is an employee of the National Institutes of Health Clinical Center.
Disclosures of Conflicts of Interest: N.R. disclosed no relevant relationships. A.S.J.M.T.R. disclosed no relevant relationships. C.A.J. Activities related to the present article: none to disclose. Activities not related to the present article: has received a grant from Boston Scientific. Other relationships: none to disclose. A.B. disclosed no relevant relationships. B.M. disclosed no relevant relationships. C.T. disclosed no relevant relationships. H.C. disclosed no relevant relationships. H.T. disclosed no relevant relationships. D.A.B. disclosed no relevant relationships. I.R.K. disclosed no relevant relationships. S.L.Z disclosed no relevant relationships.
Abbreviations:
- ARVD/C
- arrhythmogenic RV dysplasia/cardiomyopathy
- FSE
- fast spin echo
- LGE
- late gadolinium enhancement
- LV
- left ventricle
- LVEF
- LV ejection fraction
- LVEDVI
- LV end-diastolic volume index
- LVESVI
- LV end-systolic volume index
- RV
- right ventricle
- RVEF
- RV ejection fraction
- RVEDVI
- RV end-diastolic volume index
- RVESVI
- RV end-systolic volume index
- TFC
- Task Force Criteria
- WMA
- wall-motion abnormality
References
- 1.Dalal D, Nasir K, Bomma C, et al. Arrhythmogenic right ventricular dysplasia: a United States experience. Circulation 2005;112(25):3823–3832. [DOI] [PubMed] [Google Scholar]
- 2.Marcus FI, Fontaine GH, Guiraudon G, et al. Right ventricular dysplasia: a report of 24 adult cases. Circulation 1982;65(2):384–398. [DOI] [PubMed] [Google Scholar]
- 3.Thiene G, Nava A, Corrado D, Rossi L, Pennelli N. Right ventricular cardiomyopathy and sudden death in young people. N Engl J Med 1988;318(3):129–133. [DOI] [PubMed] [Google Scholar]
- 4.Marcus FI, McKenna WJ, Sherrill D, et al. Diagnosis of arrhythmogenic right ventricular cardiomyopathy/dysplasia: proposed modification of the Task Force Criteria. Eur Heart J 2010;31(7):806–814. [DOI] [PMC free article] [PubMed] [Google Scholar]
- 5.Sen-Chowdhry S, Prasad SK, Syrris P, et al. Cardiovascular magnetic resonance in arrhythmogenic right ventricular cardiomyopathy revisited: comparison with task force criteria and genotype. J Am Coll Cardiol 2006;48(10):2132–2140. [DOI] [PubMed] [Google Scholar]
- 6.Tandri H, Saranathan M, Rodriguez ER, et al. Noninvasive detection of myocardial fibrosis in arrhythmogenic right ventricular cardiomyopathy using delayed-enhancement magnetic resonance imaging. J Am Coll Cardiol 2005;45(1):98–103. [DOI] [PubMed] [Google Scholar]
- 7.te Riele AS, James CA, Rastegar N, et al. Yield of serial evaluation in at-risk family members of patients with ARVD/C. J Am Coll Cardiol 2014;64(3):293–301. [DOI] [PMC free article] [PubMed] [Google Scholar]
- 8.Rastegar N, Zimmerman SL, Te Riele AS, et al. Spectrum of biventricular involvement on CMR among carriers of ARVD/C-associated mutations. JACC Cardiovasc Imaging 2015;8(7):863–864. [DOI] [PubMed] [Google Scholar]
- 9.te Riele AS, Bhonsale A, James CA, et al. Incremental value of cardiac magnetic resonance imaging in arrhythmic risk stratification of arrhythmogenic right ventricular dysplasia/cardiomyopathy-associated desmosomal mutation carriers. J Am Coll Cardiol 2013;62(19):1761–1769. [DOI] [PMC free article] [PubMed] [Google Scholar]
- 10.Te Riele AS, James CA, Philips B, et al. Mutation-positive arrhythmogenic right ventricular dysplasia/cardiomyopathy: the triangle of dysplasia displaced. J Cardiovasc Electrophysiol 2013;24(12):1311–1320. [DOI] [PMC free article] [PubMed] [Google Scholar]
- 11.Tandri H, Calkins H, Nasir K, et al. Magnetic resonance imaging findings in patients meeting task force criteria for arrhythmogenic right ventricular dysplasia. J Cardiovasc Electrophysiol 2003;14(5):476–482. [DOI] [PubMed] [Google Scholar]
- 12.Du Bois D, Du Bois EF. A formula to estimate the approximate surface area if height and weight be known. 1916. Nutrition 1989;5(5):303–311; discussion 312–313. [PubMed] [Google Scholar]
- 13.Castillo E, Tandri H, Rodriguez ER, et al. Arrhythmogenic right ventricular dysplasia: ex vivo and in vivo fat detection with black-blood MR imaging. Radiology 2004;232(1):38–48. [DOI] [PubMed] [Google Scholar]
- 14.Aquaro GD, Nucifora G, Pederzoli L, et al. Fat in left ventricular myocardium assessed by steady-state free precession pulse sequences. Int J Cardiovasc Imaging 2012;28(4):813–821. [DOI] [PubMed] [Google Scholar]
- 15.Aquaro GD, Todiere G, Strata E, Barison A, Di Bella G, Lombardi M. Usefulness of India ink artifact in steady-state free precession pulse sequences for detection and quantification of intramyocardial fat. J Magn Reson Imaging 2014;40(1):126–132. [DOI] [PubMed] [Google Scholar]
- 16.Hudsmith LE, Petersen SE, Francis JM, Robson MD, Neubauer S. Normal human left and right ventricular and left atrial dimensions using steady state free precession magnetic resonance imaging. J Cardiovasc Magn Reson 2005;7(5):775–782. [DOI] [PubMed] [Google Scholar]
- 17.Tandri H, Castillo E, Ferrari VA, et al. Magnetic resonance imaging of arrhythmogenic right ventricular dysplasia: sensitivity, specificity, and observer variability of fat detection versus functional analysis of the right ventricle. J Am Coll Cardiol 2006;48(11):2277–2284. [DOI] [PubMed] [Google Scholar]
- 18.Pfluger HB, Phrommintikul A, Mariani JA, Cherayath JG, Taylor AJ. Utility of myocardial fibrosis and fatty infiltration detected by cardiac magnetic resonance imaging in the diagnosis of arrhythmogenic right ventricular dysplasia: a single centre experience. Heart Lung Circ 2008;17(6):478–483. [DOI] [PubMed] [Google Scholar]
- 19.Bluemke DA, Krupinski EA, Ovitt T, et al. MR Imaging of arrhythmogenic right ventricular cardiomyopathy: morphologic findings and interobserver reliability. Cardiology 2003;99(3):153–162. [DOI] [PubMed] [Google Scholar]
- 20.Menghetti L, Basso C, Nava A, Angelini A, Thiene G. Spin-echo nuclear magnetic resonance for tissue characterisation in arrhythmogenic right ventricular cardiomyopathy. Heart 1996;76(6):467–470. [DOI] [PMC free article] [PubMed] [Google Scholar]
- 21.Tandri H, Macedo R, Calkins H, et al. Role of magnetic resonance imaging in arrhythmogenic right ventricular dysplasia: insights from the North American arrhythmogenic right ventricular dysplasia (ARVD/C) study. Am Heart J 2008;155(1):147–153. [DOI] [PubMed] [Google Scholar]
- 22.Marra MP, Leoni L, Bauce B, et al. Imaging study of ventricular scar in arrhythmogenic right ventricular cardiomyopathy: comparison of 3D standard electroanatomical voltage mapping and contrast-enhanced cardiac magnetic resonance. Circ Arrhythm Electrophysiol 2012;5(1):91–100. [DOI] [PubMed] [Google Scholar]
- 23.Sen-Chowdhry S, Syrris P, Ward D, Asimaki A, Sevdalis E, McKenna WJ. Clinical and genetic characterization of families with arrhythmogenic right ventricular dysplasia/cardiomyopathy provides novel insights into patterns of disease expression. Circulation 2007;115(13):1710–1720. [DOI] [PubMed] [Google Scholar]
- 24.Bhonsale A, Groeneweg JA, James CA, et al. Impact of genotype on clinical course in arrhythmogenic right ventricular dysplasia/cardiomyopathy-associated mutation carriers. Eur Heart J 2015;36(14):847–855. [DOI] [PubMed] [Google Scholar]
- 25.Steckman DA, Schneider PM, Schuller JL, et al. Utility of cardiac magnetic resonance imaging to differentiate cardiac sarcoidosis from arrhythmogenic right ventricular cardiomyopathy. Am J Cardiol 2012;110(4):575–579. [DOI] [PubMed] [Google Scholar]
Associated Data
This section collects any data citations, data availability statements, or supplementary materials included in this article.