Abstract
The existing modalities of bone diagnosis including X-ray and ultrasound may cite drawback in some cases related to health issues and penetration depth, while the ultrasound modality may lack image quality. Photo acoustic approach however, provides light energy to the acoustic wave, enabling it to activate and respond according to the propagating media (which is type of bones in this case). At the same time, a differential temperature change may result in the bio heat response, resulting from the heat absorbed across the multiple materials under study. In this work, we have demonstrated the features of using photo acoustic modality in order to non-invasively diagnose the type of human bones based on their electrical, thermal, and acoustic properties that differentiate the output response of each type. COMSOL software was utilized to combine both acoustic equations and bio heat equations, in order to study both the thermal and acoustic responses through which the differential diagnosis can be obtained. In this study, we solved both the acoustic equation and bio heat equations for four types of bones, bone (cancellous), bone (cortical), bone marrow (red), and bone marrow (yellow). 1 MHz acoustic source frequency was chosen and 105 W/m2 power source was used in the simulation. The simulation tested the dynamic response of the wave over a distance of 5 cm from each side for the source. Near 2.4 cm was detected from simulation from each side of the source with a temperature change of within 0.5 K for various types of bones, citing a promising technique for a practical model to detect the type of bones via the differential temperature as well as the acoustic was response via the multiple materials associated with the human bones (skin and blood).
The simulation results suggest that the PA technique may be applied to non-invasive diagnosis for the different types of bones, including cancerous bones. A practical model for detecting both the temperature change via IR sensors, and acoustic wave signals may be detected via sensitive pressure transducer, which is reserved for future realization.
Keywords: Photo acoustic tomography- PAT, PA, Diagnosis, Ortho, COMSOL
1. Introduction
There are two categories for the PA techniques when utilizing light sources; broadband sources such as that in lamps using wavelengths from ultraviolet to infrared spectrum, and narrowband sources such as that of the laser sources. The first is generally inexpensive and compact in size, but have limited spectrum brightness, in addition to its requirement to use monochromators and filters. Furthermore, this has an issue with low source modulated frequencies, resulting in low optical efficiencies. Lasers on the other hand feature large spectrum brightness and is easy to modulate. Pulsed excitation light source will enable laser tunability. Applying higher modulation frequencies will enhance acoustic amplifications, resulting in improved signal to noise ratio (SNR). When the acoustic resonance frequency equal the modulation frequency the acoustic mode of the cells can be excited, resulting in high amplification of the acoustic signals. Pressure sensors may detect the acoustic waves generated from the PA cell as a result of the absorption of radiation by a sample. PA sensor could be a microphone with a lock in amplifier that is capable of detecting a small voltage generated by the microphone. Recently, capacitive microphone with a cantilever type pressure sensor made out of silicon has achieved high efficiency. Laser operating at 0.6 mm to generate acoustic wave pulses at the skin was reported. Piezoelectric material was used to detect acoustic wave rising from thermoelastic expansion. The concept of conservation of energy from thermal energy to acoustic energy is the basic concept of this approach. The drop in thermal energy as the heat travel via the multiple layers leads to the generation of acoustic waves. The photo acoustic imaging to better visualize and differentiate various orthopedic pathologies, including, but not limited to: microscopic fractures, degeneration, and neoplastic activity, was studied using computer simulation modeling. The COMSOL multi-physics software was utilized to simulate acoustic wave propagation through various anatomical layers within human bone. The simulation is based on combining Helmholtz equation in 2D, and the Penne's bio heat transfer equation. More specifically, the simulation for healthy density of bone was presented elsewhere.1 In that work the control parameters for the photoacoustic wave was elaborated on. This work continues to include a comparative study for distinguish various type of bones for possible future diagnosis.
The research community is pursuing characterization by degenerative changes in the bones, cartilage, menisci, ligaments, and synovial tissue. In addition, osteoarthritis (OA) has evolved to be considered a disease of the whole joint. PA imaging may serve in the diagnosis and management through early identification of OA, which is crucial to improving clinical decision-making and advancing the understanding of disease progression and treatment options. This may save placement of the endoscope on the cartilage at the time of arthroscopy.
This PA approach provides a unique feature in terms of its safety and penetration depth as compared to other modalities such as radiographic imaging.3, 4, 5, 6, 7, 8, 9 The image quality in this approach is also advantageous compared to non-radiative ultrasound imaging, advantageous over radiographic imaging, which exposes patients to radiation that is harmful over time.
The computer simulation indicates near 2.4 cm penetration depth within the human bones from each side of the acoustic source when 1 MHz source was used. A temperature of 0.2 K was determined from the simulations for healthy patients, while this change likely varies for other bone densities, indicating feasibility of detecting the type of human bones exposed to this acoustic imaging modality.
2. Methods
In this study we used computer simulation utilizing COMSOL software. The acoustic and bio-heat equations were solved over given boundaries. Investigation with various frequencies was performed for the purpose of reaching a practical penetration depth within the centimeter range.
Since the work performed in this study was mainly simulation and no patient's data were taken, there was no need to obtain the IRB certificate for the study of this project. For future practical models the IRB will be necessary when applied to human subjects. This work is reserved for the second phase of the project.
3. Mathematical model
The Bioheat equation used by COMSOL is given by:
| (1) |
where P is the acoustic pressure, c is the speed of sound, is the material density, and q is the progressing source via the various layers of the materials. The acoustic wave equation used by COMSOL is given by:
| (2) |
where c is the speed of sound, and m is the mass density, r is the location in space, Qm is the starting acoustic source, and is the radian frequency. The sound hard boundary equation, matching normal components, where n is the unit vector normal to the surface as given by:
| (3) |
where n is the unit vector normal to the surface. The progressing source via the various layers of materials, q is given by:
| (4) |
The transient bioheat equation, describing the heat transfer within the tissues is given by:
| (5) |
where is the bio heat source, is the bio thermal temperature, is metabolism heat source, and is the mass density of the material under bio thermal effect. The characteristic length for the thermal interaction between two media may be characterized by δ given as:
| (6) |
where κ is the thermal conductivity, Vm is the molar volume, and C is the molar heat capacity, given at constant pressure. In the simulation, the heat source 1 is given a constant number of Q0 centered at 2.46 cm, at a starting temperature, T0 (was given 293.6 K) with a tissue of 2.46 cm.
4. Results and discussions
The basis of the investigation is related to the different acoustic, thermal, mechanical, and EM properties within the different types of bone materials. Table 2 given in Appendix provides the properties of the bone materials as presented to the COMSOL software.
The results obtained in this work are categorized into two sections: the acoustic pressure and the temperature distribution. The first is resulting from the thermal energy conversion throughout the various layers of the multiple materials. The acoustic pressure is a good indicative parameter for the practical model where the piezoelectric transducer may recover the electrical signal reflecting the status of the bone materials. The temperature drop across the various boundaries, may be detected via IR sensors as a temperature scanner across the human bone interface. The PA approach provides spatial and dynamic performance of the bone materials.
4.1. Sound pressure level
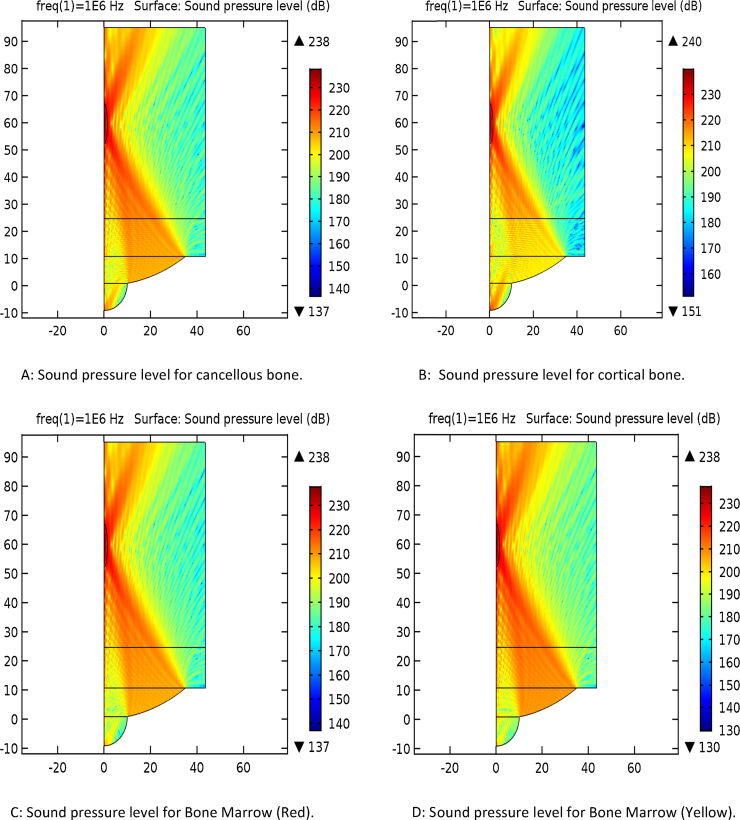
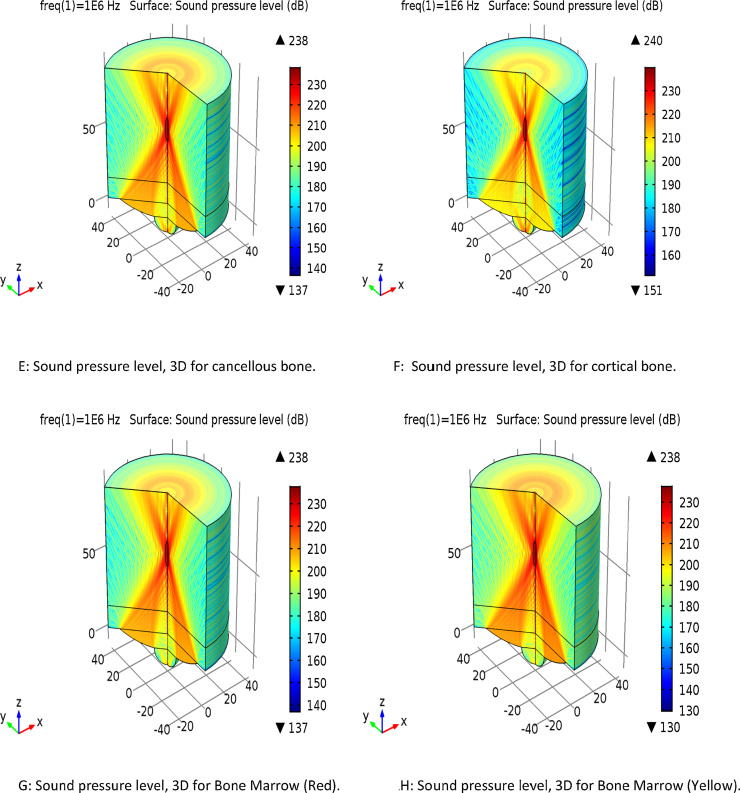
The frequency used in the simulation was based on the desired penetration depth through the various layers. 1 MHz was chosen for the simulation. Fig. 1A–H provides the simulation results for the four types of bones in the planar and 3D forms. It is notable variation between 210 dB and 235 dB levels. The penetration also varies from the source of acoustic waves, around 20 mm distance seen at the top portion of the source.
Fig. 1.
Simulation of the sound pressure in 2D and 3D planes. (A) Sound pressure level for cancellous bone. (B) Sound pressure level for cortical bone. (C) Sound pressure level for bone marrow (red). (D) Sound pressure level for bone marrow (yellow). (E) Sound pressure level, 3D for cancellous bone. (F) Sound pressure level, 3D for cortical bone. (G) Sound pressure level, 3D for bone marrow (red). (H) Sound pressure level, 3D for bone marrow (yellow).
4.2. Isothermal contours and temperature distributions
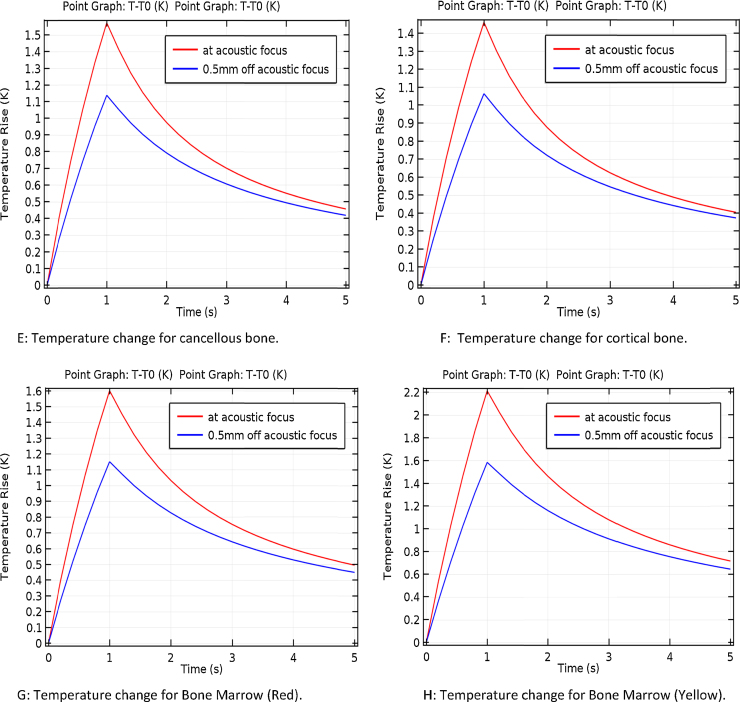
The thermos-acoustic contours are presented in Fig. 2A–H for the four types of bones recorded after 5 s of the running the acoustic source. A small fraction of temperature was recorded for the various types of bones. Near 0.2 K temperature change range around the source was observed within the simulation. The simulation was conducted to track temperature change 0.5 mm far from the source and within 5 s. Fig. 2E–H shows that as much as 0.2 K within 5 s simulation and 0.5 mm off the acoustic focus was recorded, a differential change that can be detected via IR sensor scanner.2 The results were discussed in Table 1.
Fig. 2.
Isothermal contours and temperature distributions. (A) Isothermal contours for cancellous bone. (B) Isothermal contours for cortical bone. (C) Isothermal contours for bone marrow (red). (D) Isothermal contours for bone marrow (yellow). (E) Temperature change for cancellous bone. (F) Temperature change for cortical bone. (G) Temperature change for bone marrow (red). (H) Temperature change for bone marrow (yellow).
Table 1.
Temperature change within the various types of bones.
| Type of bone | Temperature change at focus point (K) | Temperature change within 0.5 mm (K) |
|---|---|---|
| Cancellous | 1.6 | 1.14 |
| Cortical | 1.5 | 1.05 |
| Bone marrow (red) | 1.6 | 1.15 |
| Bone marrow (yellow) | 2.2 | 1.6 |
4.3. Pressure amplitude along radial axis on the focal plane
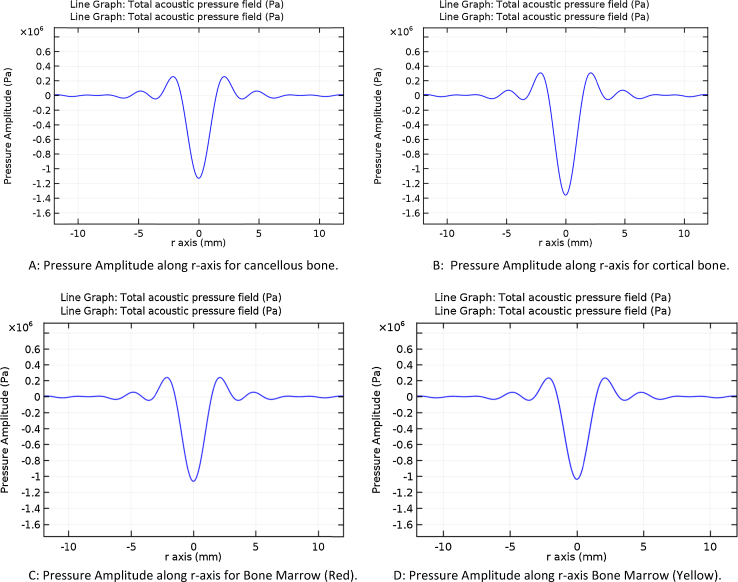
Fig. 3A–D provides the acoustic amplitude at the source of focus. The reflection and transmission properties of the materials reflect the type of bones via the change in acoustic amplitude. A range of 1–1.4 Pa was observed from the simulation.
Fig. 3.
Pressure amplitude distribution along radial axis. (A) Pressure amplitude along r-axis for cancellous bone. (B) Pressure amplitude along r-axis for cortical bone. (C) Pressure amplitude along r-axis for bone marrow (red). (D):Pressure amplitude along r-axis bone marrow (yellow).
5. Conclusion and future work
The Photo acoustic approach is a technique that is based on applying electromagnetic energy in the form of light and monitoring the resultant acoustic and thermal waves. In this work, various types of bone served as the medium for this simulation. After absorbing the initial signal, each type of bone emitted a photo-acoustic signal based of its individual absorptive properties. Furthermore, it was found that the amplitude of photo acoustic signals was temperature dependent, with varying temperature changes at both the focal and 0.5 mm distance point.
The simulation data presented here suggests promising technique for diagnosing different types of bones based on their acoustic and thermal characteristics. By capitalizing on the material properties of bones a practical model of this approach proves to be a promising future project. The second phase of this project is to provide an acoustic model to monitor the change in temperature via IR sensors, and to detect the acoustic wave via piezoelectric transducers with signal processing unit for differentiating the different types of human bones.
Conflicts of interest
The authors have none to declare.
Acknowledgment
The authors would like to offer their appreciation to the INDI group at IUPUI for their continuous support throughout the work of this project.
Appendix. Material properties
Table 2.
Material properties used in the simulation of the various types of human bones.
| Tissue | Permittivity | Elec. cond. (S/m) | Density (kg/m3) | Heat capacity (J/kg/°C) | Therm. cond. (W/m/°C) | Heat transfer rate (ml/min/kg) | Heat generation rate (W/kg) |
|---|---|---|---|---|---|---|---|
| Bone (cancellous) | 2.49E+2 | 9.04E−2 | 1178 | 2274 | 0.31 | 30 | 0.46 |
| Bone (cortical) | 1.45E+2 | 2.44E−2 | 1908 | 1313 | 0.32 | 10 | 0.15 |
| Bone marrow (red) | 9.91E+1 | 1.04E−1 | 1029 | 2666 | 0.28 | 135 | 2.09 |
| Bone marrow (yellow) | 3.98E+1 | 4.71E−3 | 980 | 2065 | 0.19 | 30 | 0.46 |
References
- 1.Thella A.K., Rizkalla J., Helmy A., Suryadevara V.K., Salama P., Rizkalla M. Department of Electrical and Computer Engineering, IUPUI; 2016, June. Photo Acoustic Thermal for Human Bone Characterization. A feasibility Study. Technical Report. [Google Scholar]
- 2.Rizkalla J., Tilbury W., Helmy A., Suryadevara V., Rizkalla M., Holdmann M. Computer simulation/practical models for human thyroid thermographic imaging. J Biomed Sci Eng. 2015;8:246–256. [Google Scholar]
- 3.Ke H., Tai S., Wang L.V. Photoacoustic thermography of tissue. J Biomed Opt. 2014;19(2):026003. doi: 10.1117/1.JBO.19.2.026003. [DOI] [PMC free article] [PubMed] [Google Scholar]
- 4.Capmany J., Li G., Lim C., Yao J. Microwave photonics: current challenges towards widespread application. Opt Express. 2013;21(19):22862–22867. doi: 10.1364/OE.21.022862. [DOI] [PubMed] [Google Scholar]
- 5.El Sayed M.J., Zaghrini E. Prehospital emergency ultrasound: a review of current clinical applications, challenges, and future implications. Emerg Med Int. 2013;2013 doi: 10.1155/2013/531674. [DOI] [PMC free article] [PubMed] [Google Scholar]
- 6.Xia J., Yao J., Wang L.V. Photoacoustic tomography: principles and advances. Electromagn Waves. 2014;147:1. doi: 10.2528/pier14032303. [DOI] [PMC free article] [PubMed] [Google Scholar]
- 7.Wan Y., Liu D., Ebbini E.S. Biomedical Imaging: From Nano to Macro, 2010 IEEE International Symposium on IEEE. 2010. Imaging vascular mechanics using ultrasound: phantom and in vivo results. [Google Scholar]
- 8.Suryadevara V.K., Patil S., Rizkalla J., Helmy A., Salama P., Rizkalla M. Microwave/thermal analyses for human bone characterization. J Biomed Sci Eng. 2016;9(02):101. [Google Scholar]
- 9.Chen Z., Basarab A., Kouamé D. Compressive deconvolution in medical ultrasound imaging. IEEE Trans Med Imaging. 2016;35(3):728–737. doi: 10.1109/TMI.2015.2493241. [DOI] [PubMed] [Google Scholar]


