

Abstract
Apolipoprotein E4 (apoE4), one of three isoforms of apoE, is the major risk factor for developing late onset Alzheimer’s disease. The only differences between these isoforms (apoE2, apoE3 and apoE4) are single amino acid changes. Yet these proteins are functionally very different. One approach to ameliorating the effect of apoE4 with respect to Alzheimer’s disease would be to find small molecular weight compounds that affect the behavior of apoE4. Few studies of this approach have been carried out in part because there was no complete structure of any full-length apoE isoform until 2011. Here we focus on one small molecular weight compound, EZ-482, and explore the effects of its binding to apoE. Using hydrogen-deuterium exchange, we determined that EZ-482 binds to the C-terminal domains of both apoE3 and apoE4. The binding to apoE4, however, is accompanied by a unique N-terminal allosteric effect. Using fluorescence methods, we determined an apparent dissociation constant of approximately 8 μM. Although EZ-482 binds to the C-terminal domain, it blocks heparin binding to the N-terminal domain. The residues of apoE that bind heparin are the same as those involved in apoE binding to LDL and LRP-1 receptors. The methods and the data presented here may serve as a template for future studies using small molecular weight compounds to modulate the behavior of apoE.
The family of apoE lipoproteins in humans consists of three major isoforms called apoE2, apoE3 and apoE4 with differences between isoforms being single amino acid changes (arginine/cysteine) within the 299 amino acid protein. In apoE3, the arginine at position 112 in apoE4 is changed to cysteine while in apoE2 arginines at positions 112 and 158 are both changed to cysteine (1), these changes being in the N-terminal domain of the protein. An NMR structure of a full length monomeric mutant of apoE3 shows extensive interaction between the N- and C- terminal domains (2). Although there is only a single amino acid change between apoE4 and apoE3, the function of these two isoforms is quite different. The functional difference may result from conformational differences in the C-terminal domain as a result of the cysteine to arginine difference in the N-terminal domain (3, 4).
ApoE proteins play a key role in the lipid metabolism of the cardiovascular and central nervous systems (5, 6). Importantly, it has been known since 1993 (7, 8) that apoE4 is a risk factor for the development of late onset Alzheimer’s disease. Indeed, it is now clear that apoE4 is the major risk for this disease (9, 10) while apoE3 appears to have little or no effect of the development of Alzheimer’s disease. Compared to individuals with no ε4 alleles, the increased risk for Alzheimer’s disease is 2–3 fold in people with one ε4 allele and approximately 12-fold in those with two ε4 alleles.
While the underlying reasons for this difference remain unclear, one approach to affecting the development of late onset Alzheimer’s disease would be to modulate the properties of apoE4 relative to apoE3. This approach was suggested as early as 2006 by Mahley et al. (11), and there have been some, but relatively few, studies using this idea (12, 13) as recently discussed by Michaelson (14). One problem, however, was that before 2011 there was no complete structure of any apoE isoform. Thus, early discussions of modulating apoE4 behavior were based on the known structure of the N-terminal domain and proposed interactions between the N- and C-terminal domains (5). In that model, it was suggested that there were interactions between the N-and C-terminal domains for apoE4 but not for apoE3 (5).
In 2011, Chen et al. determined the NMR structure of a full length monomeric mutant of apoE3 obtained by making five amino acid substitutions in the C-terminal domain (2). As shown by Chen et al. and as discussed by Frieden and Garai (3, 4), this structure shows strong interactions between the N- and C-terminal domains of apoE3 in contrast to the previously proposed model (5). Based on hydrogen-deuterium exchange studies carried out by Huang et al. (15), Frieden and Garai suggested that structural differences between apoE3 and apoE4 occurred in the C-terminal domain (3) and that these differences could be the basis for exploring small molecular weight compounds that could bind to apoE and modulate its behavior. In this paper, we describe one such small molecule and procedures for finding other molecules that may affect such behavior. We find that the compound used here binds to regions in the C-terminal domain of non-lipidated apoE with μM affinity and blocks heparin binding even though the heparin binding site is located in the N-terminal domain. Because the heparin binding site on apoE is also the site for receptor binding, this compound could also interfere with binding of apoE to the cell surface.
Experimental Procedures
Protein Expression and preparation
Apolipoprotein E (apoE) was expressed as a thioredoxin fusion protein in Escherichia coli (strain BL21, DE3 competent cells, Stratagene), which was grown in LB media to OD600 = 0.6. An N-terminal 6X-Histag was used for purification of the fusion protein and a PreScission peptide, which is cleaved with PreScission protease, was placed between the two proteins. This process removes the 6X-Histag and thioredoxin but leaves two amino acids (Gly-Pro) on the N-terminal end of apoE. The procedure avoids the earlier preparation that involved adding lipid prior to a thrombin cleavage (16). Mutations were introduced into the c-DNA of apoE using the QuikChange site-directed mutagenesis kit (Agilent) and all sequences were verified using DNA sequencing.
Stock solutions of apoE were dialyzed overnight at 4 °C either in 1X PBS (10 mM PO43−, 137 mM NaCl, and 2.7 mM KCl. pH 7.4) or 20 mM HEPES, 150 mM NaCl, pH 7.4, by using Slide–A-Lyzer dialysis cassettes (10,000 molecular weight cutoff). For apoE3, 0.1% β-mercaptoethanol was added. The buffer was exchanged for fresh buffer and again dialyzed in overnight at 4 °C. The concentration of the final protein solution was established by absorbance measurement at 280 nm (ε = 44950 cm−1 M−1). The protein was flash frozen in liquid nitrogen and stored at −80 °C.
Materials
Rhodamine labeled heparin was obtained from Creative PEGWorks (North Carolina) and stored at −20 °C. The average molecular weight of this heparin is 18000 Da with 95% purity. According to the supplier, there was at least one dye per heparin polymer. A specific amount of rhodamine-labeled heparin was dissolved 20 mM HEPES buffer with 150 mM NaCl, pH 7.4, divided into small aliquots and stored at 4 °C before use. At high concentrations, rhodamine labeled heparin appears to form higher molecular weight species, resulting in fluorescence quenching. Diluting the heparin resulted in dissociation and an increase in fluorescence. Therefore, before adding protein (or compound), it was necessary to wait for approximately 10,000 s to allow the fluorescence to stabilize prior to data collection.
The compound used in these experiments, (C23H19ClN4O5S), N-{5-[(3-chlorophenyl)sulfamoyl]-2-hydroxyphenyl}-2-(3-methyl-4-oxo-3,4-dihydrophthalazin-1-yl)acetamide (molecular weight 498.94) was obtained from Enamine LLC. The compound number was MolPort-004-651-765. The structure is shown in Figure 1. In this paper, the name of the compound was shortened to EZ-482 for ease of use.
Figure 1.
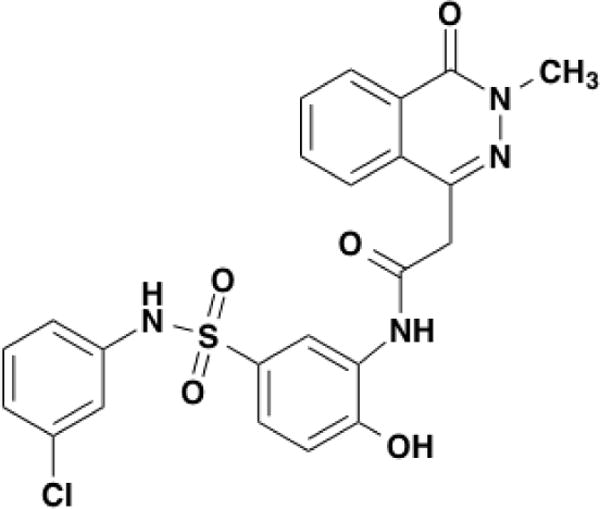
The structure of EZ-482
SYPRO Orange, pyrene maleimide, egg yolk phosphatidy choline, and ANS were obtained from Sigma-Aldrich (St. Louis, MO). No structure is available for SYPRO Orange. Tetramethyl-rhodamine maleimide and Alexa Fluor-488 maleimide were obtained from Invitrogen (Carlsbad, CA). Chicken egg phosphatidyl choline (Egg PC) and other lipids were obtained from Avanti Polar Lipids (Alabaster, AL). Egg PC was used to make small unilamellar vesicles (SUVs). Briefly, Egg PC in chloroform was dried as a film under nitrogen gas on the wall of a glass tube and lyophilized to remove chloroform. The lipid film was hydrated in PBS buffer and extruded through 0.05 μM filter. The final concentration of Egg PC SUVs in the pyrene fluorescence experiments was 0.4 mg/ml All other materials used were reagent grade.
Hydrogen Deuterium Exchange and Mass Spectroscopy (HDX MS) Protocol
ApoE stock solutions containing EZ-482 were prepared by incubating a 10 μM apoE stock solution in phosphate buffer saline, pH 7.4 (PBS). For apoE3, the solution contained 2 mM dithiothreitol (DTT). When EZ-482 (in DMSO) was used, the stock was diluted 1:25 at 25 °C and incubated with the protein for 2 h before HDX analysis. Compound-free apoE was prepared the same way but contained DMSO (2%) equivalent to that in solution containing the EZ-482. Continuous HDX was initiated by diluting 4 μL apoE stock solution 1:9 into D2O buffer (PBS, pD 7.4) at 25 °C for various incubation times (30 s, 1 min, 2 min, 3.5 min, 5 min, 10 min, 30 min). A sequential digestion with fungal XIII and pepsin was used to achieve 98.7% sequence coverage. The HDX was quenched by mixing with 60 μL of 1 mg/mL fungal XIII, 3 M urea, and 1% formic acid for 2 min on ice, and then injected into a self-packed immobilized pepsin column (2 mm × 2 cm). The resulting digested peptides were trapped and desalted on a C8 trap column (2.1 mm × 1.5 cm, Agilent, Santa Clara, CA) for 4 min at 300 μL/min in 0.1% trifluoroacetic acid via an Agilent 1100 HPLC (Santa Clara, CA). The peptides were then eluted from the trap column and separated on a C18 analytical column (2.1 mm × 5 cm, 3 μm Hypersil Gold, Thermo Fisher, Waltham, MA) with a linear gradient (4−40% CH3CN, 0.1% (v/v) formic acid) at 180 μL/min delivered by a LEAP 3x Ti pump (Carrboro, NC) for 11 min. All steps were performed in a water-ice (~0 °C) bath to minimize back exchange. Each HDX experiment point was done in duplicate. HDX data were collected on a maXis quadrupole time of flight (Bruker, Bremen, Germany) mass spectrometer in the positive-ion electrospray ionization mode with the following instrument settings: capillary voltage, 3.8 kV; nebulizer gas, 1.6 bar; drying gas flow rate, 8 L/min and temperature, 200 °C. For establishing a back-exchange correction, the apoE stock solutions were incubated in D2O buffer at 25 °C for 48 h.
HDX Data Analysis
Preliminary to HDX, peptides from pepsin or fungal XIII digestion were identified in a data-dependent mode with a Thermo LTQ 7 T FT-mass spectrometer (San Jose, CA). The top six most abundant ions were submitted to collision-induced dissociation (CID) fragmentation. Product-ion spectra were then submitted to MassMatrix (version 2.4.2) (17) for identification, and manually inspected. Only verifiable peptides were used for HDX analysis. Data analysis of continuous HDX was carried out with HDExaminer (version 2.0, Sierra Analytics, Inc., Modesto, CA).
Analytical Ultracentrifugation
A Beckman Optima model XL-A analytical ultracentrifuge (Brea, CA) was used for sedimentation velocity experiments. Samples were loaded into a conventional double-sector filled epon centerpiece (path length 1.2 cm). Data were collected in continuous mode at 290 nm. Experiment were performed in PBS buffer using 10 μM apoE4 and EZ-482 concentrations of 0, 10 and 20 μM. Data were analyzed using Sedfit (18).
Fluorescence Labeling of ApoE4
For fluorescence studies single cysteine mutants, A102C, S139C and A285C, of apoE4 were prepared. The cysteine mutants were labeled by thiol- reactive chemistry using either Alexa488 maleimide, TMR maleimide or pyrene maleimide. The labeling reactions were performed in 1X PBS buffer. Reduction of disulfide bonds was carried out by adding 20 mM DTT and incubating the protein for 1–2 h at 37 °C. Excess DTT was removed with a PD-10 column and a 10-fold molar excess of maleimide dye was added slowly with continuously shaking to the reaction mixture. The reaction mixture was then kept at 4 °C overnight. Excess dye was removed by passing the reaction mixture over a PD-10 column and the labeled apoE was then dialyzed against 1X PBS buffer. The absorbance at 280 nm and 490 nm (for Alexa488), 550 nm (for TMR) and 342 nm (for pyrene) were used to determine the concentration and the extent labeling for all the samples. For all samples the extent of labeling was generally over 90%. ApoE3 (A285C) was labeled with Alexa488 but extent of labeling at position 112 was unclear. All titration experiments were performed by incubating the protein for 1 h at room temperature prior to stepwise addition of EZ-482.
Pyrene-labeled apoE4 was used to measure binding to Egg PC SUVs in the presence of EZ-482. The time course of apoE4 pyrene emission was followed at 385 nm with excitation at 342 nm. Pyrene-labeled apoE4 (0.3 μM) was incubated in a stirred cuvette with or without varying concentrations of EZ-482 in PBS buffer for 3 minutes before data collection. Data collection was started and one minute later Egg PC SUVs were added to a final concentration of 0.4 mg/ml.
Results
Determination of dissociation constants for compound binding to apoE
A typical method for determining the dissociation constant to a protein utilizes the change in tryptophan fluorescence as a function of ligand concentration. This method proved unusable for at least two reasons: the ligands themselves absorb strongly at the absorption maximum of tryptophan and any fluorescence change at a single tryptophan due to compound binding is masked by the presence of six other tryptophan residues present in apoE. Isothermal titration calorimetry was not suitable becasue the solvent for many compounds is DMSO that greatly affects the calorimetric data. Therefore, we turned to other methods to test some 80 compounds.
We chose EZ-482 to examine in detail since it was reasonably soluble in DMSO and initial studies indicated a low μM dissociation constant. Four different methods were used to measure the apparent dissociation constant of EZ-482 to apoE. In the first, the fluorescence of apoE4 labeled with Alexa488 was used. The method is best suited to apoE4 since there the wild-type does not contain cysteine. The apparent dissociation constant was determined by following the decrease in Alexa488 fluorescence of a cysteine mutant (S139C) as a function of EZ-482 concentration. We did, however, label a cysteine mutant of apoE3 (A285C) with TMR. In this case, there are two cysteine residues since apoE3 has a cysteine at position 112. The ratio of dye to protein was determined to be 1:1. Even though the extent of labeling of the two cysteines was unclear, titration of this protein with EZ-482 gave the same dissociation constant for apoE3 as that determined for apoE4 under these conditions (Table 1).
Table 1.
Apparent dissociation Constant of EZ-482 using different methodsa
| Method and buffer used | Kd (μM) |
|---|---|
|
| |
| Fluorescence of Alexa488 apoE4 | |
| At position 139 PBS | 9.3± 1.1 |
| At position 139 HEPES | 8.5 ± 1.1 |
| Fluorescence of TMR label apoE3 at position 285 HEPESb | 7 ± 0.35 |
|
| |
| Using SYPRO Orange | |
| apoE3 PBS | 7.3 ± 0.53 |
| apoE3 HEPES | 8.8 ± 0.4 |
| apoE4 PBS | 7.6 ± 0.4 |
| apoE4 HEPES | 8.9 ± 0.5 |
|
| |
| Using ANS | |
| apoE3 PBS | 5.6 ± 0.7 |
| apoE3 HEPES | 7.8 ± 1.1 |
| apoE4 PBS | 7.5 ± 1.0 |
| apoE3 HEPES | 7.1 ± 1.3 |
|
| |
| Competitionc ApoE4 PBS | 7.5 |
All experiments performed in the presence of 150 mM NaCl, with 1 mM DTT and 1 mM EDTA at 25 °C. PBS is 10 mM phosphate at pH 7.4. HEPES is 20 mM, pH 7.4.
Some labeling may have occurred at position 112
See text for details
A second approach uses the fluorescent protein dye SYPRO Orange. As shown below (next section), this dye binds to the same region of apoE3 as does EZ-482, and thus an apparent dissociation constant can be obtained by displacing SYPRO Orange with EZ-482. SYPRO Orange has an emission maximum of 608 nm. On addition of apoE to SYPRO Orange, there is an increase in fluorescence and a shift of the emission maximum to 575 nm. Subsequent titration with EZ-482 decreases the SYPRO Orange fluorescence to that of apoE alone. Figure S1 shows a titration of SYPRO Orange-apoE3 with EZ-482, and Table 1 lists the apparent dissociation constants for both apoE4 and apoE3. Both apoE3 and apoE4 gave similar dissociation constants.
A third approach uses wild-type protein to titrate Alexa488 labeled apoE4 in the presence of EZ-482 as a function of wild-type apoE. In these experiments, the EZ-482 was added to fluorescently labeled apoE, and subsequent fluorescence decrease was followed as above. The subsequent addition of unlabeled apoE3 removes EZ-482 from the Alexa488 protein with fluorescence returning to that in the absence of compound. Since the wild type protein is not labeled, this experiment distinguishes binding of the ligand to the protein from binding to, for example, the fluorescent label.
A final approach was to use ANS. It has been shown that ANS fluorescence is increased on addition of apoE (19). Addition of EZ-482 quenches the increased ANS fluorescence.
Table 1 gives the dissociation constants for both apoE3 and apoE4 using all these methods. Overall, the results from all four methods are essentially the same, yielding an dissociation constant of approximately 8 μM under the conditions used.
Hydrogen-Deuterium Exchange (HDX). Location of EZ-482 and SYPRO Orange binding sites
To determine the sites of EZ-482 binding to apoE, we used differential HDX methodology. Experiments were performed using 1 μM WT apoE in the presence and absence of 25 μM EZ-482. This EZ-482 concentration is 3 times the apparent dissociation constant (Table 1). The HDX experimental temperature (25 °C) and the on-exchange time points were chosen for optimum display of HDX differences induced upon ligand binding. To get nearly complete coverage (99%) of the protein, we performed a sequential fungal XIII then pepsin digestion because the coverage with pepsin alone, reported in our previous work, was less than 80% (15).
HDX kinetic curves for several apoE3 and apoE4 peptides show decreases in HDX as a result of EZ-482 binding. These are shown in Figure 2a(apoE3) and 2b(apoE4), respectively. Large protection was observed only in the C-terminal domain (229–235/234–243 and 258–265) for both isoforms, an indication of binding at these sites. The fact that both isoforms show visually similar kinetic curves in these regions indicates that EZ-482 binds to apoE3 and apoE4 in a comparable manner, consistent with results from other biophysics methods discussed above. When examined carefully, peptides 229–235/234–243 show different HDX kinetics compared to that for other regions. The differences between apoE bound to EZ-482 for peptides 229–235/234–243 are relatively small at early time points and increase over the time course before decreasing. For peptide 258–265, however, the maximum HDX differences are at the shortest time and disappear gradually. Additionally, larger maximum HDX differences are observed for regions represented by peptides 229–235/234–243 than for peptide 258–265. These observations indicate that 229–235/234–243 and 258–265 are EZ-482 binding sites. One peptide in the N-terminal domain (44–51) and an additional one in the C-terminal domain (206–217) show some differences between apoE4 and apoE3 in the presence of EZ-482. The differences between bound and unbound apoE4 are relatively small and diminish faster than those of peptides 229–235/234–243 and 258–265. We suggest that the differences observed in peptides 44–51 and 206–217 reflect N-terminal conformational changes of apoE4 upon EZ-482 binding, as discussed later. One of the drawbacks of HDX, or of any footprinting approach, is that conformational changes caused by direct interaction are difficult to distinguish those caused by allosteric effects.
Figure 2.
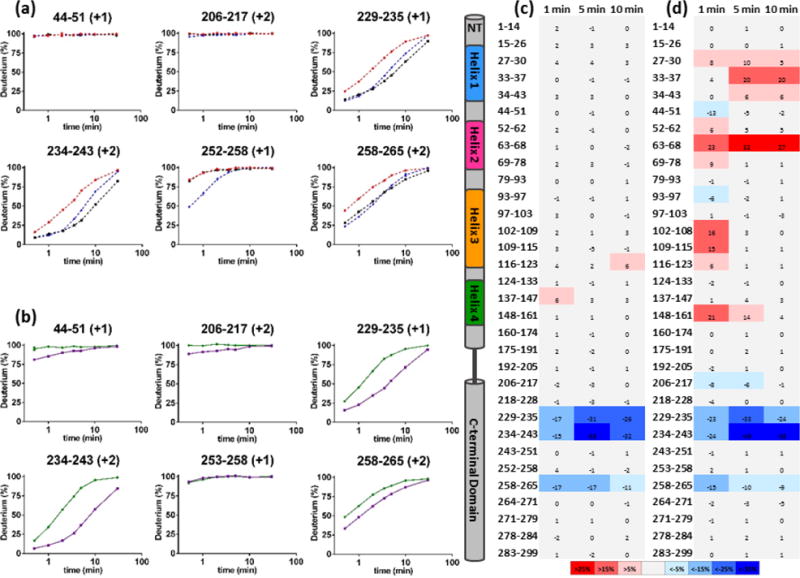
HDX kinetic curves of peptides that showed protection upon ligand binding: (a) 1 μM apoE3 (red), 25 μM EZ-482 (black) and 1X SYPRO Orange (blue), (b) 1 μM apoE4 (green), 25 μM EZ-482 (purple). The data for apoE4 do not include the use of SYPRO Orange. Differential deuterium uptake over the full sequence between (c) apoE3 in the presence of EZ-482 compared to apoE3 alone and (d) apoE4 in the presence of EZ-482 compared to apoE4 alone at three selected time points. Secondary structure elements and peptide residues numbers are labeled on the left. The color scale of heat map is shown at the bottom. All differential deuterium uptake numbers are in the unit of percentage. An allosteric effect in the N-terminal domain is observed in apoE4, but not in apoE3.
Noticeably, in the C-terminal domain, there is a long helix from 236–266 in the apoE3 NMR structure of a monomeric mutant (2). Rapid HDX at the earliest time point of peptides 243–251 (>70%) and 252–258 (>80%) of the WT, however, contrasts with the slower HDX that occurs at neighboring regions represented by peptides 234–243 (<30%) and 258–265 (<50%). Unlike in the mutant monomeric apoE3 structure, there may not be a single long α-helix spanning residues 236–266 in the wild-type structure. Rather, residues 243–258 in wild-type apoE3 are in a relatively flexible region, providing an opportunity for EZ-482 to interact with both sites 229–243 and 258–265.
We also applied the same HDX method to apoE3 in the absence and presence of 1X SYPRO Orange dye to verify that its binding sites are similar to those of EZ-482. With respect to SYPRO Orange the concentration of 1X SYPRO Orange was not supplied by the company and is therefore unknown. SYPRO Orange binds to the same region of apoE3 as EZ-482; the only difference is an additional peptide 252–258 shows protection at shorter time points (Figure 2(a)). Similar dissociation constants using or not using SYPRO Orange may reflect the possibility that SYPRO Orange binds only weakly to apoE.
Although we did not detect significant differences between the isoforms in terms of binding sites, we did observe a significant conformational change of apoE4 N-terminal four-helix-bundle domain upon EZ-482 binding whereas apoE3 N-terminal remained unaffected. Figure 2(c) and (d) shows results of differential deuterium uptake over the whole length of apoE3 and apoE4. These heat map data are shown as percentage differences in deuterium uptake between ligand bound and unbound protein as a function of time. Interestingly, some regions of apoE4 N-terminus show more HDX upon EZ-482 binding. They are located near the centers of four helices: 27–37 in Helix 1, 63–68 in Helix 2, 102–115 in Helix 3 and 148–161 in Helix 4. This observation suggests to us that the N-terminal structure of apoE4 is interrupted by the EZ-482 binding to the C-terminal domain. In contrast, apoE3 showed no such allosteric effect. The unique allosteric effect for apoE4 could serve as a guide for future studies to modify its properties.
Figure S2 shows HDX results for the C-terminal domain of apoE3 in the absence and presence of EZ-482 and Sypro Orange and apoE4 in the absence and presence of EZ-482.
Analytical Centrifugation
To examine whether EZ-482 affected the oligomerization properties of apoE, we performed analytical ultracentrifugation sedimentation velocity experiments using 10 μM apoE4 in the absence and presence of 10 or 20 μM EZ-482. The distribution of apoE oligomers was essentially unaffected by the presence of the EZ-482. The data are shown in Figure S3.
The effect of EZ-482 on heparin binding: Using fluorescently labeled heparin
The interaction of apoE with heparin has been known for many years (20, 21). While it had been suggested that the N- and C- terminal domains each bind heparin (22), Saito et al. had shown that the C-terminal site is unavailable for heparin binding and that the N-terminal domain binding is dominant (23). In this domain, residues 140–145 are involved in heparin binding (23). Dong et al. characterized the binding of an octasaccharide to apoE4 in this same region (24). More recently, Futamura et al., (25) using SPR, characterized binding as a two step process: apoE initially binds to heparin with fast association and dissociation rates, followed by a step exhibiting much slower kinetics.
Because the heparin used here is a mixture of many oligomeric species, it was not possible to directly examine the binding by HDX. Therefore, to determine whether EZ-482 affected heparin binding, we used rhodamine labeled heparin in the presence of EZ-482. Adding apoE to rhodamine labeled heparin (after equilibration) results in a time dependent increase in fluorescence as shown in Figure 3 (top curve). EZ-482 prevents this increase in a concentration-dependent manner indicating that EZ-482 blocks heparin binding. Figure 3 shows that the increase in fluorescence is at least biphasic and that both phases are too slow to represent the actual binding step for heparin to apoE as determined from the data of Futamura et al. (25). Rather, we believe that the slow time course is the re-equilibration of different molecular weight forms of rhodamine labeled heparin. When apoE binds heparin the concentration of unbound heparin changes as does the equilibrium between labeled heparin species. This results in a small change in fluorescence. Heparin fluorescence is not affected by EZ-482 indicating that there is no interaction between heparin and EZ-482 (data not shown). EZ-482 does not bind directly to the heparin binding site but blocks heparin binding since the two binding sites (for heparin and EZ-482) are physically close as discussed later.
Figure 3.
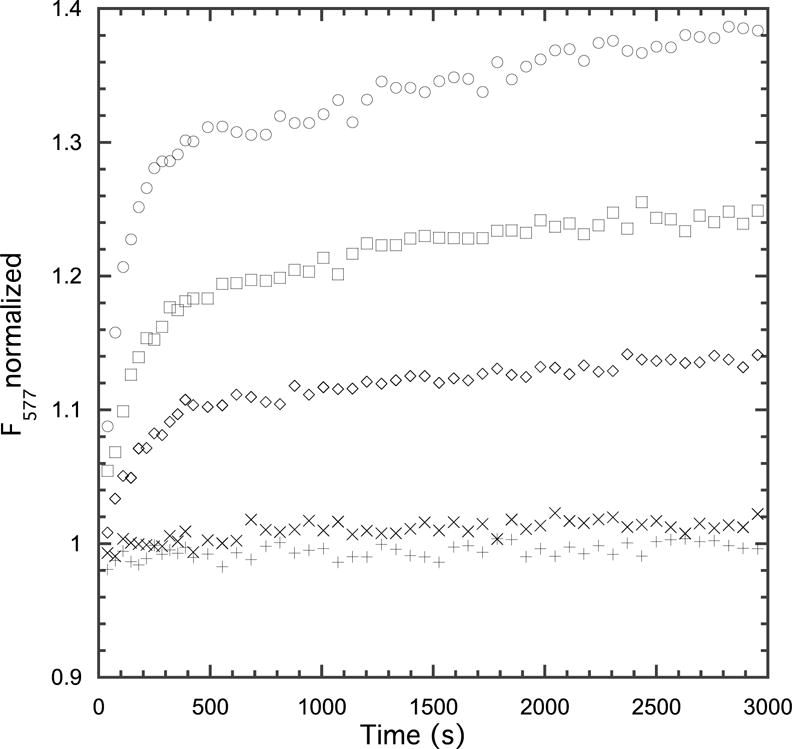
Effect of EZ-482 on heparin binding. In all experiments heparin was diluted from the stock solution to a final concentration of 3 μM and allowed to incubate for 3 hours (not shown). After 3 h, 0.5 μM apoE4 was added resulting in an increase of fluorescence due to heparin binding to apoE4 (top curve). In the remaining curves EZ-482 was incubated with apoE4 for 1 h and the apoE4-EZ-482 complex was added to the preincubated heparin solution. EZ-482 concentrations 0 (○), 0.5 μM (□), 1 μM (◇), 5 μM (×), 10 μM (+). Experiments were performed in 20 mM HEPES buffer, pH 7.4 containing 150 mM NaCl at 25 °C.
Effect of EZ-482 on lipid binding
Lipid binding to apoE is complex. First, it appears that only the apoE monomer binds to lipid (26, 27). The dissociation of oligomers to monomer is slow (28). Second, apoE undergoes a large conformational change – a partial unfolding – such that the protein wraps around the lipid particle with the C-terminal domain in close contact with the lipid (5, 29). Thus, there could be time dependent issues that complicate these studies. Finally, the residues important for lipid binding have not been clearly defined. Nguyen et al. (30), using surface plasmon resonance, analyzed the measured binding of two plasma lipoprotein particles (VLDL and HDL3) to apoE. They observed that both the isolated N- and C-terminal domains could bind the lipoprotein particles, but binding to the C-terminal domain was tighter than that to the N-terminal domain or to the full-length protein. Based on results using C-terminal truncated forms of apoE, Weisgraber and colleagues (31, 32) suggested that a region of the C-terminal domain 250–299 was critical for lipid binding. A mechanism involving these steps has been discussed by Chen et al (2).
To examine whether EZ-482 affected lipid binding, we used an assay utilizing pyrene fluorescence (33, 34). This fluorescent probe shows an increase in fluorescence as a consequence of binding pyrene-labeled apoE4 to egg phosphatidylcholine. For this experiment a pyrene probe was attached to position 285 of apoE4 that had been mutated to cysteine. The data, as a function of EZ-482 concentration (Figure 4), show that the extent of the fluorescence change is dependent on the concentration of EZ-482. Normalization of these data, however, shows that the increase in fluorescence follows exactly the same time course for all concentration of EZ-482. Garai and Frieden determined the rate and equilibrium constants for apoE oligomerization (28), and a model that is consistent with their results suggests that the rapid phase reflects EZ-482 binding to apoE while the slower phase reflects lipid binding as apoE oligomers dissociate to monomer. The time courses observed here are very similar to that observed by Mizuguchi et al. (27) who reached a similar conclusion. Because the time course of the slow fluorescence change is independent of the EZ-482 concentration, this model suggests that EZ-482 does not directly effect apoE binding to lipid.
Figure 4.
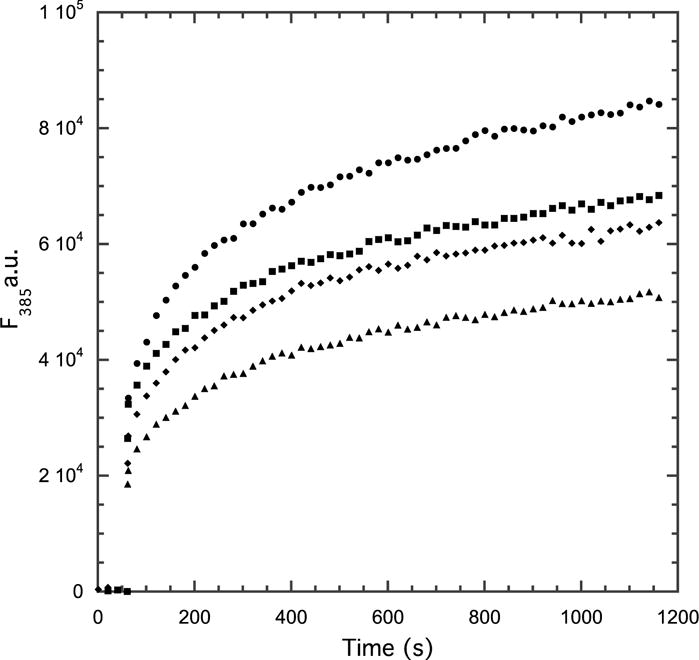
Change in fluorescence of apoE4 labeled with pyrene at position 285 as a function of time at different concentrations of EZ-482. Concentrations used 0 (•), 7.5 μM (■). 15 μM (◆). 30 μM (▲). The data are normalized assuming the starting point in the absence of lipid is 0. Experiment performed in 10 mM phosphate buffer, pH 7.4 in the presence of 0.15 M NaCl and 0.4 mg/mL egg yolk phosphatidyl choline small unilamellar vesicles. The data for the first 60 s were obtained prior to the addition of lipid.
Other attempts at investigating the effect of EZ-482 on lipid binding, such as fluorescently visualizing apoE on vesicles, direct binding of fluorescently labeled lipids, or direct competition by EZ-482 were not definitive.
Discussion
There are many studies directed toward preventing the development of late onset Alzheimer’s disease. The majority of recent studies focus on Aβ, either preventing its formation by inhibiting the β- or γ-secretase, or using antibodies that bind to various forms of the Aβ plaques (35). Currently such studies have achieved limited success. Only a few studies have focused on attempting to modify the behavior of apoE4, the major risk factor for the development of late onset Alzheimer’s disease. Chen et al. (12) did examine a large library to identify small molecular weight compounds that might alter the behavior of apoE4 to reduce detrimental effects on neurons in culture. Using an in vivo assay, they identified several phthalazinone derivatives that appeared to bind apoE. The compound used in our studies is based in part on using a fragment of the molecules they observed to be effective. Both Sadowski et al. (36) and Liu et al. (37) examined a number of apoE peptides to map the apoE/Aβ interaction to serve as a guide for inhibitor binding. Goyal et al., in contrast, carried out in silico screening of natural compounds against the N-terminal domain of apoE4 identifying two possible candidates although neither was tested experimentally (38). A recent paper (39) suggests a therapeutic strategy as relates to the development of cognitive deficits in Alzheimer’s disease would be to target PIP2 homeostasis by modifying apoE4 phenotypes.
In this work, we used multiple biophysical tools including hydrogen-deuterium exchange coupled to mass spectrometry (HDX-MS) to understand the interaction between EZ-482 and apoE, affording the most complete characterization of any small molecular weight compound binding to apoE. We can summarize the outcome as follows: EZ-482 binds to sites on apoE that are in the C-terminal domain encompassing residues 229–243 and 258–265. The dissociation constants for binding are within the range of 5–10 μM. The uncertainty of whether there are one or two sites for EZ-482 binding may relate to formation of the apoE oligomer. Thus, the two regions shown by HDX may be close to each other in the oligomer, and a single EZ-482 may overlap both sites.
As shown in Figure 5 we also map residues that are affected by EZ-482 binding of both apoE3 and apoE4 onto the monomeric mutant NMR of apoE3. The differential HDX are the average values across all time points. As discussed above, various N-terminal regions of apoE4 show allosteric changes (deprotection from HDX) upon ligand binding whereas no differences occur for the N-terminal of apoE3. Interestingly, these regions are located near the center points of four α-helices and spatially close to the binding sites.
Figure 5.
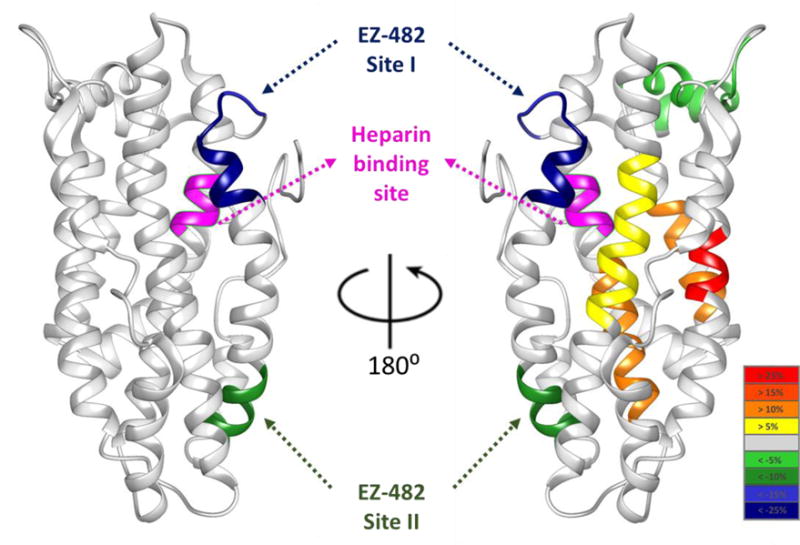
Averaged differential deuterium uptake of apoE3 (left) and apoE4 (right) across all time points mapped onto NMR structure of apoE3 monomeric mutant (PDB: 2L7B) for visual convenience. The color scale is shown on the bottom right: yellow, orange, orange red and red correspond to increased HDX of more than 5%, 10%, 15%, and 25%, respectively; regions that are more protected upon EZ-482 binding are colored in light green, green, blue and dark blue with decreased HDX of more than 5%, 10%, 15%, and 25%, respectively. Shown in magenta is the 140–145 region of apoE that binds heparin. Two binding sites (dark green, blue/dark blue) are indicated with arrows.
Two additional regions of apoE4 that show some protection in the bound state, 44–51 and 206–217 (colored in light green in Figure 5) are located close to each other and to regions that show increased HDX, but opposite to the binding sites. Therefore, we think the protection in these regions is part of the N-terminal allosteric effect. Other than this allosteric effect, there is no difference between apoE3 and apoE4 (EZ-482 binding sites are indicated by arrows in Figure 5). Perhaps this is not unexpected; we proposed earlier that there are conformational differences between apoE3 and apoE4 in the C-terminal domain (3). Those differences, however, are not in the region to which EZ-482 binds. As pointed out by Frieden and Garai, there are conformational differences between apoE isoforms in the C-terminal domain indicating that there may be compounds with preferential binding to different isoforms (3). The fact that denaturation curves also differ between isoforms also strengthens this possibility (40).
Binding of EZ-482 prevents heparin binding even though heparin is bound to the N-terminal domain. We proposed above that EZ-482 does not bind directly to the heparin binding site (140–145, colored in magenta) but blocks access to that region of the non-lipidated protein, as shown in Figure 5. The heparin and the EZ-482 binding sites, although in different domains, are quite close in space. One possible binding mode that could affect heparin binding is for EZ-482 to fit in the groove between the C- and N-terminal domains. Blocking access to the heparin binding site has important consequences for apoE binding to the cellular receptors LDLR and LRP-1. For example, Lalazar et al. found that mutations in the region 136–150, and particularly a Lys146Ala mutation, led to decreased LDL receptor binding (41). Croy et al. (42) have shown that LRP-1 binds to two regions of the N-terminal receptor binding domain (130–149) and (141–155), the same regions affected by EZ-482 binding. Thus EZ-482 may affect apoE binding both the LRP-1 and LDL receptors.
In one approach we used SYPRO Orange as a reporter for small molecule binding. HDX shows that both this dye and EZ-482 bind to the same region of apoE3 and, as a consequence, the SYPRO Orange fluorescence decreases in the presence of EZ-482. It is possible that the use of this dye will only detect binding of small molecules at this particular region. On the other hand, some small molecules we have tested show an increase of SYPRO Orange fluorescence indicating binding to a different region (data not shown). It is important to test other fluorescent dyes with respect to where they bind to apoE. The dissociation constant obtained using competition with SYPRO Orange is similar to those determined using fluorescently labeled apoE4 (Table 1). Although one can legitimately ask whether it is a SYPRO Orange-EZ-482 complex that binds to apoE, this is not the case since the same dissociation constant for EZ-482 is obtained in the absence of SYPRO Orange.
This study has made extensive use of hydrogen-deuterium exchange methods, currently an important tool for characterizing protein and small molecule therapeutics interaction (43–45). Protein structural information can be coupled to mass shift and detected by mass spectrometry. The protein backbone amide HDX reports on solvent accessibility and hydrogen-bond networking (46–48), characterizing conformational changes induced by small molecule ligand binding (49).
In summary, we describe methods that can be used to differentiate apoE3 from apoE4. This particular compound, EZ-482, binds equally well to both apoE3 and apoE4 with dissociation constants of ~8 μM under the conditions used. However, the binding to apoE4 is accompanied by the N-terminal allosteric effect. Although EZ-482 binds to the C-terminal domain of the protein, it blocks the heparin binding region in the N-terminal domain. The results presented here are important because the region of apoE that binds heparin also interacts with apoE receptors such as LDLR and LRP-1 which are known to be involved in the pathogenesis of late onset Alzheimer’s disease.
Supplementary Material
Acknowledgments
The authors would like to thank Dr. James Janetka for suggesting EZ-482 for these studies and Dr. Melissa Brereton for helpful discussions.
Funding: This work was supported by NIH Grant RF1 AG044331 to C.F. and grant 2 P41 GM103422 to M.L.G.
Footnotes
The authors declare no competing financial interest
References
- 1.Weisgraber KH, Rall SC, Jr, Mahley RW. Human E apoprotein heterogeneity. Cysteine-arginine interchanges in the amino acid sequence of the apo-E isoforms. J Biol Chem. 1981;256:9077–9083. [PubMed] [Google Scholar]
- 2.Chen J, Li Q, Wang J. Topology of human apolipoprotein E3 uniquely regulates its diverse biological functions. Proc Natl Acad Sci U S A. 2011;108:14813–14818. doi: 10.1073/pnas.1106420108. [DOI] [PMC free article] [PubMed] [Google Scholar]
- 3.Frieden C, Garai K. Structural differences between apoE3 and apoE4 may be useful in developing therapeutic agents for Alzheimer’s disease. Proc Natl Acad Sci U S A. 2012;109:8913–8918. doi: 10.1073/pnas.1207022109. [DOI] [PMC free article] [PubMed] [Google Scholar]
- 4.Frieden C, Garai K. Concerning the structure of apoE. Prot Sci. 2013;22:1820–1825. doi: 10.1002/pro.2379. [DOI] [PMC free article] [PubMed] [Google Scholar]
- 5.Hatters DM, Peters-Libeu CA, Weisgraber KH. Apolipoprotein E structure: insights into function. Trends Biochem Sci. 2006;31:445–454. doi: 10.1016/j.tibs.2006.06.008. [DOI] [PubMed] [Google Scholar]
- 6.Mahley RW, Weisgraber KH, Huang Y. Apolipoprotein E: structure determines function, from atherosclerosis to Alzheimer’s disease to AIDS. J Lipid Res. 2009;50(Suppl):S183–188. doi: 10.1194/jlr.R800069-JLR200. [DOI] [PMC free article] [PubMed] [Google Scholar]
- 7.Corder EH, Saunders AM, Strittmatter WJ, Schmechel DE, Gaskell PC, Small GW, Roses AD, Haines JL, Pericak-Vance MA. Gene dose of apolipoprotein E type 4 allele and the risk of Alzheimer’s disease in late onset families. Science. 1993;261:921–923. doi: 10.1126/science.8346443. [DOI] [PubMed] [Google Scholar]
- 8.Saunders AM, Strittmatter WJ, Schmechel D, George-Hyslop PH, Pericak-Vance MA, Joo SH, Rosi BL, Gusella JF, Crapper-MacLachlan DR, Alberts MJ, et al. Association of apolipoprotein E allele epsilon 4 with late-onset familial and sporadic Alzheimer’s Disease. Neurology. 1993;43:1467–1472. doi: 10.1212/wnl.43.8.1467. [DOI] [PubMed] [Google Scholar]
- 9.Bertram L. Alzheimer’s disease genetics current status and future perspectives. Int Rev Neurobiol. 2009:167–184. doi: 10.1016/S0074-7742(09)00409-7. 2009/06/09 ed. [DOI] [PubMed] [Google Scholar]
- 10.Roses AD. Apolipoprotein E alleles as risk factors in Alzheimer’s disease. Annu Rev Med. 1996;47:387–400. doi: 10.1146/annurev.med.47.1.387. [DOI] [PubMed] [Google Scholar]
- 11.Mahley RW, Weisgraber KH, Huang Y. Apolipoprotein E4: a causative factor and therapeutic target in neuropathology, including Alzheimer’s disease. Proc Natl Acad Sci U S A. 2006;103:5644–5651. doi: 10.1073/pnas.0600549103. [DOI] [PMC free article] [PubMed] [Google Scholar]
- 12.Chen HK, Liu Z, Meyer-Franke A, Brodbeck J, Miranda RD, McGuire JG, Pleiss MA, Ji ZS, Balestra ME, Walker DW, Xu Q, Jeong DE, Budamagunta MS, Voss JC, Freedman SB, Weisgraber KH, Huang Y, Mahley RW. Small molecule structure correctors abolish detrimental effects of apolipoprotein E4 in cultured neurons. J Biol Chem. 2012;287:5253–5266. doi: 10.1074/jbc.M111.276162. [DOI] [PMC free article] [PubMed] [Google Scholar]
- 13.Mahley RW, Huang Y. Small-molecule structure correctors target abnormal protein structure and function: structure corrector rescue of apolipoprotein E4-associated neuropathology. J Med Chem. 2012;55:8997–9008. doi: 10.1021/jm3008618. [DOI] [PMC free article] [PubMed] [Google Scholar]
- 14.Michaelson DM. ApoE4: The most prevalent yet understudied risk factor for Alzheimer’s disease. Alzheimer’s & Dementia. 2014;10:861–868. doi: 10.1016/j.jalz.2014.06.015. [DOI] [PubMed] [Google Scholar]
- 15.Huang RYC, Garai K, Frieden C, Gross ML. Hydrogen/deuterium exchange and electron-transfer dissociation mass spectrometry determine the interface and dynamics of apolipoprotein E oligomerization. Biochemistry. 2011;50:9273–9282. doi: 10.1021/bi2010027. [DOI] [PMC free article] [PubMed] [Google Scholar]
- 16.Hatters DM, Peters-Libeu CA, Weisgraber KH. Engineering conformational destabilization into mouse apolipoprotein E. A model for a unique property of human apolipoprotein E4. J Biol Chem. 2005;280:26477–26482. doi: 10.1074/jbc.M503910200. [DOI] [PubMed] [Google Scholar]
- 17.Xu H, Freitas MA. MassMatrix: a database search program for rapid characterization of proteins and peptides from tandem mass spectrometry data. Proteomics. 2009;9:1548–1555. doi: 10.1002/pmic.200700322. [DOI] [PMC free article] [PubMed] [Google Scholar]
- 18.Schuck P. Size-distribution analysis of macromolecules by sedimentation velocity ultracentrifugation and lamm equation modeling. Biophys J. 2000;78:1606–1619. doi: 10.1016/S0006-3495(00)76713-0. [DOI] [PMC free article] [PubMed] [Google Scholar]
- 19.Gorshkova IN, Kypreos KE, Gantz DL, Zannis VI, Atkinson D. Biophysical properties of apolipoprotein E4 variants: implications in molecular mechanisms of correction of hypertriglyceridemia. Biochemistry. 2008;47:12644–12654. doi: 10.1021/bi8015857. [DOI] [PMC free article] [PubMed] [Google Scholar]
- 20.Shelburne FA, Quarfordt SH. The interaction of heparin with an apoprotein of human very low density lipoprotein. J Clin Invest. 1977;60:944–950. doi: 10.1172/JCI108849. [DOI] [PMC free article] [PubMed] [Google Scholar]
- 21.Mahley RW, Weisgraber KH, Innerarity TL. Interaction of plasma lipoproteins containing apolipoproteins B and E with heparin and cell surface receptors. Biochim Biophys Acta. 1979;575:81–91. doi: 10.1016/0005-2760(79)90133-4. [DOI] [PubMed] [Google Scholar]
- 22.Weisgraber KH, Rall SC, Jr, Mahley RW, Milne RW, Marcel YL, Sparrow JT. Human apolipoprotein E. Determination of the heparin binding sites of apolipoprotein E3. J Biol Chem. 1986;261:2068–2076. [PubMed] [Google Scholar]
- 23.Saito H, Dhanasekaran P, Nguyen D, Baldwin F, Weisgraber KH, Wehrli S, Phillips MC, Lund-Katz S. Characterization of the heparin binding sites in human apolipoprotein E. J Biol Chem. 2003;278:14782–14787. doi: 10.1074/jbc.M213207200. [DOI] [PubMed] [Google Scholar]
- 24.Dong J, Peters-Libeu CA, Weisgraber KH, Segelke BW, Rupp B, Capila I, Hernaiz MJ, LeBrun LA, Linhardt RJ. Interaction of the N-terminal domain of apolipoprotein E4 with heparin. Biochemistry. 2001;40:2826–2834. doi: 10.1021/bi002417n. [DOI] [PubMed] [Google Scholar]
- 25.Futamura M, Dhanasekaran P, Handa T, Phillips MC, Lund-Katz S, Saito H. Two-step mechanism of binding of apolipoprotein E to heparin: implications for the kinetics of apolipoprotein E-heparan sulfate proteoglycan complex formation on cell surfaces. J Biol Chem. 2005;280:5414–5422. doi: 10.1074/jbc.M411719200. [DOI] [PubMed] [Google Scholar]
- 26.Garai K, Baban B, Frieden C. Dissociation of apolipoprotein E oligomers to monomer is required for high-affinity binding to phospholipid vesicles. Biochemistry. 2011;50:2550–2558. doi: 10.1021/bi1020106. [DOI] [PMC free article] [PubMed] [Google Scholar]
- 27.Mizuguchi C, Hata M, Dhanasekaran P, Nickel M, Okuhira K, Phillips MC, Lund-Katz S, Saito H. Fluorescence study of domain structure and lipid interaction of human apolipoproteins E3 and E4. Biochim Biophys Acta. 2014;1841:1716–1724. doi: 10.1016/j.bbalip.2014.09.019. [DOI] [PMC free article] [PubMed] [Google Scholar]
- 28.Garai K, Frieden C. The Association-Dissociation Behavior of the ApoE Proteins: Kinetic and Equilibrium Studies. Biochemistry. 2010;49:9533–9541. doi: 10.1021/bi101407m. [DOI] [PMC free article] [PubMed] [Google Scholar]
- 29.Peters-Libeu CA, Newhouse Y, Hatters DM, Weisgraber KH. Model of biologically active apolipoprotein E bound to dipalmitoylphosphatidylcholine. J Biol Chem. 2006;281:1073–1079. doi: 10.1074/jbc.M510851200. [DOI] [PubMed] [Google Scholar]
- 30.Nguyen D, Dhanasekaran P, Phillips MC, Lund-Katz S. Molecular mechanism of apolipoprotein E binding to lipoprotein particles. Biochemistry. 2009;48:3025–3032. doi: 10.1021/bi9000694. [DOI] [PMC free article] [PubMed] [Google Scholar]
- 31.Westerlund JA, Weisgraber KH. Discrete carboxyl-terminal segments of apolipoprotein E mediate lipoprotein association and protein oligomerization. J Biol Chem. 1993;268:15745–15750. [PubMed] [Google Scholar]
- 32.Dong L, Weisgraber K. Human apolipoprotein E4 domain interaction. Arginine 61 and glutamic acid 255 interact to direct the preference for very low density lipoproteins. J Biol Chem. 1996;271:19053–19057. doi: 10.1074/jbc.271.32.19053. [DOI] [PubMed] [Google Scholar]
- 33.Patel AB, Khumsupan P, Narayanaswami V. Pyrene Fluorescence Analysis Offers New Insights into the Conformation of the Lipoprotein-Binding Domain of Human Apolipoprotein E. Biochemistry. 2010;49:1766–1775. doi: 10.1021/bi901902e. [DOI] [PubMed] [Google Scholar]
- 34.Mizuguchi C, Hata M, Dhanasekaran P, Nickel M, Phillips MC, Lund-Katz S, Saito H. Fluorescence analysis of the lipid binding-induced conformational change of apolipoprotein E4. Biochemistry. 2012;51:5580–5588. doi: 10.1021/bi300672s. [DOI] [PMC free article] [PubMed] [Google Scholar]
- 35.Liao F, Hori Y, Hudry E, Bauer AQ, Jiang H, Mahan TE, Lefton KB, Zhang TJ, Dearborn JT, Kim J, Culver JP, Betensky R, Wozniak DF, Hyman BT, Holtzman DM. Anti-ApoE antibody given after plaque onset decreases Abeta accumulation and improves brain function in a mouse model of Abeta amyloidosis. The J Neuroscience. 2014;34:7281–7292. doi: 10.1523/JNEUROSCI.0646-14.2014. [DOI] [PMC free article] [PubMed] [Google Scholar]
- 36.Sadowski MJ, Pankiewicz J, Scholtzova H, Mehta PD, Prelli F, Quartermain D, Wisniewski T. Blocking the apolipoprotein E/amyloid-beta interaction as a potential therapeutic approach for Alzheimer’s disease. Proc Natl Acad Sci U S A. 2006;103:18787–18792. doi: 10.1073/pnas.0604011103. [DOI] [PMC free article] [PubMed] [Google Scholar]
- 37.Liu Q, Wu WH, Fang CL, Li RW, Liu P, Lei P, Hu J, Sun X, Zheng YZ, Zhao YF, Li YM. Mapping ApoE/Abeta binding regions to guide inhibitor discovery. Molecular bioSystems. 2011;7:1693–1700. doi: 10.1039/c1mb05019b. [DOI] [PubMed] [Google Scholar]
- 38.Goyal M, Grover S, Dhanjal JK, Goyal S, Tyagi C, Chacko S, Grover A. Novel natural structure corrector of ApoE4 for checking Alzheimer’s disease: benefits from high throughput screening and molecular dynamics simulations. Biomed Res Int. 2013;2013:620793. doi: 10.1155/2013/620793. [DOI] [PMC free article] [PubMed] [Google Scholar]
- 39.Zhu L, Zhong M, Elder GA, Sano M, Holtzman DM, Gandy S, Cardozo C, Haroutunian V, Robakis NK, Cai D. Phospholipid dysregulation contributes to ApoE4-associated cognitive deficits in Alzheimer’s disease pathogenesis. Proc Natl Acad Sci U S A. 2015;112:11965–11970. doi: 10.1073/pnas.1510011112. [DOI] [PMC free article] [PubMed] [Google Scholar]
- 40.Garai K, Mustafi SM, Baban B, Frieden C. Structural differences between apolipoprotein E3 and E4 as measured by (19)F NMR. Prot Sci. 2010;19:66–74. doi: 10.1002/pro.283. [DOI] [PMC free article] [PubMed] [Google Scholar]
- 41.Lalazar A, Weisgraber KH, Rall SC, Jr, Giladi H, Innerarity TL, Levanon AZ, Boyles JK, Amit B, Gorecki M, Mahley RW, et al. Site-specific mutagenesis of human apolipoprotein E. Receptor binding activity of variants with single amino acid substitutions. J Biol Chem. 1988;263:3542–3545. [PubMed] [Google Scholar]
- 42.Croy JE, Brandon T, Komives EA. Two apolipoprotein E mimetic peptides, ApoE(130–149) and ApoE(141–155)2, bind to LRP1. Biochemistry. 2004;43:7328–7335. doi: 10.1021/bi036208p. [DOI] [PubMed] [Google Scholar]
- 43.Woods VL, Jr, Hamuro Y. High resolution, high-throughput amide deuterium exchange-mass spectrometry (DXMS) determination of protein binding site structure and dynamics: utility in pharmaceutical design. J Cell Biochem Suppl. 2001;37:89–98. doi: 10.1002/jcb.10069. [DOI] [PubMed] [Google Scholar]
- 44.Chalmers MJ, Busby SA, Pascal BD, West GM, Griffin PR. Differential hydrogen/deuterium exchange mass spectrometry analysis of protein-ligand interactions. Expert Rev Proteomics. 2011;8:43–59. doi: 10.1586/epr.10.109. [DOI] [PMC free article] [PubMed] [Google Scholar]
- 45.Marciano DP, Dharmarajan V, Griffin PR. HDX-MS guided drug discovery: small molecules and biopharmaceuticals. Curr Opin in Struct Biol. 2014;28:105–111. doi: 10.1016/j.sbi.2014.08.007. [DOI] [PMC free article] [PubMed] [Google Scholar]
- 46.Engen JR. Analysis of protein conformation and dynamics by hydrogen/deuterium exchange MS. Anal Chem. 2009;81:7870–7875. doi: 10.1021/ac901154s. [DOI] [PMC free article] [PubMed] [Google Scholar]
- 47.Konermann L, Pan J, Liu YH. Hydrogen exchange mass spectrometry for studying protein structure and dynamics. Chem Soc Reviews. 2011;40:1224–1234. doi: 10.1039/c0cs00113a. [DOI] [PubMed] [Google Scholar]
- 48.Englander SW. Hydrogen exchange and mass spectrometry: A historical perspective. J Amer Soc for Mass Spectr. 2006;17:1481–1489. doi: 10.1016/j.jasms.2006.06.006. [DOI] [PMC free article] [PubMed] [Google Scholar]
- 49.Sowole MA, Konermann L. Effects of protein-ligand interactions on hydrogen/deuterium exchange kinetics: canonical and noncanonical scenarios. Anal Chem. 2014;86:6715–6722. doi: 10.1021/ac501849n. [DOI] [PubMed] [Google Scholar]
Associated Data
This section collects any data citations, data availability statements, or supplementary materials included in this article.