Abstract
Light microscopy plays a key role in biological studies and medical diagnosis. The spatial resolution of conventional optical microscopes is limited to approximately half the wavelength of the illumination light as a result of the diffraction limit. Several approaches—including confocal microscopy, stimulated emission depletion microscopy, stochastic optical reconstruction microscopy, photoactivated localization microscopy, and structured illumination microscopy—have been established to achieve super-resolution imaging. However, none of these methods is suitable for the super-resolution ophthalmoscopy of retinal structures because of laser safety issues and inevitable eye movements. We recently experimentally validated virtually structured detection (VSD) as an alternative strategy to extend the diffraction limit. Without the complexity of structured illumination, VSD provides an easy, low-cost, and phase artifact–free strategy to achieve super-resolution in scanning laser microscopy. In this article we summarize the basic principles of the VSD method, review our demonstrated single-point and line-scan super-resolution systems, and discuss both technical challenges and the potential of VSD-based instrumentation for super-resolution ophthalmoscopy of the retina.
Keywords: confocal microscopy, diffraction limit, ophthalmoscopy, optical microscopy, optical resolution, photoreceptor, retina, scanning laser microscopy, structured illumination microscopy, virtually structured detection
I. INTRODUCTION
Light microscopy, an indispensable tool for biological study and medical diagnosis, is essential for examining the subcellular details of biological structures or morphological distortions. Spatial resolution of one optical instrument is characterized by the finest detail that can be reliably identified. In 1873 Ernst Abbe1 realized that the resolution of optical imaging instruments is fundamentally limited by the diffraction of light. Inspired by Abbe, mathematical proofs were eventually derived by von Helmholtz,2 and experimental confirmation was achieved in 1877 by Stephenson.3 This theory explains why a microscope cannot resolve 2 objects separated by a distance smaller than the diffraction limit and can be expressed as:
| (1) |
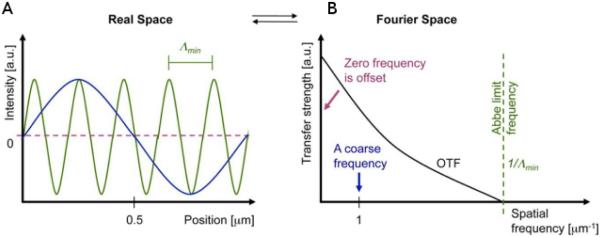
where λ is the wavelength of illumination light and NA is the numerical aperture of an optical system. NA = nsinα, where n is the index of refraction in the object space and α is the maximum convergence half-angle of the light beam. A point spread function (PSF) can be used to explain resolution in the real space, and the imaging process itself acts as a convolution operation of the PSF over the target area. An optical transfer function (OTF), which is a Fourier transform of the PSF, can also be used to describe the frequency response of the filtering process. The OTF decreases with increasing frequency, and a spatial frequency cutoff represents the system resolution (shown in Fig. 1). Theoretically, light diffraction limits the best resolution of conventional light microscopy at 200 nm. The dimension of many biological structures and molecular processes is smaller than the diffraction limit, however, and cannot be directly observed with conventional optical microscopes.4
FIG. 1.
(A) Coarse (blue) and fine (green) spatial structure in real space (numerical simulation). (B) corresponding low and high frequency wave in Fourier space. The optical transfer function (OTF) and cutoff frequency are also shown. a.u., arbitrary units. (From ref. 5. Reprinted by permission from Rockefeller University Press. © 2010.)
For over a century, the Abbe diffraction limit was considered as the fundamental and unbreakable rule restricting the performance of optical microscopy. However, emerging techniques such as confocal scanning microscopy, stimulated emission depletion (STED) microscopy, photoactivated localization microscopy (PALM), stochastic optical reconstruction microscopy (STORM), and structured illumination microscopy (SIM) have broken the diffraction-limited resolution. Excellent articles review technical rationales and applications of confocal microscopy, STED, PALM/STORM, and SIM.4–12 We provide a brief summary of these methods in Section II. Each of these methods has limitations and can be used only under certain circumstances. To date, none of these established super-resolution imaging techniques can be directly applied to in vivo super-resolution ophthalmoscopy because of laser safety issues and inevitable eye movements.
It is well known that eye diseases such as age-related macular degeneration13 and glaucoma14 can cause pathological changes in the retina. Without prompt and effective intervention, eye diseases can ultimately lead to severe vision loss and even legal blindness. In the early stages of eye diseases, associated cellular damage is in the form of degenerative or apoptotic changes to a small group of retinal cells. Therefore, high-resolution examination of the retinal morphology is essential for detecting disease and evaluating treatment. In the 1980s the scanning laser ophthalmoscope (SLO) was used for ophthalmoscopy.15 With improved efficiency in light collection and real-time imaging, the SLO offers a powerful imaging modality for eye examination. The confocal SLO (CSLO) enhanced image contrast compared with conventional imaging systems with flood illumination.16 However, the lateral and axial resolutions are confined to 5 and 300 μm, respectively. In the 1990s adaptive optics (AO) was uniquely integrated with a fundus camera to visualize individual photoreceptors in living human eyes.17 Resolutions in AO cameras are about 2–3 μm laterally and <100 μm axially. The first AO SLO was presented in 2002 to measure and correct high-order aberrations of the human eye and provide real-time, microscopic views of the living human retina with improved optical quality.18 With the AO SLO, resolutions are about 2.5 μm laterally and <100 μm axially, a video-rate imaging speed can be obtained, and the scanning angles are up to 5°.19 In vivo imaging of human cone photoreceptor inner segments was also presented by a nonconfocal split-detector AO SLO.20 Although SLO, CSLO, and AO SLO have provided improved resolution to enable a wide range of retinal studies, further improvement of imaging resolution is desirable to better study and diagnose retinal diseases.21
Spatial resolution of conventional optical instruments is limited by diffraction. In principle, optical resolution can be improved by increasing the NA of optical instruments. However, the available NA cannot be adjusted for in vivo retinal imaging. It is well established that the maximum NA of the human eye is about 0.25, corresponding to an 8-mm pupil diameter and a 16-mm focal length. To tackle the challenge of improving resolution in retinal imaging, we recently demonstrated super-resolution scanning laser microscopy (SLM) based on virtually structured detection (VSD). Without the complexity of structured illumination, VSD provides an easy, low-cost, and phase artifact–free strategy to achieve super-resolution in SLM. In combination with rapid scanning methods, VSD has the potential to be used for in vivo super-resolution ophthalmoscopy. In this review we provide a brief summary of the technical rationales and limitations of currently available super-resolution approaches (Section II), we explain the basic principle of the VSD-based super-resolution SLM (Section III), and we discuss the technical challenges and the potential of using the VSD-based method for in vivo super-resolution ophthalmoscopy (Section IV).
II. AVAILABLE SUPER-RESOLUTION MICROSCOPY TECHNIQUES
Confocal SLM, STED, PALM, STORM, and SIM have broken through diffraction-limited resolutions.
A. Confocal SLM
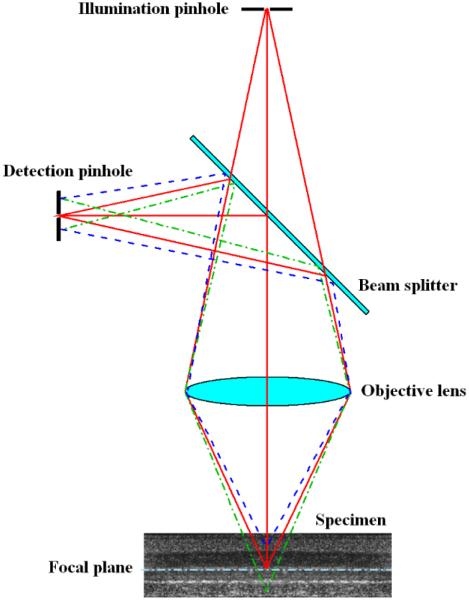
Confocal SLM22–24 uses a tightly focused light spot from an illumination pinhole to scan a sample; a small detection pinhole at the conjugate image plane allows only light originating from the nominal focus to pass. The light emitted from the sampling volume is detected by a photodetector such as a photomultiplier tube or an avalanche photodiode, and a digital image is then constructed by mapping the detected light signal in each scanning spot. A schematic of a confocal microscope is shown in Fig. 2. The light originating from a specimen lying in the focal plane is focused on the pinhole, passes through the pinhole, and reaches the photodetector. Light from other planes away from the focus arrives as a defocused spot at the pinhole. Out-of-focus light is effectively blocked by the pinhole and so is prevented from reaching the photodetector. In comparison with flood illumination microscopy, confocal microscopy has a unique sectioning ability as a result of the rejection of the out-of-focus light; this has led to great success with their use in biomedical fluorescence imaging. If the pinhole is infinitely small, the PSF of confocal SLM can be effectively sharpened by a factor of 1.4.25,26 Double scanning was used to improved lateral resolution and sensitivity.27 It was reported that deconvolution could yield a 2-fold improvement over the diffraction limit in spinning-disk confocal microscopy.28 Ultrafast super-resolution fluorescence imaging at 30–100 frames/second (fps) with a spatial resolution of 120 nm was also achieved.29 Another advantage of confocal microscopy is its ability to acquire 3-dimensional (3D) images.30 However, a necessary trade-off between resolution improvements and imaging sensitivity is required for practical applications. In general, a small pinhole implies better spatial resolution, whereas a large pinhole implies better light efficiency. A technique using 3-zone pupil filters31 has been explored to compensate for resolution degradation with a large pinhole size.32 Fan-shaped apertures were proposed theoretically to improve axial resolution in confocal microscopy for a given pinhole size.33
FIG. 2.
Schematic diagram of confocal microscopy.
B. Stimulated Emission Depletion Microscopy
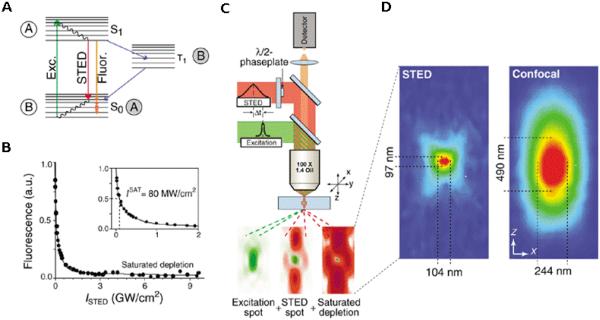
Stefan Hell and his colleagues34,35 demonstrated in the 1990s a novel concept using a nonlinear saturation process not for excitation, but rather for controlled de-excitation of previously excited fluorophores. This strategy is termed STED microscopy. Later experiments showed that both radial and axial resolutions were improved simultaneously.36,37 As shown in Fig. 3, using stimulated emission by a high-intensity, doughnut-shaped laser beam superimposed with the focused excitation laser beam, STED can completely prevent fluorescence emission from peripheral regions of the excitation beam. Excitation from the electronic ground state S0 to S1 is produced with a green light and returns to S0 with the emission of yellow light or by STED with yellow light38 (Fig. 3). In this way, in conjunction with optimal pulse sequences for the excitation and STED beams, light emission is turned off everywhere except in a small part of the diffraction-limited focal region.38,39 STED microscopy can typically achieve high resolutions in the range of 30–60 nm. In 2003 spots with a full width at half maximum of 28 nm were reported in combination with linear deconvolution.40 The comprehensive study of the inverse square root dependence of spatial resolution on the saturation factor in STED microscopy has been reported, and a resolution <25 nm has been demonstrated.41 Imaging nitrogenvacancy centers with a 5.8-nm lateral resolution were reported in 2009.42 Resolution down to 2.4 ± 0.3 nm in raw data images was demonstrated in 2012; this was achieved by focusing the STED beam through a solid immersion lens (NA = 2.2) fabricated into the diamond.43 Video-rate (28 fps) far-field optical imaging with a 62-nm focal spot size in living cells was also presented.44 Super-resolution 3D imaging (50-nm-scale axial resolutions in 3 dimensions) with standard immunofluorescence labeling of an intracellular microtubule structure was presented using the STED-4Pi microscopy mode.45
FIG. 3.
Physical conditions, setup, and typical focal spot for stimulated emission depletion (STED) microscopy. (A) Energy diagram of an organic fluorophore. A: fluorescent state S1; B: ground state S0. (sExc., excitation; Fluor., fluorescence. (B) Saturated depletion of the S1 with increasing STED pulse intensity (ISTED), as measured by the remaining fluorescence of an organic fluorophore. a.u., arbitrary units. (C) Schematic of a point-scanning STED microscope. Excitation and STED are accomplished with synchronized laser pulses focused by a lens into the sample, indicated as green and red beams, respectively. Fluorescence is registered by a detector. The corresponding spots at the focal plane are outlined below. (D) Fluorescent spot in the STED microscope (left) and in the confocal microscope (right). (Reprinted by permission from Nature Publishing Groups Copyright © 2003 Nature Biotechnology.)
C. PALM and STORM
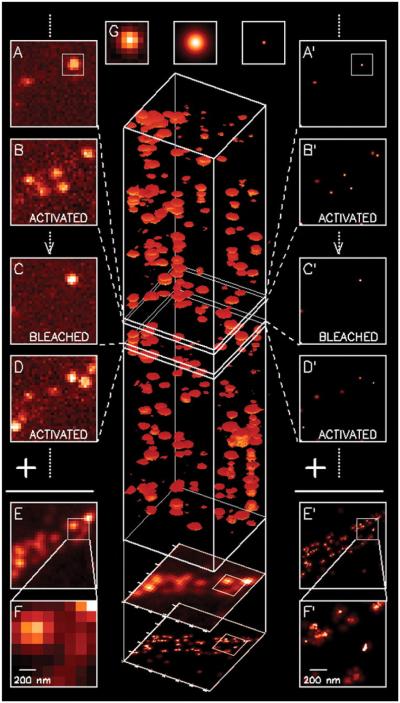
Recent applications of the PALM and STORM super-resolution techniques have extended our understanding of mechanistic principles in biology at the nanoscale level.11 Both STORM and PALM rely on the detection and localization of single fluorescent molecules. In 2006 Betzig et al.46 demonstrated a novel method for optically imaging intracellular proteins at nanometer-scale spatial resolution. PALM relies on the accurate localization of single fluorescent proteins based on temporal isolation of single-molecule emission, and it combines this precise positional information to reconstruct super-resolution images. The principle of PALM is illustrated in Fig. 4. The resolution of PALM is theoretically determined by the accuracy of the location of single fluorescent molecules and can reach 1 nm. PALM has been broadly applied for investigating the spatial organization and motion of diverse types of proteins associated with various structures and environments inside cells and tissues. Such a series of a few thousand images can be processed into high-resolution images, typically reaching a resolution in the range of 20–30 nm. In 2007 Shroff et al.47 reported the use of dual-color PALM to determine the ultrastructural relationship between different proteins fused to spectrally distinct photoactivatable fluorescent proteins. The nanoscale dynamics within individual adhesion complexes in living cells was investigated in 2008 using photontolerant cell lines in combination with PALM.48 Combining a double-plane detection scheme with fluorescence PALM, a 3D subdiffraction resolution (30 × 30 × 75 nm) was achieved in thick samples without compromising speed or sensitivity.49
FIG. 4.
The principle and typical data subsets of photoactivated localization microscopy. (A and B) A sparse subset of photoactivatable fluorescent protein (PA-FP) molecules that are attached to proteins of interest and then fixed within a cell are activated with a brief laser pulse at λact = 405 nm and then imaged at λexc = 561 nm. (C and D) The same process is repeated many times until the population of inactivated, unbleached molecules is depleted. (E and F) Summing the molecular images across all frames results in a diffraction-limited image. (G) If the location of each molecule is determined first by fitting the expected molecular image given by the point spread function of the microscope (center) to the actual molecular image (left), the molecule can be plotted as a Gaussian plot (right) that has a standard deviation equal to the uncertainty in the fitted position. Repeating with all molecules across all frames (A′–D′) and summing the results yields a super-resolution image (E′ and F′). (From Betzig et al.46 Reprinted with permission from The American Association for the Advancement of Science.)
STORM was presented in 2006 by Rust et al.50 and was realized using a variety of photo-switchable probes, including dyes and fluorescent proteins. In its simplest form, STORM can be achieved using a simple fluorescent dye and a laser that continuously illuminates a single color. The principle of STORM is shown in Fig. 5.51 Using this approach, Zhuang51 resolved cellular structures with lateral and axial resolutions of 20 and 50 nm (FWHM), respectively. The multicolor imaging of DNA model samples and mammalian cells with 20- to 30-nm resolution was demonstrated in 2007 by introducing a family of photo-switchable fluorescent probes.52 The multiscale imaging of human cardiac tissue was obtained by correlatively combining nanoscale data from direct STORM with cellular- and tissue-level data provided by confocal microscopy.53 The high resolution allows STORM to resolve the 3D morphology of nanoscopic structures in cells. An image resolution of 20 to 30 nm in the lateral dimensions and 50 to 60 nm in the axial dimension has been achieved.54 The multicolor 3D STORM was also used to obtain whole-cell images with a spatial resolution of 20–30 and 60–70 nm in the lateral and axial dimensions, respectively.55 Combining quantum dot asynchronous spectral blueing with STORM and adaptive optics achieved multicolor 3D imaging with 24-nm lateral and 37-nm axial resolution.56 The fast 2-dimensional (2D) and 3D super-resolution imaging of live cells was achieved by Jones et al.57; the time resolution was as fast as 1–2 seconds with several independent snapshots.
FIG. 5.
The principle of stochastic optical reconstruction microscopy (STORM). A target structure (A) is activated by a subset of probes (B). In (B), green circles that do not overlap are the activated images of fluorescent labels at any given time. Red crosses are the activated fluorophore positions. (C) After enough fluorophores have been localized, a high-resolution image is constructed by plotting the measured positions. (Reprinted by permission from Nature Publishing Groups. Copyright © 2009 Nature Photonics.)
D. Structured Illumination Microscopy
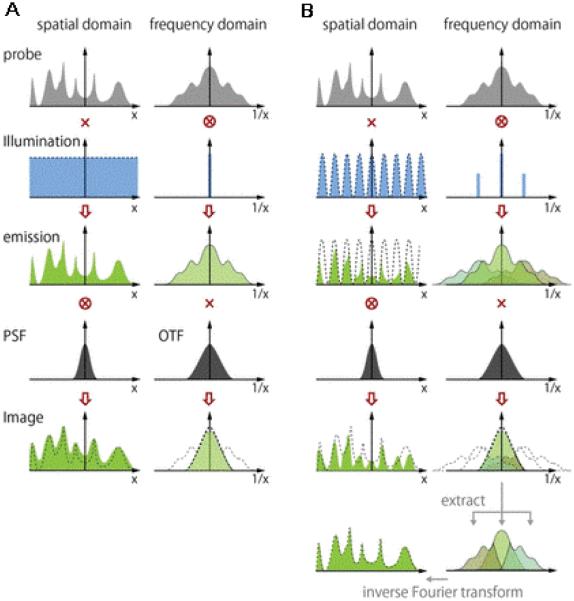
The SIM technique uses structured illumination with sinusoidal striped patterns to shift some high-frequency information beyond the diffraction limit to lower frequencies and thereby expand the effective passband of the optical system.58 This is achieved by projecting the fringe or grid using sophisticated mechanical manipulation to generate structured illumination patterns with specific phases. A high-resolution image can be reconstructed from a series of images with different orientations and phases of the excitation pattern. These reconstructing algorithms use various correlations and filters to separate the overlapping components in frequency space, and they finally shift the moiré information back to the original high-frequency places to reconstruct the image. The comparison of images formed by conventional wide-field microscopy and SIM is shown in Fig. 6.58 With this approach, the lateral resolution increases beyond the classical diffraction limit by a factor of 2.59 Blind SIM is also reported to have a resolution about 2 times better than that of conventional wide-field microscopy and is obtained by simply illuminating a sample with several uncontrolled random speckles.60 Improvement in wide-field fluorescence imaging by a factor of 5.5 using nonlinear SIM has also been reported.61 Surface plasmon resonance–enhanced STED-SIM is proposed to achieve high-speed imaging at 30-nm resolution and to have single-molecule sensitivity.62 Combining patterned illumination with the single-pixel detection strategy, it has been shown that the resolution of the reconstructed image is limited only by the NA of the projecting optics, regardless of the quality of the collection optics.63 An apodization filter without adjustable parameters based on the application of the Lukosz bound was proposed to achieve the artifact-free reconstruction.64 With 3D SIM, an additional 2-fold increase in the axial resolution can be achieved by modulating the excitation light along the z-axis using 3-beam interference and processing a z-stack of images accordingly.65,66 The achieved lateral and axial resolution can be 100 and 300 nm, respectively. Thus, with 3D-SIM, an approximately 8-fold smaller volume can be resolved in comparison with conventional microscopy. Wide-field SIM with 100-nm-scale resolution in 3 dimensions was also reported.67 An attractive feature of structured illumination for cell biological applications is the fact that standard dyes and staining protocols can be used and multiple cellular structures can be simultaneously imaged with optical sectioning in 3 dimensions. Thus fine patterns of replication foci could be resolved throughout the entire nucleus using 3D SIM and quantitatively analyzed. One disadvantage, however, is that 3D SIM requires more image frames per focus plane and also requires the acquisition of images across multiple focal planes.68 The thick-slice blind SIM was reported to provide images with an optical sectioning and lateral resolution enhancement similar to that of a 3D SIM system requiring only single-slice acquisition.69
FIG. 6.
Image formation in conventional wide-field (A) and structured illumination (B) microscopy. In structured illumination microscopy, high-frequency components in the sample can be imaged as a result of the frequency shift by the structured illumination; however, they overlap with lower-frequency image components. Three overlapped components are extracted and reconstructed in the frequency domain. Inverse Fourier transform allows the reconstruction of a fluorescence image with high spatial-frequency information. The circled X represents convolution. OTF, optical transfer function; PSF, point spread function. (From Yamanaka et al.58)
E. Limitations of Current Super-Resolution Techniques
Each super-resolution approach has limitations. For STED, the extremely intensive laser exposure (typically >1.0 MW/cm2) limits its applications for imaging of live cells in biological systems, especially a delicate and fragile retina. STORM/PALM can achieve super-resolution by mapping localizations of individual molecules with photo-switchable fluorescence probes, and therefore the imaging speed is limited by the requirement of acquiring multiple subimages for use in super-resolution reconstruction. Moreover, STED, STORM, and PALM are dedicated to fluorescence detection and are not suitable for intrinsic light transmission/reflectance measurement such as fundus examination of the light reflected intrinsically from the retina. By contrast, SIM can be used for imaging both fluorescence signals and intrinsic light transmission/reflectance. In early SIM instruments, the fringe or grid projection requires complicated mechanical manipulation to generate structured illumination patterns with specific phases, which is particularly challenging for moving samples.70 The use of a spatial light modulator for pattern alterations is rapid, precise, and without mechanical calibration.71 Video-rate (11 fps) SIM imaging of live cells was reported by producing the gratings with a spatial light modulator .72 A frame rate of 7.6 fps per reconstructed 2D slice by 2-beam interference SIM was reported.73 The further improvement of raw data acquisition rate is achieved at 162 fps.74 Recent spatial light modulator–based 3D SIM has been applied for live-cell imaging. The recording speed can be up to 5 seconds/volume with a 120-nm lateral and 360-nm axial resolution.75 A high-speed ferroelectric liquid crystal microdisplay was used to define the illumination pattern.76 A digital micromirror device was used for fringe projection, and the maximum acquisition speed for 3D imaging in the optical sectioning mode was 1.6 × 107 pixels/second.77 Instant SIM was also presented, enabling 3D super-resolution imaging in live cells and embryos with a lateral resolution of 145 nm and an axial resolution of 350 nm at acquisition speeds up to 100 Hz.78 However, these SIMs involve complex and expensive pattern illumination systems. Furthermore, most SIMs use wide-field illumination, which is challenging to apply to thick, dense tissues (i.e., >100 μm thick). Combining a single-plane reconstruction algorithm with hardware for high-speed switching between illumination patterns and rapid acquisition of fluorescence images achieved high-speed super-resolution imaging (in excess of 14 fps) inside biological organisms.79 However, this method is essentially wide-field SIM and very complex. Combined with line scanning, SIM can suppress out-of-focus light by enhancing the resolution of structured illumination and therefore enables high-resolution imaging of thick samples.80,81 Combined with cross-structured illumination pattern optics and line-scanning confocal microscopy, the cross-structured illumination confocal microscope improves lateral resolution and image acquisition speed.82 In this scheme, however, axial resolution is compromised because of the reduced effective NA of the objective. Using Bessel beam plane illumination, rapid 3D isotropic imaging of living cells can be performed.83 With a high acquisition speed and a minimized, out-of-focus background, this plane-illumination microscopy can provide unparalleled optical sectioning ability. However, it is not practical to use a light sheet approach for in vivo applications such as imaging the brain cortex or the retina. In theory, SIM can also be used in a point-scanning system through spatiotemporal modulation, either by modulating the light source intensity in the illumination light path or by moving a physical mask in the detection light path.84 Using intensity-modulated laser scanning structured illumination, a laser point-scanning 2-photon structured illumination microscope was constructed; it enhanced lateral resolution by a factor of 1.42.85 However, the spatiotemporal modulation of the illumination/detection light is technically complicated. To develop a practical alternative, we used the VSD method to demonstrate super-resolution in point-scanning SLM,86 point-scanning optical coherence tomography (OCT),87 and line-scanning SLM.88 The combination of nonlinear photoresponse and point-scanning structured illumination with digital temporal modulation has also been presented.89
III. SCANNING SUPER-RESOLUTION MICROSCOPY BASED ON VSD
The mathematical foundation of the VSD is presented first in this section. Then the super-resolutions based on VSD in point-scanning SLM, point-scanning OCT, and line-scanning SLM are discussed.
A. VSD Principle
A PSF can be used to evaluate resolution in the spatial domain. We assume that the PSF of the illumination path hil(x,y) is identical to the PSF of the detection path hde(x, y). Under incoherent illumination, the theoretical PSF is90
| (2) |
where J1 is the first-order Bessel function, Ω=2πNA/λ, and . The resolution of conventional SLM is defined as the radius of the Airy disc R. In the Fourier domain the corresponding cutoff frequency of the PSF can be expressed as
| (3) |
In other words, only frequencies below the cutoff frequency are able to pass through the conventional SLM system:
| (4) |
We assume that the illumination intensity is normalized at 1. Therefore, in conventional SIM, the acquired wide-field image can be represented as
| (5) |
where m is the modulation function, s is the reflectance ratio, and both hil and hde are the PSF of the illumination path and the detection path, respectively. ⊗ Denotes convolution. Equation (5) represents exactly the acquired image of conventional wide-field SIM in which the modulation function m(x,y) is implemented spatially in the illumination arm.
According to the operation properties of convolution, the image can also be represented as
| (6) |
Equation (6) represents exactly the acquired image of conventional wide-field SIM in which the modulation function m(x, y) is implemented spatially in the detection arm. The equivalency of Eqs. (5) and (6) implies that, in theory, modulations in the illumination arm and in the detection arm are equivalent to each other.
Because the illumination is no longer spatially uniform, scanning microscopy is not space-invariant.84 However, the out-of-band frequencies in the specimen can actually be shifted into the pass band of the microscope through beating with frequencies in the single scanning spot. In VSD-based SLM 2D light profiles of individual scanning patterns are collected by the detector, digitally modulated, and then integrated into the single pixel corresponding to the current scanning position. After each complete frame is scanned, modulated by a particular digital mask, and integrated, one moiré pattern is built. The digital mask m(x, y) with a sinusoidal function is
| (7) |
where θ is the rotation angle of sinusoidal stripes, and φ represents a constant phase. Both l and k are the weight factors. The carrier frequency f0 is set here to the value of the cutoff frequency fc:
The Fourier transform of Eq. (6) is
| (8) |
where fx and fy are spatial frequencies and FFT is the Fourier transform operator. Is the Fourier transform of Eq. (7):
| (9) |
where δ is the Dirac delta function. Because of the sifting property of δ, Eq. (8) can be rewritten as
| (10) |
where constant coefficients are ignored. Thus the higher frequency is shifted toward the lower passing band of . With the given fringe orientation θ, , , and can be solved if the emission OTF and the shift φ are known. The out-of-band frequencies in , which overlap in the collection band, can be then “shifted back” during postprocessing. The finally retrievable frequency based on Eq. (10) is
| (11) |
Therefore, the theoretical retrievable band width is doubled. In other words, the theoretical resolution is enhanced by a factor of 2.
In the 2D system, applying a modulation pattern along a particular direction extends the bandwidth only along the corresponding direction in Fourier space. Thus to extend the bandwidth isotropically in the Fourier space, it is, in theory, necessary to apply modulation patterns along an infinite number of directions. In practice, however, using a set of 3 or 4 orientations of the modulation pattern separated by π/3 or π/4 radians gives an almost isotropic improvement in resolution.
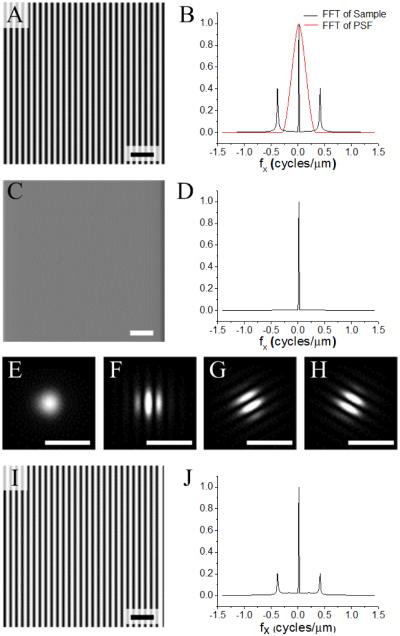
Figure 7 shows a computational simulation of the VSD-based super-resolution method. The diffraction-limited resolution of the simulated system was 5 μm, whereas the period of the simulated sample was 2.5 μm. The information of the sample (black curve in Fig. 7B) could not pass through the passing band of the PSF (red curve in Fig. 7B) except for the direct current (DC) component. Therefore conventional SLM could not differentiate the sinusoidal variations of the sample, as shown in Fig. 7C. Figure 7D confirms that only the DC component of the sample was detected by conventional SLM. The Airy disc was modulated by digital sinusoidal masks, as shown in Fig. 7F–H. Figure 7I shows the image reconstructed using the VSD-based super-resolution method. Figure 7J shows the corresponding Fourier spectrum. The fine details (high spatial frequencies) outside of the critical frequency have been partially retrieved.
FIG. 7.
Computational simulation of the virtually structured detection (VSD)–based super-resolution imaging, with 830 nm, numerical aperture = 0.1, and incoherent illumination assumed. The resolution of this system was 5 μm. (A) A sample of sinusoidal stripes. The period was 2.5 μm. (B) Normalized spectra of the sample and the point spread function of the system on x dimension. (C) Conventional scanning laser microscopy image. (D) Normalized spectrum of the image in (C) on x dimension. (E) Airy disc at the center of the sample used in (A). (F–H) The Airy disc was modulated by digital sinusoidal masks with orientation angles θ of 0, π/3, and 2π/3. (I) Reconstructed super-resolution image. (J) Normalized spectrum of the image in (I) on x dimension. Scale bars = 10 μm. (Reprinted from ref. 86 with permission of The Optical Society.)
B. Point-Scanning Super-Resolution Microscopy Based on VSD
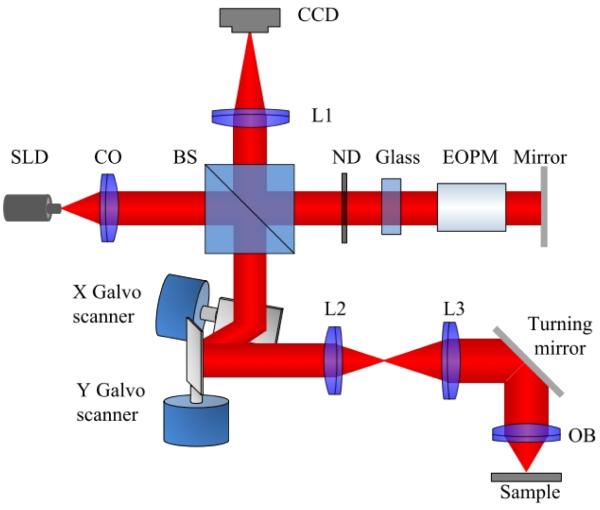
A point-scanning system was first constructed to validate the VSD-based super-resolution microscopy method.86 Figure 8 illustrates a schematic of the point-scanning super-resolution microscopy based on VSD. A superluminescent laser diode (SLD; SLD-35-HP; Superlum) with a center wavelength λ of 830 nm and a bandwidth Δλ of 60 nm is used to produce near-infrared (NIR) illumination of the specimen. A dual-axis galvo mirror (GVS002; Thorlabs, Inc.) is used to steer the focused NIR light across the specimen to generate 2D images. To control the vignetting effect, the Fourier plane of the objective is conjugated to the middle point between these 2 galvo mirrors. The reflected light from the sample is de-scanned by the 2D (x and y) scanning system and is relayed to the image plane. A charge-coupled device (CCD) camera (AVT Pike F-032B) is used to map the light profile of individual sampling points. The stack of 2D object field profiles is used to construct super-resolution images based on the VSD method. A 5× objective with an NA of 0.1 is used in the experiment. A confocal configuration can be readily achieved using virtually synthesized pinholes to reject out-of-focus light. In this study the virtual confocal pinhole was set at 2× the Airy disc diameter.
FIG. 8.
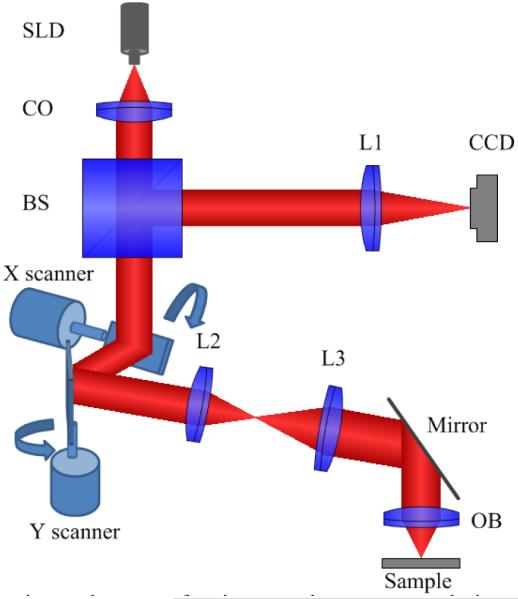
Schematic of the experimental setup of point-scanning super-resolution microscopy based on virtually structured detection. The focal lengths of lenses L1, L2, and L3 are 200, 40, and 150 mm, respectively. BS, beam splitter; CCD, charge-coupled device; CO: collimator; OB, objective; SLD, superluminescent laser diode. (From Ref. 86. Reprinted with permission of the Optical Society (OSA).)
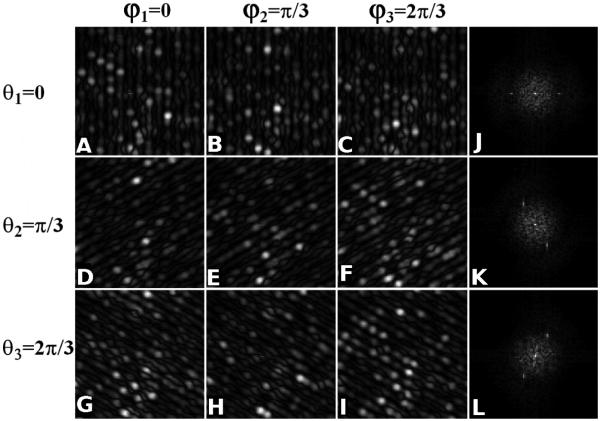
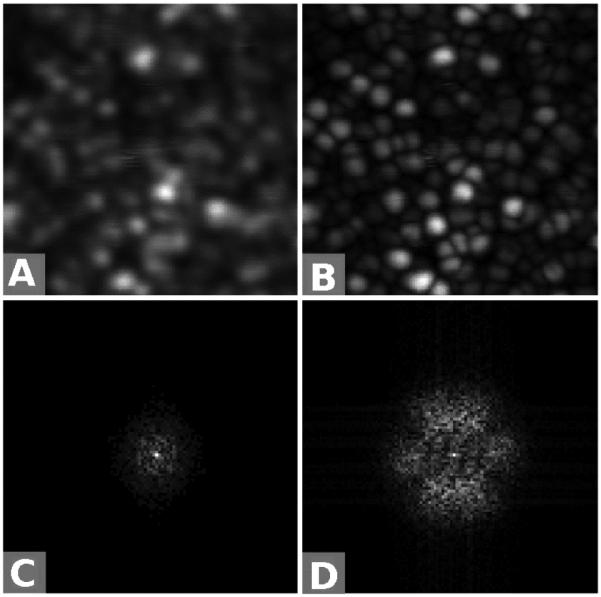
To verify the feasibility of the VSD-based super-resolution imaging of photoreceptors, a freshly isolated intact frog retina was used in the experiment. The frog was killed by rapid decapitation and double pithing. After enucleating the eyes, the globe was hemisected below the equator with fine scissors. Figure 9 shows the obtained moiré pattern and the corresponding results in the Fourier domain. A set of 3 orientations (θ1 = 0, θ2 = π/3, and θ3 = 2π/3) of the digital sinusoidal modulation pattern were applied. With given orientation, the phase shifts (φ1 = 0, φ2 = π/3, and φ3 = 2π/3) were assigned. It has been established that the frog retina consists of photoreceptors with variable diameters (rods: 5–8 μm; cones: 1–3 μm).91 Therefore the frog retina is a simple specimen that allows comparisons of the imaging performance of conventional SLM and VSD reconstruction. Conventional SLM, which has a lateral resolution of 5 μm, could resolve only a partial amount of the photoreceptors, as shown in Fig. 10A. By contrast, VSD-based super-resolution microscopy, which has a lateral resolution of 2.5 μm, was able to detect more photoreceptors, as shown in Fig. 10B. The corresponding results in the Fourier domain are shown in Fig. 10C and D, respectively. Compared with conventional line-scanning microscopy (LSM) (Fig. 10C), VSD reconstruction, as shown in Fig. 10D, contains more information and can yield a resolution approximately improved by a factor of 2.
FIG. 9.
Implementation of virtually structured detection–based super-resolution imaging on photoreceptors in an intact frog retina. A set of 3 orientations of the digital sinusoidal modulation pattern were applied: θ1 = 0, θ2 = π/3, and θ3 = 2π/3. For a given orientation, the phase shifts φ1 = 0, φ2 = π/3, and φ3 = 2π/3 were assigned. (A–I) The obtained Moiré patterns. (J–L) The corresponding results of 3 orientations in the Fourier domain.
FIG. 10.
Point-scanning super-resolution microscopy based on the virtually structured detection (VSD) of freshly isolated frog retina. (A) An image of the retina acquired by conventional scanning laser microscopy. (B) A super-resolution image of the retina by VSD reconstruction. C, D) The corresponding results in the Fourier domain for (A) and (B), respectively.
C. Point-Scanning Super-Resolution OCT Based on VSD
By providing unparalleled axial resolution to achieve depth-resolved imaging, OCT has become a useful tool for high-resolution imaging of the internal microstructure in living tissue and has been extensively used in ophthalmic imaging, vascular medicine, and dermatological studies, among others.92,93 The lateral resolution of OCT is limited by light diffraction, however, which precludes the feasibility of quantitative assessment of individual cells. Wang et. al presented a point-scanning super-resolution OCT based on VSD.87
Figure 11 shows a schematic of VSD-based super-resolution OCT. Similar to point-scanning super-resolution microscopy, an NIR SLD (SLD-35-HP; Superlum) was used to illuminate the sample. A dual-axis galvo mirror (GVS002; Thorlabs, Inc.) was used to scan the focused illuminating light across the sample in a raster pattern and to de-scan light reflected from sample to the light detector. A CCD camera (AVT Pike F-032B) was used in place of the single element sensor in conventional time-domain OCT. In the reference arm, neutral density filters were applied to adjust light intensity. A glass block was inserted into the reference arm to compensate for optical dispersion of the electro-optic phase modulator (model 350-50; Conoptics, Inc.), which was used to introduce rapid, vibration-free phase modulation for OCT reconstruction. Briefly, the electro-optic phase modulator shifted the reference beam light phase by 0, π/2, π, and 3π/2 at each scanning position. Four corresponding interference patterns were recorded at each scanning position for OCT reconstruction. The axial resolution of the system was ~4 μm. With a 0.1 NA 5× objective, the lateral resolution of the conventional OCT was theoretically estimated at 5 μm. In theory, the VSD can improve resolution by a factor of 2. A virtual pinhole (2× the Airy disc diameter) was applied during reconstruction.
FIG. 11.
Schematic of the experimental setup of point-scanning super-resolution optical coherence tomography based on virtually structured detection. The focal lengths of lenses L1, L2, and L3 are 200, 40, and 150 mm, respectively. BS: beam splitter; CCD, charge-coupled device; CO, collimator; EOPM, electro-optic phase modulator; ND, neutral density filter; OB, objective (5× magnification, 0.1 NA); SLD, superluminescent laser diode. (From Ref. 87. Reprinted with permission from AME Publishing Company.)
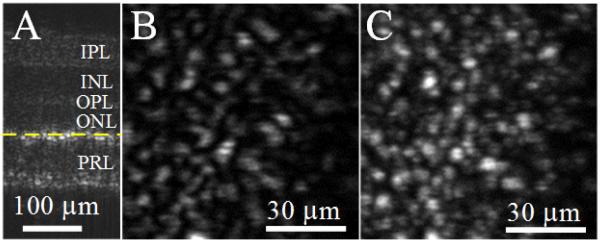
The super-resolution OCT identification of individual frog photoreceptors is demonstrated in Fig. 12 to verify the enhanced resolution of freshly isolated frog retina imaging. A B-scan cross-sectional image is shown in Fig. 12. Different retinal layers can be observed (from top to bottom): inner plexiform layer, inner nuclear layer, outer plexiform layer, outer nuclear layer, and photoreceptor layer. Both en face OCT images were acquired at the inner segment of the photoreceptor layer (yellow dashed line in Fig. 12A). Conventional OCT could achieve only a blurred structure of the photoreceptors, as shown in Fig. 12B. By contrast, VSD-based OCT was able to detect more photoreceptors, as shown in Fig. 12C. This shows that VSD can be successfully integrated with OCT to achieve lateral super-resolution.
FIG. 12.
Virtually structured detection (VSD)–based super-resolution optical coherence tomography (OCT) of freshly isolated retina. (A) A B-scan of an isolated frog retina. (B) En face image of an isolated frog retina acquired by conventional OCT. (C) En face image of an isolated frog retina acquired by VSD-based super-resolution OCT. INL, inner nuclear layer; IPL, inner plexiform layer; ONL, outer nuclear layer; OPL, outer plexiform layer; PRL, photoreceptor layer. (From Ref. 87. Reprinted with permission of from AME Publishing Company.)
VSD imposes a spatially resolved detector to record the diffraction profile of each scanning position. At a frame resolution of 200 × 200 pixels, the imaging speed of point-scanning super-resolution microscopy based on VSD is 40 seconds/frame, which is not suitable for imaging dynamics and moving samples, such as in vivo imaging of the retina, which will inevitably move. Therefore it is essential to combine VSD and rapid scanning approaches to achieved high-speed super-resolution imaging.
D. Super-Resolution LSM Based on VSD
A high image acquisition speed is vital for imaging biological dynamics and moving samples. In this work, an optical system that combines VSD and a line-scanning approach94–96 to achieve super-resolution imaging with a frame speed up to 0.33 fps at a frame resolution of 400 × 400 pixels is presented.
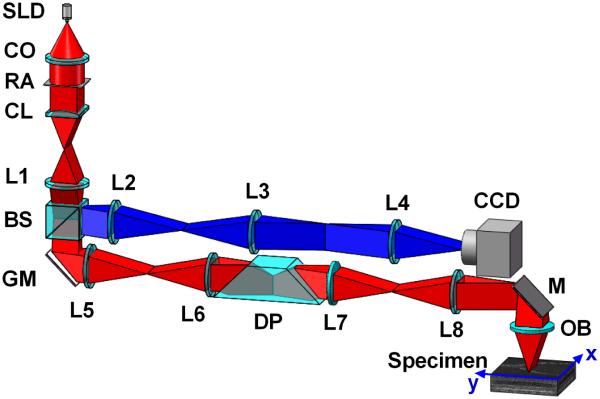
Figure 13 illustrates the experimental setup of super-resolution LSM based on VSD. An NIR SLD (SLD-35-HP; Superlum) was used. A cylindrical lens was used to focus the light into a line. The focused line was swept across the specimen using a single-axis scanning galvo mirror (GVS001; Thorlabs, Inc.). To minimize the vignetting effect, the pivot point of the scanner was conjugated to the pupil plane of the objective. The reflected light from the sample was descanned by the scanner and was relayed to the image plane with a 4-f system. A 2D CCD camera (Pike F-032B; Allied Vision Technologies GmbH) was used to record the light profile of individual sampling lines. To achieve isotropic resolution improvement, a dove prism was mounted to a motorized rotation stage to rotate the image field. The image field was rotated with respect to the longitudinal axis at twice the rate of the prism’s rotation.
FIG. 13.
Schematic of the experimental setup of line-scanning super-resolution microscopy based on virtually structured detection. The focal lengths of lenses L1–L8 are 100, 150, 40, 80, 100, 100, 75, and 100 mm, respectively. BS, beam splitter; CCD, charge-coupled device; CL, cylindrical lens; CO, collimator; DP, dove prism; GM, galvo mirror; M, mirror; OB, objective; RA, rectangular aperture; SLD, superluminescent laser diode. (From Ref. 88. Reprinted with permission from the Optical Society (OSA).)
A region of interest (ROI) for the camera using a virtual slit 0.5× the Airy disc diameter was selected for CLSM imaging. A ROI for the camera using a virtual slit 2× the Airy disc diameter was selected for VSD reconstruction. In the x-axis direction, a maximum length of 400 pixels was set. The ROI of the camera was set at 50 × 400 pixels. Along the y-axis, 400 frames were sampled. Thus the final reconstructed super-resolution image size was 400 × 400 pixels. The sampling frame rate of the CCD was set at 1000 fps. Therefore the line-scanning scheme required 0.4 second to finish 1-dimensional scanning. To enhance the isotropic resolution, a 4-angle (θ1 = 0, θ2 = π/4, θ3 = π/2, and θ4 = 3π/4) scanning pattern was used. The acquisition time was ~1.6 seconds for the camera and the transition time was ~1.4 seconds for the rotation motor (NR360S; Throlabs, Inc.) to control the dove prism at the desired angles in sequence.
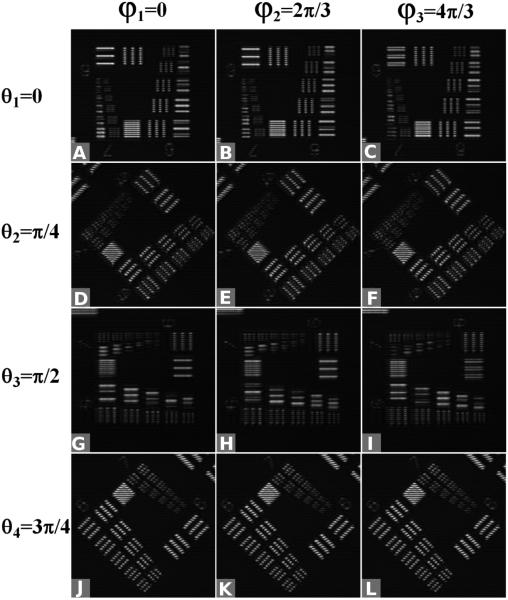
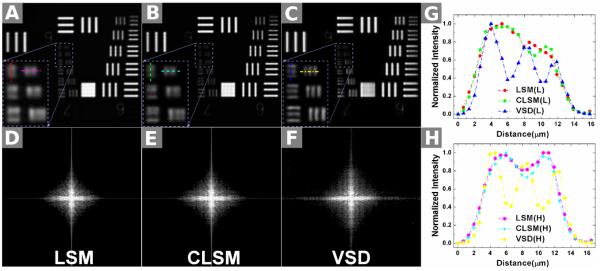
A standard-resolution target (USAF 1951 1X; Edmond) was used to verify resolution enhancement of the VSD-based super-resolution LSM system. Figure 14 shows the obtained moiré patterns. A set of 4 orientations (θ1 = 0, θ2 = π/4, θ3 = π/2, and θ4 = 3π/4) of the digital sinusoidal modulation patterns were applied. With a given orientation, phase shifts (φ1 = 0, φ2 = 2π/3, and φ3 = 4π/3) were assigned. Figure 15 shows the comparison between conventional LSM, confocal LSM (CLSM), and VSD-based super-resolution LSM. The smallest grid period was 4.4 μm. A 5× objective with 0.1 NA was used for this experiment. Conventional LSM, which has a theoretical resolution of 5 μm, was not able to differentiate these 4.4-μm grids, as shown in Fig. 15A. CLSM could barely differentiate them, as shown in Fig. 15B. By contrast, the smallest grid could be resolved clearly in both the longitudinal and horizontal directions after VSD reconstruction, as shown in Fig. 15B. The resolution enhancement was further confirmed by intensity profiles, as shown in Fig 15G and H. Three bumps were observed after VSD reconstruction; these were the intensity profiles along the horizontal and longitudinal directions, as shown in Fig. 15A–C. By contrast, the details were not differentiated by LSM and CLSM. The corresponding results in Fourier space (shown in Fig. 15D–F) also demonstrated that more spectrum information was retained with VSD reconstruction and there was higher super-resolution than with both conventional LSM and CLSM.
FIG. 14.
Implementation of virtually structured detection–based super-resolution imaging on a standard-resolution target. A set of 4 orientations of the digital sinusoidal modulation pattern were applied: θ1 = 0, θ2 = π/4, θ3 = π/2, and θ4 = 3π/4. With a given orientation, the phase shifts φ1 = 0, φ2 = 2π/3, and φ3 = 4π/3 were assigned. (A–K) show the obtained Moiré patterns.
FIG. 15.
Comparison of 3 different imaging results using the USAF standard-resolution target: by conventional line-scanning microscopy (LSM) (A); by confocal LSM (CLSM) (B); and by reconstruction using virtually structured detection (VSD) (C). The magnified views of the smallest bars are indicated by the rectangles in (A–C). (D–F) The corresponding results of (A–C), respectively, in the Fourier domain. (G): Normalized intensity profiles along the longitudinal direction in (A–C). (H) Normalized intensity profiles along the horizontal direction in (A–C). (From Ref. 88. Reprinted with permission from the Optical Society (OSA).)
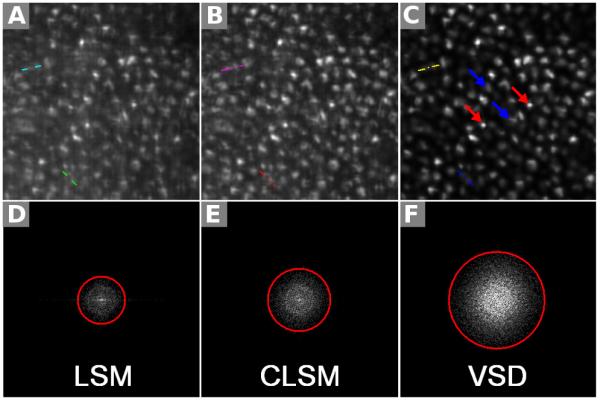
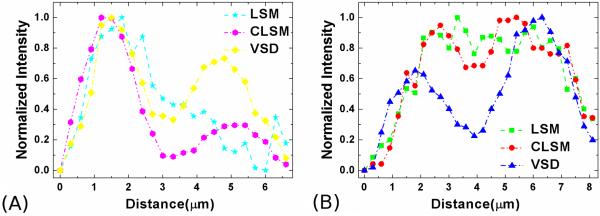
A freshly isolated frog (Rana pipiens) eyecup was also used for functional validation of the super-resolution LSM based on VSD. The lens and anterior structures were removed before the eyecup was moved into the chamber with Ringer’s solution for imaging. A 10× water immersion objective (NA = 0.25) was used in this experiment. Figure 16(a) shows a retinal image acquired with conventional LSM. Figure 16(b) shows an image acquired with CLSM. Figure 16(c) shows a super-resolution result through VSD reconstruction. The 2 selected groups of normalized intensity profiles of the adjacent photoreceptor pairs in Fig. 16A–C are plotted in Fig. 17A and B, respectively. Both results showed that VSD reconstruction provides much-improved lateral resolution over conventional LSM and CLSM. The corresponding results in the Fourier domain are shown in Fig. 16D–F, respectively. Compared with conventional LSM (Fig. 16D), CLSM (Fig. 16E) can yield improved resolution by a factor of 1.3, whereas VSD reconstruction, as shown in Fig. 16F, contains more information and can yield improved resolution by a factor of 2. Given the improved resolution, bright subcellular spots (red arrowheads) were observed in Fig. 16C. Rods (blue arrowheads) and cones (red arrowheads) can be directly differentiated. The rod photoreceptors had relatively homogenous reflectivity at the cellular level. The distinct bright subcellular spots were typically observed in cone photoreceptors, which reflect hyperreflectivity at a subcellular level (e.g., photoreceptor-connecting cilium) and have been observed in 2-photon excited autofluorescence images.97
FIG. 16.
Comparison of 3 different imaging results using a living frog eye cup: by conventional line-scanning microscopy (LSM) (A), by confocal LSM (B), and by reconstruction using virtually structured detection (VSD) (C). The selected field of view was 80 μm × 80 μm. The corresponding results in the Fourier domain are shown, respectively, in (D–F). The measured frequency cutoff boundaries of the functions are delineated with red circles. The colored lines in (A–C) correspond to the plotted points in Fig. 17. (From Ref. 88. Reprinted with permission from the Optical Society (OSA).)
FIG. 17.
(A) The normalized intensity profiles of the selected adjacent photoreceptors (along upper lines) in Fig. 16A, B, and C are plotted. (B) The normalized intensity profiles of the selected adjacent photoreceptors (along lower lines) in Fig. 16A, B, and C are plotted. CLSM, confocal line-scanning microscopy; LSM, line-scanning microscopy; VSD, virtually structured detection. (From Ref. 88. Reprinted with permission from the Optical Society (OSA).)
IV. CHALLENGES AND POTENTIAL OF USING VSD-BASED METHODS FOR SUPER-RESOLUTION OPHTHALMOSCOPY
In summary, STED, PALM, and STORM can break the diffraction limit to provide super-resolution microcopy. However, the high laser power required for super-resolution imaging limits their application for retinal imaging of living animals or humans. Moreover, all of these methods require fluorescence labeling, which exclude them from application for imaging intrinsic light signals. SIM can be applied to both fluorescence and intrinsic signal imaging. However, direct application of SIM to moving objects, such as the retina with eye movements, is challenging. VSD-based super-resolution imaging has 2 technical merits over conventional SIM. First, VSD-based super-resolution imaging is free from precise phase premodulation with sophisticated modulation of the pattern generator. In conventional SIM systems dynamic phase modulation of structured illumination is necessary for super-resolution reconstruction. Therefore precise phase premodulation of illumination patterns is necessary, which makes conventional SIM vulnerable to phase modulation artifacts.98,99 This predefined pattern is particularly challenging for moving samples, such as eyes. By contrast, VSD-based super-resolution imaging applies virtually digital phase modulation and allows precise compensation for eye movements through image registration before implementing super-resolution reconstruction. Second, VSD-based super-resolution imaging provides improved sectioning ability. In conventional wide-field SIM, only modulation with a positive magnitude on the illumination is allowed. Zero spatial frequency does not attenuate with defocusing in a wide-field illumination system. The DC component may become dominant and overwhelm the second and third items that contain super-resolution information in a complex structure, especially in thick tissues. Thus it has been challenging to conduct wide-field SIM in deep (>100 μm) tissues. The axial resolution is compromised in conventional line-scanning SIM,. In VSD-based super-resolution imaging, the weight factors can take any value, so the digital modulation patterns can be a single sinusoid wave without the DC offset. By contrast, VSD-based super-resolution imaging can provide improved sectioning capability as a result of attenuated zero spatial frequency signals correlated with out-of-focus volumes.
Our preliminary results indicate that VSD can provide an easy, low-cost, and phase artifact–free strategy to achieve super-resolution in SLM. Both super-resolution point-scanning microscopy and LSM based on VSD have been validated. While the point-scanning system provided a frame speed of 0.025 fps with a frame resolution of 200 × 200 pixels, the line-scanning system increases the speed to 0.33 fps with a frame resolution of 400 × 400 pixels, which is equivalent to 1.32 Hz with a frame resolution of 200 × 200 pixels. For in vivo applications, further improvement of the frame speed is necessary. We are currently pursuing a microlens array scanning system that can provide simultaneous multifocal illumination (10 × 10 focus). Using a high complementary metal-oxide semiconductor camera (PCO Dimax S4), a maximum frame speed of 50 fps has been demonstrated. VSD-based super-resolution microscopy, which requires neither dynamic modulation of the light source intensity in the illumination arm nor a physical mask in the light detection arm, has excellent potential for in vivo imaging of the retina with subcellular resolution. The in vivo super-resolution imaging of frog photoreceptors using high-speed laser LSM through VSD has been recently achieved by our group. The field of view is about 313 × 293 μm and the final imaging speed is 149 fps. Major challenges for in vivo imaging of human photoreceptors include the effects of optical aberration100 and retina movements on image resolution. In the future, adaptive optics101,102 can be integrated to correct for optical aberration of the ocular optics of the human eye. High-speed scanning, high-speed retinal tracking,103 accurate postrecording image registration,94 and postprocessing algorithms104 can be readily added for accurate correction of intraframe blur caused by retina movement. We expect that further development of VSD-based super-resolution imaging will lead to the advanced study and diagnosis of morphological distortions caused by eye diseases. Improved imaging resolution can also benefit the optical detection of retinal physiology. Stimulus-evoked intrinsic optical signal changes have been detected in both animal105–114 and human115–118 retinas. Recent studies indicate that a high resolution is essential to provide a high signal-to-noise in functional intrinsic optical signal imaging of retinal physiology.119–121 Moreover, transient retinal phototropism has been observed in isolated retinas. The development of super-resolution ophthalmic instruments will allow in vivo study of the transient retinal phototropism, which not only may lead to a better understanding of the nature of the vision system but also may produce a new biomarker for the early detection of eye diseases such as age-related macular degeneration that produce retinal photoreceptor dysfunction.
ACKNOWLEDGMENTS
This research was supported in part by the National Institutes of Health (grant nos. R01 EY023522, R01 EY024628, and P30 EY001792) and the National Science Foundation (Chemical, Bioengineering, Environmental, and Transport System [CBET] grant no. 1055889).
REFERENCES
- 1.Abbe E. Beiträge zur Theorie des Mikroskops und der mikroskopischen Wahrnehmung. Arch Mikroskop Anat. 1873;9:413–8. [Google Scholar]
- 2.von Helmholtz H. Die theoretische grenze für die leistungsfähigkeit der mikroskope,”. Annalen der Physik und Chemie. 1874;6:557–584. [Google Scholar]
- 3.Stephenson JW. Observations on professor Abbe’s experiments illustrating his theory of microscopic vision. Month Microsc J. 1877;17:82–8. [Google Scholar]
- 4.Huang B, Babcock H, Zhuang X. Breaking the diffraction barrier: super-resolution imaging of cells. Cell. 2010;143:1047–58. doi: 10.1016/j.cell.2010.12.002. [DOI] [PMC free article] [PubMed] [Google Scholar]
- 5.Schermelleh L, Heintzmann R, Leonhardt H. A guide to super-resolution fluorescence microscopy. J Cell Biol. 2010;190:165–75. doi: 10.1083/jcb.201002018. [DOI] [PMC free article] [PubMed] [Google Scholar]
- 6.Heintzmann R, Ficz G. Breaking the resolution limit in light microscopy. Brief Funct Genomics. 2006;5(4):289–301. doi: 10.1093/bfgp/ell036. [DOI] [PubMed] [Google Scholar]
- 7.Haas BL, Matson JS, DiRita VJ, Biteen JS. Imaging live cells at the nanometer-scale with single-molecule microscopy: obstacles and achievements in experiment optimization for microbiology. Molecules. 2014;19:12116–49. doi: 10.3390/molecules190812116. [DOI] [PMC free article] [PubMed] [Google Scholar]
- 8.Lindberg J. Mathematical concepts of optical superresolution. J Opt. 2012;14:083001. [Google Scholar]
- 9.Sengupta P, van Engelenburg SB, Lippincott-Schwartz J. Superresolution imaging of biological systems using photoactivated localization microscopy. Chem Rev. 2014;114:3189–202. doi: 10.1021/cr400614m. [DOI] [PMC free article] [PubMed] [Google Scholar]
- 10.Godin AG, Lounis B, Cognet L. Super-resolution microscopy approaches for live cell imaging. Biophys J. 2014;107(8):1777–84. doi: 10.1016/j.bpj.2014.08.028. [DOI] [PMC free article] [PubMed] [Google Scholar]
- 11.Patterson G, Davidson M, Manley S, Lippincott-Schwartz J. Superresolution imaging using single-molecule localization. Annu Rev Phys Chem. 2010;61:345–67. doi: 10.1146/annurev.physchem.012809.103444. [DOI] [PMC free article] [PubMed] [Google Scholar]
- 12.Stemmer A, Beck M, Fiolka R. Widefield fluorescence microscopy with extended resolution. Histochem Cell Biol. 2008;130:807–17. doi: 10.1007/s00418-008-0506-8. [DOI] [PubMed] [Google Scholar]
- 13.Elsner AE, Miura M, Burns SA, Beausencourt E, Kunze C, Kelley LM, Walker JP, Wing GL, Raskauskas PA, Fletcher DC, Zhou Q, Dreher AW. Multiply scattered light tomography and confocal imaging: detecting neovascularization in age-related macular degeneration. Opt Express. 2000;7(2):95–106. doi: 10.1364/oe.7.000095. [DOI] [PubMed] [Google Scholar]
- 14.Rawlinson AA, Cucevic V, Nugent KA, Brooks AM, Klein AG. Confocal laser scanning ophthalmoscope and spherical harmonics used as a possible aid to detect glaucoma. J Opt Soc Am A Opt Image Sci Vis. 2000;17(3):477–83. doi: 10.1364/josaa.17.000477. [DOI] [PubMed] [Google Scholar]
- 15.Webb RH, Hughes GW. Scanning laser ophthalmoscope. IEEE Trans Biomed Eng. 1981;28:488–92. doi: 10.1109/TBME.1981.324734. [DOI] [PubMed] [Google Scholar]
- 16.Webb RH, Hughes GW, Delori FC. Confocal scanning laser ophthalmoscope. Appl Opt. 1987;26(8):1492–9. doi: 10.1364/AO.26.001492. [DOI] [PubMed] [Google Scholar]
- 17.Roorda A, Williams DR. The arrangement of the three cone classes in the living human eye. Nature. 1999;397:520–2. doi: 10.1038/17383. [DOI] [PubMed] [Google Scholar]
- 18.Roorda A, Romero-Borja F, Donnelly WJ, III, Queener H, Hebert TJ, Campbell MCW. Adaptive optics scanning laser ophthalmoscopy. Opt Express. 2002;10(9):405–12. doi: 10.1364/oe.10.000405. [DOI] [PubMed] [Google Scholar]
- 19.Felberer F, Kroisamer JS, Hitzenberger CK, Pircher M. Lens based adaptive optics scanning laser ophthalmoscope. Opt Express. 2012;20(16):17297–310. doi: 10.1364/OE.20.017297. [DOI] [PubMed] [Google Scholar]
- 20.Scoles DH, Sulai YN, Langlo C, Fishman GA, Curcio CA, Carroll J, Dubra A. In vivo imaging of human cone photoreceptor inner segments. Invest Ophthalmol Vis Sci. 2014;55:4244–51. doi: 10.1167/iovs.14-14542. [DOI] [PMC free article] [PubMed] [Google Scholar]
- 21.Williams DR. Imaging single cells in the living retina. Vision Res. 2011;51(13):1379–96. doi: 10.1016/j.visres.2011.05.002. [DOI] [PMC free article] [PubMed] [Google Scholar]
- 22.Sheppard CJ, Wilson T. The theory of the direct-view confocal microscope. J Microsc. 1981;124:107–17. doi: 10.1111/j.1365-2818.1981.tb00304.x. [DOI] [PubMed] [Google Scholar]
- 23.Brakenhoff GJ, van der Voort HT, van Spronsen EA, Linnemans WA, Nanninga N. Three-dimensional chromatin distribution in neuro-blastoma nuclei shown by confocal scanning laser microscopy. Nature. 1985;317:748–9. doi: 10.1038/317748a0. [DOI] [PubMed] [Google Scholar]
- 24.Gu M. Principles of three-dimensional imaging in confocal microscopes. World Scientific; Singapore: 2013. [Google Scholar]
- 25.Sheppard CJ. Super-resolution in confocal imaging. Optik. 1988;2:53–4. [Google Scholar]
- 26.Wilson T. Resolution and optical sectioning in the confocal microscope. J Microsc. 2011;244(2):113–21. doi: 10.1111/j.1365-2818.2011.03549.x. [DOI] [PubMed] [Google Scholar]
- 27.De Luca GM, Breedijk RM, Brandt RA, Zeelenberg CH, de Jong BE, Timmermans W, Azar LN, Hoebe RA, Stallinga S, Manders EM. Re-scan confocal microscopy: scanning twice for better resolution. Biomed Opt Express. 2013;4(11):2644–56. doi: 10.1364/BOE.4.002644. [DOI] [PMC free article] [PubMed] [Google Scholar]
- 28.Azuma T, Kei T. Super-resolution spinning-disk confocal microscopy using optical photon reassignment. Opt Express. 2015;23(11):15003–11. doi: 10.1364/OE.23.015003. [DOI] [PubMed] [Google Scholar]
- 29.Hayashi S, Okada Y. Ultrafast superresolution fluorescence imaging with spinning disk confocal microscope optics. Mol Biol Cell. 2015;26(9):1743–51. doi: 10.1091/mbc.E14-08-1287. [DOI] [PMC free article] [PubMed] [Google Scholar]
- 30.Carlsson K, Danielsson PE, Lenz R, Liljeborg A, Majlöf L, Åslund N. Three-dimensional microscopy using a confocal laser scanning microscope. Opt Lett. 1985;10(2):53–5. doi: 10.1364/ol.10.000053. [DOI] [PubMed] [Google Scholar]
- 31.Sheppard CJ, Campos J, Escalera JC, Ledesma S. Three-zone pupil filters. Opt Commun. 2008;281:3623–30. [Google Scholar]
- 32.Lu J, Li H, He Y, Shi GH, Zhang YD. Super-resolution in adaptive optics confocal scanning laser ophthalmoscope. Acta Phys Sin. 2011;60(3):034207. [Google Scholar]
- 33.Ma Y, Kuang C, Gong W, Xue L, Zheng Y, Wang Y, Si K, Liu X. Improvements of axial resolution in confocal microscopy with fan-shaped apertures. Appl Opt. 2015;54:1354–62. doi: 10.1364/AO.54.001354. [DOI] [PubMed] [Google Scholar]
- 34.Hell SW, Wichman J. Breaking the diffraction resolution limit by stimulated emission: stimulated-emission-depletion-microscopy. Opt Lett. 1994;19:780–2. doi: 10.1364/ol.19.000780. [DOI] [PubMed] [Google Scholar]
- 35.Hell SW, Kroug M. Ground-state depletion fluorescence microscopy, a concept for breaking the diffraction resolution limit. Appl Phys B. 1995;60:495–7. [Google Scholar]
- 36.Klar TA, Hell SW. Subdiffraction resolution in far-field fluorescence microscopy. Opt Lett. 1999;24:954–6. doi: 10.1364/ol.24.000954. [DOI] [PubMed] [Google Scholar]
- 37.Klar TA, Jakobs S, Dyba M, Egner A, Hell SW. Fluorescence microscopy with diffraction resolution barrier broken by stimulated emission. Proc Natl Acad Sci U S A. 2000;97:8206–10. doi: 10.1073/pnas.97.15.8206. [DOI] [PMC free article] [PubMed] [Google Scholar]
- 38.Hell SW. Toward fluorescence nanoscopy. Nat Biotechnol. 2003;21:1347–55. doi: 10.1038/nbt895. [DOI] [PubMed] [Google Scholar]
- 39.Hell SW, Dyba M, Jakobs S. Concepts for nanoscale resolution in fluorescence microscopy. Curr Opin Neurobiol. 2004;14:599–609. doi: 10.1016/j.conb.2004.08.015. [DOI] [PubMed] [Google Scholar]
- 40.Westphal V, Kastrup L, Hell SW. Lateral resolution of 28 nm (lambda/25) in far-field fluorescence microscopy. Appl Phys B. 2003;77:377–80. [Google Scholar]
- 41.Harke B, Keller Jan, Ullal CK, Westphal V, Schönle A, Hell SW. Resolution scaling in STED microscopy. Opt Express. 2008;16(6):4154–62. doi: 10.1364/oe.16.004154. [DOI] [PubMed] [Google Scholar]
- 42.Rittweger E, Han Kyu Young, Irvine SE, Eggeling C, Hell SW. STED microscopy reveals crystal colour centres with nanometric resolution. Nat Photonics. 2009;3:144–7. [Google Scholar]
- 43.Wildanger D, Patton BR, Schill H, Marseglia L, Hadden JP, Knauer S, Schönle A, Rarity JG, O’Brien JL, Hell SW, Smith JM. Solid immersion facilitates fluorescence microscopy with nanometer resolution and sub-Ångström emitter localization. Adv Mater. 2012;24(44):OP309–13. doi: 10.1002/adma.201203033. [DOI] [PMC free article] [PubMed] [Google Scholar]
- 44.Westphal V, Rizzoli SO, Lauterbach MA, Kamin D, Jahn R, Hell SW. Video-rate far-field optical nanoscopy dissects synaptic vesicle movement. Science. 2008;320(5873):246–9. doi: 10.1126/science.1154228. [DOI] [PubMed] [Google Scholar]
- 45.Dyba M, Jakobs S, Hell SW. Immunofluorescence stimulated emission depletion microscopy. Nat Biotechnol. 2003;21(11):1303–4. doi: 10.1038/nbt897. [DOI] [PubMed] [Google Scholar]
- 46.Betzig E, Patterson GH, Sougrat R, Lindwasser OW, Olenych S, Bonifacino JS, Davidson MW, Lippincott-Schwartz J, Hess HF. Imaging intracellular fluorescent proteins at nanometer resolution. Science. 2006;313:1642–5. doi: 10.1126/science.1127344. [DOI] [PubMed] [Google Scholar]
- 47.Shroff H, Galbraith CG, Galbraith JA, White H, Gillette J, Olenych S, Davidson MW, Betzig E. Dual-color superresolution imaging of genetically expressed probes within individual adhesion complexes. Proc Natl Acad Sci U S A. 2007;104(51):20308–13. doi: 10.1073/pnas.0710517105. [DOI] [PMC free article] [PubMed] [Google Scholar]
- 48.Shroff H, Galbraith CG, Galbraith JA, Betzig E. Live-cell photoactivated localization microscopy of nanoscale adhesion dynamics. Nat Methods. 2008;5(5):417–23. doi: 10.1038/nmeth.1202. [DOI] [PMC free article] [PubMed] [Google Scholar]
- 49.Juette MF, Gould TJ, Lessard MD, Mlodzianoski MJ, Nagpure BS, Bennett BT, Hess ST, Bewersdorf J. Three-dimensional sub-100 nm resolution fluorescence microscopy of thick samples. Nat Methods. 2008;5:527–9. doi: 10.1038/nmeth.1211. [DOI] [PubMed] [Google Scholar]
- 50.Rust MJ, Bates M, Zhuang X. Sub-diffraction-limit imaging by stochastic optical reconstruction microscopy. Nat Methods. 2006;3:793–5. doi: 10.1038/nmeth929. [DOI] [PMC free article] [PubMed] [Google Scholar]
- 51.Zhuang X. Nano-imaging with Storm. Nat Photonics. 2009;3:365–7. doi: 10.1038/nphoton.2009.101. [DOI] [PMC free article] [PubMed] [Google Scholar]
- 52.Bates M, Huang B, Dempsey GT, Zhuang X. Multicolor super-resolution imaging with photo-switchable fluorescent probes. Science. 2007;317(5845):1749–53. doi: 10.1126/science.1146598. [DOI] [PMC free article] [PubMed] [Google Scholar]
- 53.Crossman DJ, Hou Y, Jayasinghe I, Baddeley D, Soeller C. Combining confocal and single molecule localisation microscopy: a correlative approach to multi-scale tissue imaging. Methods. 2015;88:98–108. doi: 10.1016/j.ymeth.2015.03.011. [DOI] [PubMed] [Google Scholar]
- 54.Huang B, Wang W, Bates M, Zhuang X. Three-dimensional super-resolution imaging by stochastic optical reconstruction microscopy. Science. 2008;319(5864):810–3. doi: 10.1126/science.1153529. [DOI] [PMC free article] [PubMed] [Google Scholar]
- 55.Huang B, Jones SA, Brandenburg B, Zhuang X. Whole-cell 3D storm reveals interactions between cellular structures with nanometer-scale resolution. Nat Methods. 2008;5:1047–52. doi: 10.1038/nmeth.1274. [DOI] [PMC free article] [PubMed] [Google Scholar]
- 56.Xu J, Tehrani KF, Kner P. Multicolor 3D super-resolution imaging by quantum dot stochastic optical reconstruction microscopy. ACS Nano. 2015;9(3):2917–25. doi: 10.1021/nn506952g. [DOI] [PubMed] [Google Scholar]
- 57.Jones SA, Shim SH, He J, Zhuang X. Fast, three-dimensional super-resolution imaging of live cells. Nat Methods. 2011;8:499–505. doi: 10.1038/nmeth.1605. [DOI] [PMC free article] [PubMed] [Google Scholar]
- 58.Yamanaka M, Smith NI, Fujita K. Introduction to super-resolution microscopy. Microscopy. 2014;63(3):177–92. doi: 10.1093/jmicro/dfu007. [DOI] [PubMed] [Google Scholar]
- 59.Gustafsson MG. Surpassing the lateral resolution limit by a factor of two using structured illumination microscopy. J Microsc. 2000;198:82–7. doi: 10.1046/j.1365-2818.2000.00710.x. [DOI] [PubMed] [Google Scholar]
- 60.Mudry E, Belkebir K, Girard J, Savatier J, ELe Moal, Nicoletti C, Allain M, Sentenac A. Structured illumination microscopy using unknown speckle patterns. Nat Photonics. 2012;6:312–5. [Google Scholar]
- 61.Gustafsson MG. Nonlinear structured-illumination microscopy: wide-field fluorescence imaging with theoretically unlimited resolution. Proc Natl Acad Sci U S A. 2005;102:13081–6. doi: 10.1073/pnas.0406877102. [DOI] [PMC free article] [PubMed] [Google Scholar]
- 62.Zhang H, Zhao M, Peng L. Nonlinear structured illumination microscopy by surface plasmon enhanced stimulated emission depletion. Opt Express. 2011;19(24):24783–94. doi: 10.1364/OE.19.024783. [DOI] [PMC free article] [PubMed] [Google Scholar]
- 63.Rodríguez AD, Clemente P, Irles E, Tajahuerce E, Lancis J. Resolution analysis in computational imaging with patterned illumination and bucket detection. Opt Lett. 2014;39(13):3888–91. doi: 10.1364/OL.39.003888. [DOI] [PubMed] [Google Scholar]
- 64.Righolt HC, Slotman JA, Young IT, Mai S, van Vliet LJ, Stallinga S. Image filtering in structured illumination microscopy using the Lukosz bound. Opt Express. 2013;21(21):24431–51. doi: 10.1364/OE.21.024431. [DOI] [PubMed] [Google Scholar]
- 65.Jost A, Heintzmann R. Super-resolution multidimensional imaging with structured illumination microscopy. Annu Rev Mater Res. 2013;43:261–82. [Google Scholar]
- 66.Gustafsson MG, Shao L, Carlton PM, Wang CJ, Golubovskaya IN, Cande WZ, Agard DA, Sedat JW. Three-dimensional resolution doubling in wide-field fluorescence microscopy by structured illumination. Biophys J. 2008;94(12):4957–70. doi: 10.1529/biophysj.107.120345. [DOI] [PMC free article] [PubMed] [Google Scholar]
- 67.Shao L, Isaac B, Uzawa S, Agard DA, Sedat JW, Gustafsson MG. I5S: wide-field light microscopy with 100-nm-scale resolution in three dimensions. Biophys J. 2008;94(12):4971–83. doi: 10.1529/biophysj.107.120352. [DOI] [PMC free article] [PubMed] [Google Scholar]
- 68.O’Holleran K, Shaw M. Optimized approaches for optical sectioning and resolution enhancement in 2D structured illumination microscopy. Biomed Opt Express. 2014;5(8):2580–90. doi: 10.1364/BOE.5.002580. [DOI] [PMC free article] [PubMed] [Google Scholar]
- 69.Jost A, Tolstik E, Feldmann P, Wicker K, Sentenac A, Heintzmann R. Optical sectioning and high resolution in single-slice structured illumination microscopy by thick slice blind-sim reconstruction. PLoS One. 2015;10(7):e0132174. doi: 10.1371/journal.pone.0132174. [DOI] [PMC free article] [PubMed] [Google Scholar]
- 70.Karadaglic D, Wilson T. Image formation in structured illumination wide-field fluorescence microscopy. Micron. 2008;39:808–18. doi: 10.1016/j.micron.2008.01.017. [DOI] [PubMed] [Google Scholar]
- 71.Chang BJ, Chou LJ, Chang YC, Chiang SY. Isotropic image in structured illumination microscopy patterned with a spatial light modulator. Opt Express. 2009;17(17):14710–21. doi: 10.1364/oe.17.014710. [DOI] [PubMed] [Google Scholar]
- 72.Kner P, Chhun BB, Griffis ER, Winoto L, Gustafsson MG. Super-resolution video microscopy of live cells by structured illumination. Nat Methods. 2009;6(5):339–42. doi: 10.1038/nmeth.1324. [DOI] [PMC free article] [PubMed] [Google Scholar]
- 73.Förster R, Lu-Walther H, Jost A, Kielhorn M, Kai W, Heintzmann R. Simple structured illumination microscope setup with high acquisition speed by using a spatial light modulator. Opt Express. 2014;22(17):20663–77. doi: 10.1364/OE.22.020663. [DOI] [PubMed] [Google Scholar]
- 74.Lu-Walther H, Kielhorn M, Förster R, Jost A, Kai W, Heintzmann R. FastSIM: a practical implementation of fast structured illumination microscopy. Methods Appl Fluoresc. 2015;3:014001. doi: 10.1088/2050-6120/3/1/014001. [DOI] [PubMed] [Google Scholar]
- 75.Shao L, Kner P, Rego EH, Gustafsson MG. Super-resolution 3D microscopy of live whole cells using structured illumination. Nat Methods. 2011;1734(5):1–5. doi: 10.1038/nmeth.1734. [DOI] [PubMed] [Google Scholar]
- 76.Křížek P, Raška I, Hagen GM. Flexible structured illumination microscope with a programmable illumination array. Opt Express. 2012;20(22):24585–99. doi: 10.1364/OE.20.024585. [DOI] [PubMed] [Google Scholar]
- 77.Dan D, Lei M, Yao B, Wang W, Winterhalder M, Zumbusch AN, Qi Y, Xia L, Yan S, Yang Y, Gao P, Ye T, Zhao W. DMD-based LED-illumination super-resolution and optical sectioning microscopy. Sci Rep. 2013;3:1116. doi: 10.1038/srep01116. [DOI] [PMC free article] [PubMed] [Google Scholar]
- 78.York AG, Chandris P, Nogare DD, Head J, Wawrzusin P, Fischer RS, Chitnis A, Shroff H. Instant super-resolution imaging in live cells and embryos via analog image processing. Nat Methods. 2013;10(11):1122–6. doi: 10.1038/nmeth.2687. [DOI] [PMC free article] [PubMed] [Google Scholar]
- 79.Shawa M, Zajiczeka L, O’Holleranb K. High speed structured illumination microscopy in optically thick samples. Methods. 2015;88:11–9. doi: 10.1016/j.ymeth.2015.03.020. [DOI] [PubMed] [Google Scholar]
- 80.Kim T, Gweon D, Lee JH. Enhancement of fluorescence confocal scanning microscopy lateral resolution by use of structured illumination. Meas Sci Technol. 2009;20:055501–9. [Google Scholar]
- 81.Mandula O, Kielhorn M, Wicker K, Krampert G, Kleppe I, Heintzmann R. Line scan–structured illumination microscopy super-resolution imaging in thick fluorescent samples. Opt Express. 2012;20:24167–74. doi: 10.1364/OE.20.024167. [DOI] [PubMed] [Google Scholar]
- 82.Ahn M, Kim T, Kim Y, Gweon D, Lee JH. Cross structured illumination for high speed high resolution line scanning confocal microscopy. Meas Sci Technol. 2011;22:015503. [Google Scholar]
- 83.Planchon TA, Gao L, Milkie DE, Davidson MW, Galbraith JA, Galbraith CG, Betzig E. Rapid three-dimensional isotropic imaging of living cells using Bessel beam plane illumination. Nat Methods. 2011;8:417–23. doi: 10.1038/nmeth.1586. [DOI] [PMC free article] [PubMed] [Google Scholar]
- 84.Lu J, Min W, Conchello JA, Xie XS, Lichtman JW. Super-resolution laser scanning microscopy through spatiotemporal modulation. Nano Lett. 2009;9:3883–9. doi: 10.1021/nl902087d. [DOI] [PMC free article] [PubMed] [Google Scholar]
- 85.Yeh CH, Chen SY. Resolution enhancement of two-photon microscopy via intensity-modulated laser scanning structured illumination. Appl Opt. 2015;54(9):2309–17. doi: 10.1364/AO.54.002309. [DOI] [PubMed] [Google Scholar]
- 86.Lu RW, Wang BQ, Zhang QX, Yao XC. Super-resolution scanning laser microscopy through virtually structured detection. Biomed Opt Express. 2013;4:1673–82. doi: 10.1364/BOE.4.001673. [DOI] [PMC free article] [PubMed] [Google Scholar]
- 87.Wang B, Lu R, Zhang Q, Yao X. Breaking diffraction limit of lateral resolution in optical coherence tomography. Quant Imaging Med Surg. 2013;3:243–8. doi: 10.3978/j.issn.2223-4292.2013.10.03. [DOI] [PMC free article] [PubMed] [Google Scholar]
- 88.Zhi Y, Lu R, Wang B, Zhang Q, Yao X. Rapid super-resolution line-scanning microscopy through virtually structured detection. Opt Lett. 2015;40(8):1683–6. doi: 10.1364/OL.40.001683. [DOI] [PMC free article] [PubMed] [Google Scholar]
- 89.Laporte G, Stasio N, Sheppard CJ, Psaltis D. Resolution enhancement in nonlinear scanning microscopy through post-detection digital computation. Optica. 2014;1(6):455–60. PJ. [Google Scholar]
- 90.Bertero M, Boccacci P. Super-resolution in computational imaging. Micron. 2003;34:265–73. doi: 10.1016/s0968-4328(03)00051-9. [DOI] [PubMed] [Google Scholar]
- 91.Nilsson SE. An electron microscopic classification of the retinal receptors of the leopard frog (Rana pipiens) J Ultrastruct Res. 1964;10:390–416. doi: 10.1016/s0022-5320(64)80018-6. [DOI] [PubMed] [Google Scholar]
- 92.Huang D, Swanson EA, Lin CP, Schuman JS, Stinson WG, Chang W, Hee MR, Flotire T, Gregory K, Puliafito CA, Fujimoto JG. Optical coherence tomography. Science. 1991;254:1178–81. doi: 10.1126/science.1957169. [DOI] [PMC free article] [PubMed] [Google Scholar]
- 93.Fercher AF, Drexler W, Hitzenberger CK, Lasser T. Optical coherence tomography—principles and applications. Rep Prog Phys. 2003;66:239–303. [Google Scholar]
- 94.Zhang QX, Lu RW, Curcio CA, Yao XC. In vivo confocal intrinsic optical signal identification of localized retinal dysfunction. Invest Ophthalmol Vis Sci. 2012;53(13):8139–45. doi: 10.1167/iovs.12-10732. [DOI] [PMC free article] [PubMed] [Google Scholar]
- 95.Zhang QX, Lu RW, Li YG, Yao XC. In vivo confocal imaging of fast intrinsic optical signals correlated with frog retinal activation. Opt Lett. 2011;36:4692–4. doi: 10.1364/OL.36.004692. [DOI] [PMC free article] [PubMed] [Google Scholar]
- 96.Li YG, Liu L, Amthor F, Yao XC. High speed line-scan confocal imaging of stimulus-evoked intrinsic optical signals in the retina. Opt Lett. 2010;35:426–8. doi: 10.1364/OL.35.000426. [DOI] [PMC free article] [PubMed] [Google Scholar]
- 97.Lu RW, Li YC, Ye T, Strang C, Keyser K, Curcio C, Yao XC. Two-photon excited autofluorescence imaging of freshly isolated frog retinas. Biomed Opt Express. 2013;2:1494–503. doi: 10.1364/BOE.2.001494. [DOI] [PMC free article] [PubMed] [Google Scholar]
- 98.Shroff SA, Fienup JR, Williams DR. Lateral superresolution using a posteriori phase shift estimation for a moving object: experimental results. J Opt Soc Am A Opt Image Sci Vis. 2010;27(8):1770–82. doi: 10.1364/JOSAA.27.001770. [DOI] [PubMed] [Google Scholar]
- 99.Shroff SA, Fienup JR, Williams DR. Phase-shift estimation in sinusoidally illuminated images for lateral superresolution. J Opt Soc Am A Opt Image Sci Vis. 2009;26(2):413–24. doi: 10.1364/josaa.26.000413. [DOI] [PubMed] [Google Scholar]
- 100.Porter J, Guirao A, Cox IG, Williams DR. Monochromatic aberrations of the human eye in a large population. J Opt Soc Am A Opt Image Sci Vis. 2001;18:1793–803. doi: 10.1364/josaa.18.001793. [DOI] [PubMed] [Google Scholar]
- 101.Dreher AW, Bille JF, Weinreb RN. Active optical depth resolution improvement of the laser tomographic scanner. Appl Opt. 1989;28:804–8. doi: 10.1364/AO.28.000804. [DOI] [PubMed] [Google Scholar]
- 102.Booth M, Andrade D, Burke D, Patton B, Zurauskas M. Aberrations and adaptive optics in super-resolution microscopy. Microscopy. 2015;64(4):251–61. doi: 10.1093/jmicro/dfv033. [DOI] [PMC free article] [PubMed] [Google Scholar]
- 103.Hammer DX, Ferguson RD, Magill JC, White MA, Elsner AE, Webb RH. Compact scanning laser ophthalmoscope with high-speed retinal tracker. Appl Opt. 2003;42(22):4621–32. doi: 10.1364/ao.42.004621. [DOI] [PubMed] [Google Scholar]
- 104.Vogel CR, Arathorn DW, Roorda A, Parker A. Retinal motion estimation in adaptive optics scanning laser ophthalmoscopy. Opt Express. 2006;14(2):487–97. doi: 10.1364/opex.14.000487. [DOI] [PubMed] [Google Scholar]
- 105.Bizheva K, Pflug R, Hermann B, Povazay B, Sattmann H, Qiu P, Anger E, Reitsamer H, Popov S, Taylor JR, Unterhuber A, Ahnelt P, Drexler W. Optophysiology: depth-resolved probing of retinal physiology with functional ultrahigh-resolution optical coherence tomography. Proc Natl Acad Sci U S A. 2006;103:5066–71. doi: 10.1073/pnas.0506997103. [DOI] [PMC free article] [PubMed] [Google Scholar]
- 106.Yao XC, George JS. Dynamic neuroimaging of retinal light responses using fast intrinsic optical signals. Neuroimage. 2006;33:898–906. doi: 10.1016/j.neuroimage.2006.06.060. [DOI] [PubMed] [Google Scholar]
- 107.Yao XC, George JS. Near infrared imaging of fast intrinsic optical responses in visible light-activated amphibian retina. J Biomed Opt. 2006;11:064030. doi: 10.1117/1.2393155. [DOI] [PubMed] [Google Scholar]
- 108.Tsunoda K, Hanazono G, Inomata K, Kazato Y, Suzuki W, Tanifuji M. Origins of retinal intrinsic signals: a series of experiments on retinas of macaque monkeys. Jpn J Ophthalmol. 2009;53:297–314. doi: 10.1007/s10384-009-0686-3. [DOI] [PubMed] [Google Scholar]
- 109.Yao XC. Intrinsic optical signal imaging of retinal activation. Jpn J Ophthalmol. 2009;53:327–33. doi: 10.1007/s10384-009-0685-4. [DOI] [PubMed] [Google Scholar]
- 110.Li YC, Strang C, Amthor FR, Liu L, Li YG, Zhang QX, Keyser K, Yao XC. Parallel optical monitoring of visual signal propagation from the photoreceptors to the inner retina layers. Opt Lett. 2010;35:1810–2. doi: 10.1364/OL.35.001810. [DOI] [PMC free article] [PubMed] [Google Scholar]
- 111.Zhang QX, Wang JY, Liu L, Yao XC. Microlens array recording of localized retinal responses. Opt Lett. 2010;35:3838–40. doi: 10.1364/OL.35.003838. [DOI] [PMC free article] [PubMed] [Google Scholar]
- 112.Schallek JB, McLellan GJ, Viswanathan S, Ts’o DY. Retinal intrinsic optical signals in a cat model of primary congenital glaucoma. Invest Ophthalmol Vis Sci. 2012;53:1971–81. doi: 10.1167/iovs.11-8299. [DOI] [PMC free article] [PubMed] [Google Scholar]
- 113.Yao XC, Li YC. Functional imaging of retinal photoreceptors and inner neurons using stimulusevoked intrinsic optical signals. Methods Mol Biol. 2012;884:277–85. doi: 10.1007/978-1-61779-848-1_20. [DOI] [PMC free article] [PubMed] [Google Scholar]
- 114.Zhang QX, Zhang Y, Lu RW, Li YC, Pittler SJ, Kraft TW, Yao XC. Comparative intrinsic optical signal imaging of wild-type and mutant mouse retinas. Opt Express. 2012;20:7646–54. doi: 10.1364/OE.20.007646. [DOI] [PMC free article] [PubMed] [Google Scholar]
- 115.Abramoff MD, Kwon YH, Ts’o D, Soliz P, Zimmerman B, Pokorny J, Kardon R. Visual stimulus-induced changes in human near-infrared fundus reflectance. Invest Ophthalmol Vis Sci. 2006;47:715–21. doi: 10.1167/iovs.05-0008. [DOI] [PMC free article] [PubMed] [Google Scholar]
- 116.Jonnal RS, Rha J, Zhang Y, Cense B, Gao WH, Miller DT. In vivo functional imaging of human cone photoreceptors. Opt Express. 2007;15:16141–60. doi: 10.1364/OE.15.016141. [DOI] [PMC free article] [PubMed] [Google Scholar]
- 117.Grieve K, Roorda A. Intrinsic signals from human cone photoreceptors. Invest Ophthalmol Vis Sci. 2008;49:713–9. doi: 10.1167/iovs.07-0837. [DOI] [PubMed] [Google Scholar]
- 118.Srinivasan VJ, Chen Y, Duker JS, Fujimoto JG. In vivo functional imaging of intrinsic scattering changes in the human retina with high-speed ultrahigh resolution OCT. Opt Express. 2009;17:3861–77. doi: 10.1364/oe.17.003861. [DOI] [PMC free article] [PubMed] [Google Scholar]
- 119.Wang B, Lu R, Zhang Q, Yao XC. Functional optical coherence tomography reveals transient phototropic change of photoreceptor outer segments. Opt Lett. 2014;39:6923–6. doi: 10.1364/OL.39.006923. [DOI] [PMC free article] [PubMed] [Google Scholar]
- 120.Zhang QX, Lu RW, Wang BQ, Messinger JD, Curcio CA, Yao X. Functional optical coherence tomography enables in vivo physiological assessment of retinal rod and cone photoreceptors. Sci Rep. 2015;5:9595. doi: 10.1038/srep09595. [DOI] [PMC free article] [PubMed] [Google Scholar]
- 121.Yao XC, Zhao YB. Optical dissection of stimulus-evoked retinal activation. Opt Express. 2008;16:12446–59. doi: 10.1364/oe.16.012446. [DOI] [PubMed] [Google Scholar]


