Abstract
Huntington’s disease (HD) is a neurodegenerative disease marked by an expanded polyglutamine (polyQ) tract on the huntingtin (HTT) protein that may cause transcriptional dysfunction. This study aimed to investigate the regulation and function of P-glycoprotein, an important efflux transporter, in brain capillaries in HD. The results showed that, compared with the littermate controls, R6/2 HD transgenic mice with the human mutant HTT gene had higher levels of P-glycoprotein mRNA and protein and enhanced NF-κB activity in their brain capillaries. Higher P-glycoprotein expression was also observed in the brain capillaries of human HD patients. Consistent with this enhanced P-glycoprotein expression, brain extracellular levels and brain-to-plasma ratios of the antipsychotic agents risperidone and paliperidone were significantly lower in R6/2 mice than in their littermate controls. Exogenous expression of human mutant HTT protein with expanded polyQ (mHTT-109Q) in HEK293T cells enhanced the levels of P-glycoprotein transcripts and NF-κB activity compared with cells expressing normal HTT-25Q. Treatment with the IKK inhibitor, BMS-345541, decreased P-glycoprotein mRNA level in cells transfected with mHTT-109Q or normal HTT-25Q. In conclusion, mutant HTT altered the expression of P-glycoprotein through the NF-κB pathway in brain capillaries in HD and markedly affected the availability of P-glycoprotein substrates in the brain.
Keywords: Blood–brain barrier, Huntington’s disease, P-glycoprotein, risperidone, paliperidone
Introduction
Huntington’s disease (HD) is an inherited neurodegenerative disorder characterized by chorea, dementia, and psychiatric symptoms. This disease is caused by the mutation of the huntingtin (HTT) gene that encodes an expanded polyglutamine (polyQ) tract on the HTT protein.1 In the brains of HD transgenic mice and human patients, the mutant HTT protein (mHTT) forms aggregates in the neurons, glial cells, and brain capillaries.2–4 HTT can interact with an array of proteins, including transcription factors and proteins involved in intracellular signaling, trafficking, endocytosis, or metabolism. The expanded polyQ tract in mHTT causes abnormal interactions with its target proteins, resulting in the pathological changes in HD.5,6
Nuclear factor-κB (NF-κB) is a transcription factor that regulates the expression of various genes. Activation of the NF-κB pathway alters the expression and activity of P-glycoprotein (P-gp; also known as MDR1 or ABCB1),7,8 an important efflux protein at the blood–brain barrier (BBB) that can significantly reduce the entry of its substrates to the brain. mHTT can activate IκB kinase (IKK), a key regulator of NF-κB, and increase NF-κB activity.9 Elevated NF-κB activity has been observed in the neurons and astrocytes of R6/2 HD transgenic mice3,9 and in the astrocytes of HD patients.3 However, whether NF-κB is also activated in brain capillaries in HD is not yet clear.
To date, the expression and function of P-gp have never been investigated at the BBB in HD. The current study aimed to measure the activity of NF-κB and the expression of P-gp in the brain capillaries of R6/2 transgenic mice that express human mHTT. P-gp expression was also examined in the brains of human HD patients. The role of mHTT in P-gp regulation was explored. Given that psychiatric symptoms are considered major features of HD,10,11 brain and plasma concentrations of risperidone and paliperidone, both of which are antipsychotic agents and P-gp substrates,12 were investigated in R6/2 mice.
Materials and methods
Animals
R6/2 (B6CBA-Tg(HDexon1)62Gpb/3 J) transgenic mice were originally obtained from Jackson Laboratory (Bar Harbor, ME, USA) and mated with female control mice (B6CBAFI/J). The offspring were verified by a polymerase chain reaction genotyping technique of genomic DNA extracted from tail tissues using the primers 5′-CCGCTCAGGTTCTGCTTTTA-3′ and 5′-GGCTGAGGAAGCTGAGGAG-3′ located in the transgene. The number of CAG repeats of the R6/2 mice used was 198 ± 2 (mean ± SEM). The mice were housed at the Institute of Biomedical Sciences Animal Care Facility at Academia Sinica (Taipei, Taiwan) or at the Animal Center for the College of Medicine at National Taiwan University under a 12-hour light/dark cycle. All of the animal experiments were performed under protocols approved by the Academia Sinica Institutional Animal Care and Utilization Committee and the National Taiwan University Institutional Laboratory Animal Care committee that met the requirements of the Animal Welfare Protection Act of the Department of Agriculture, Executive Yuan, Taiwan. All studies involving animals are reported in accordance with the ARRIVE (Animal Research Reporting in vivo Experiments) guidelines.
Reverse transcription-quantitative polymerase chain reaction (RT-qPCR)
To measure mRNA levels, tissue samples of the cerebral cortex, kidney, liver, and jejunum were collected from male and female R6/2 mice and the wild-type (WT) controls at 7 weeks and 12 weeks of age. Total RNA was isolated from each sample by the acid phenol-guanidinium-chloroform method using the TRIzol reagent (Invitrogen, CA, USA) according to the manufacturer’s instructions. The quality of the isolated RNA was verified by the ratio of 28 S and 18 S ribosomal RNA bands in 1% agarose gels. First-strand cDNA was synthesized from the total RNA (1000 ng) using an oligo(dT)12–18 primer and the GoScriptTM reverse transcription system (Promega, WI, USA) according to the manufacturer’s instruction. The cDNA (1 µL) was mixed with 7 µL of DEPC-treated sterile deionized distilled water, 10 µL of Power SYBR Green PCR Master Mix (Applied Biosystems, Warrington, UK) and forward and reverse primers at a final concentration of 0.5 µM each. The primer sequences were mouse Bcrp (breast cancer resistance protein; abcg2), forward 5′-AAATGGAGCACCTCAACCTG-3′ and reverse 5′-CCCATCACAACGTCATCTTG-3′; mouse P-gp, forward 5′-TCATTGCGATAGCTGGAG-3′ and reverse 5′-CAAACTTCTGCTCCCGAGTC-3′; mouse Mrp2 (multi-drug resistance protein 2; abcc2), forward 5′-TCTCTGGTTTGCCTGTTA-3′ and reverse 5′-GCAGAAGACAATCAGGTTT-3′; and glyceraldehyde-3-phosphate dehydrogenase (Gapdh), forward 5′-TGTGTCCGTCGTGGATCTGA-3′and reverse 5′-CACCACCTTCTTGATGTCATCATA-3′. Quantitative RT-PCR was performed in an ABI 7500 real-time PCR system (Applied Biosystems, Carlsbad, CA, USA) with a program consisting of denaturation at 95℃ for 10 min, followed by 40 amplification cycles of 95℃ for 15 s, 56℃ for 15 s, and 72℃ for 45 s. The relative quantity of target mRNA normalized to Gapdh mRNA was calculated by the comparative Ct (ΔCt) method. Both Ct and ΔCt values were determined using ABI 7500 Software (Life Technologies, CA, USA). ΔΔCt values were obtained by subtracting the mean ΔCt value of the WT controls from the individual ΔCt value of the same transporter. The relative amount was determined by the formula: 2−ΔΔCt.
Protein identification in isolated brain capillaries and the brain membrane fraction
Brain capillaries were isolated from female R6/2 mice and the WT littermates as previously described.13 The whole-brain membrane fraction lysates were prepared following the method described previously.14 The protein samples were stored at −80℃ until use, and the protein content was determined using the DC protein assay (Bio-Rad, CA, USA) with bovine serum albumin as the standard. For Western blotting, an aliquot of each protein sample was diluted with loading buffer containing sodium dodecylsulfate (SDS) and 2-mercaptoethanol. The proteins (15 µg/lane) were then separated by electrophoresis on an 8% SDS-polyacrylamide gel and transferred onto a nitrocellulose membrane (Hybond-C Extra, Amersham Biosciences, UK). Nonspecific binding to the membrane was blocked with 5% skim milk in TNT buffer (0.1 M Tris-HCl, 0.15 M NaCl, 0.2% Tween 20) for 1 h at room temperature (RT), and the membrane was then incubated overnight at 4℃ with mouse anti-P-gp monoclonal antibody C219 (1:100; Covance, CA, USA) diluted in skim milk. Gapdh, used as the loading control, was measured using mouse anti-Gapdh monoclonal antibody (1:320,000; Biodesign International Inc, Maine, USA). The membrane was washed three times with TNT buffer and incubated with horseradish peroxidase-conjugated anti-mouse IgG antibodies (1:10,000; Jackson Immunoresearch Lab. Inc.) diluted in TNT buffer for 1 h at RT, and then visualized with Chemiluminescence Reagent Plus (PerkinElmer Life Sciences). The band intensities were measured using a Kodak X-OMAT 2000 developing machine.
Immunofluorescence staining in mouse brains
Female R6/2 and WT mice (three animals in each group) were anesthetized with an intraperitoneal (i.p.) injection of 80 mg/kg sodium pentobarbital before intracardial perfusion with 4% paraformaldehyde in 0.1 M phosphate buffer (81.8 mM K2HPO4, 19.2 mM NaH2PO4, pH 7.4). After perfusion, the brains were carefully isolated, post-fixed in 4% paraformaldehyde for 24 h, immersed in 30% sucrose in 0.1 M phosphate buffer for two days, and then frozen on dry ice. Serial brain coronal sections (20 µm) were prepared and P-gp protein was detected using mouse anti-P-gp monoclonal antibody, C219 (1:100; Covance, CA, USA). For NF-κB activity, brain coronal sections were incubated with a 1:100 dilution of anti-p65 antibodies (BioVision Incorporated, CA, USA) and co-stained with the nuclear marker, Hoechst 33258. The brain capillary endothelial cells and vasculature of the brain samples were simultaneously stained with anti-CD31 antibodies (1:100; Abcam, MA, USA) and anti-Collagen type IV antibodies (1:1000; Abcam, MA, USA), respectively. The patterns of immunostaining were imaged on an LSM 780 confocal microscope (Zeiss, Jena, Germany). The intensity of P-gp staining, the number of CD31-positive cells with nuclear NF-κB p65 staining, and the coverage area of collagen-IV staining were quantified by computer-assisted image analysis (ImageJ v1.47 software, National Institutes of Health, MD, USA).
Immunohistochemistry in human brains
Post-mortem brain tissues of human subjects with and without HD were obtained from the NICHD Brain and Tissue Bank for Developmental Disorders (University of Maryland, Baltimore, MD, USA). The demographic data and neuropathology of the human subjects are summarized in Supplementary Table 1. The deparaffinized brain slices (5 µm) with heat-mediated antigen retrieval (in citrate buffer of pH 6 for 30 minutes at 95℃) were incubated in 3% hydrogen peroxide in TBS (20 mM Tris and 150 mM NaCl) for 10 minutes, blocked in 2.5% skim milk (in TBS) for 1 h, and incubated with mouse anti-P-gp monoclonal antibody (1:50 dilution in TBS; Alexis Biochemicals, NY, USA) overnight at 4℃. The slices were then incubated with biotinylated anti-mouse IgG antibodies (1:200 dilution in TBS; Vector Laboratories, Burlingame, CA, USA) for 1 h at RT, followed by a 30-min incubation at RT with the avidin-biotin complex (1:1:200 in TBS, Vector Laboratories, CA, USA), and then a 10-min incubation with 3,3′-diaminobenzidine (Sigma-Aldrich, St Louis, MO, USA) at RT. After dehydration, the sections were mounted for light microscopy. Semi-quantitative analysis of the expression of P-gp was performed using the H-Score, as described previously.13
Effects of normal and mutant human HTT on P-gp expression and NF-κB activity
HEK-293 T cells were plated in six-well plates (Corning, MA, USA) at a density of 4 × 10⁵ per well in high glucose Dulbecco’s modified Eagle’s medium (Life Technologies, Gaithersburg, MD) containing 10% fetal bovine serum (Hyclone Laboratories, UT, USA) under a 5% CO2, humidified air atmosphere at 37℃ for 24 h. The cells were then transfected with WT HDx1-enhanced green fluorescent protein (EGFP) with the human 25 glutamine repeat HTT gene (HTT-25Q) or mutant HDx1-EGFP with human 109 glutamine repeat HTT gene (mHTT-109Q) at a ratio of 1.0 µg per well using 2 µL TurboFect™ Transfection Reagent (Thermo Scientific, St. Leon-Rot, Germany) according to the manufacturer’s protocol. Twenty-four hours later, the cells were collected with 100 µL RIPA buffer, and then the expression of P-gp and phospho-NF-κB p65 proteins was assessed by Western blotting, as described above, except that a 1:200 dilution of anti-P-gp antibody (C219) and a 1:1000 dilution of rabbit anti-phospho-NF-κB p65 monoclonal antibody (Cell Signaling, MA, USA) were used. To examine the role of NF-κB in mHTT-mediated P-gp expression, the cells were cultured with or without 10 µM BMS-345541, an IKK inhibitor, for an additional 6 h after the 24-h transfection period and were lysed with TRIzol reagent to isolate the total RNA. The mRNA levels of P-gp were quantified by RT-qPCR as described in a previous section.
Determination of risperidone and paliperidone in brain dialysates
Risperidone and paliperidone were obtained from Ferrer International S.A. (Barcelona, Spain). Brain dialysates were collected by in vivo brain microdialysis conducted according to the procedures described previously.15 The relative recovery of risperidone and paliperidone, measured by the ratio of drug concentration in dialysate to that in standard solution, was tested in each probe (CMA7 Probe 2 mm, CMA Microdialysis AB, Solna, Sweden) in vitro prior to use. Only probes with a recovery greater than 10% were used. Risperidone or paliperidone (3 mg/kg), dissolved in 0.1% acetic acid in normal saline (pH 7.2 adjusted by 2 N sodium hydroxide), were given to mice by i.p. injection. For the effect of tariquidar on brain concentrations of risperidone, tariquidar (MedChemexpress, NJ, USA) was freshly prepared on each experimental day in 2.5% aqueous dextrose solution. The mice received an i.v. injection of 6 mg/kg tariquidar 1 h prior to an i.p. administration of 3 mg/kg risperidone. The microdialysis probe was perfused with Ringer’s solution (2.3 mM CaCl2, 4 mM KCl and 147 mM NaCl) at a flow rate of 1.0 µL/min, and brain dialysate was collected every 30 minutes.
The concentrations of risperidone and paliperidone were analyzed by UPLC-MS/MS with a Fortis C18 column (1.7 µm, 100 × 2.1 mm; Fortis Technologies, Cheshire, England) and eluted by 50 mM ammonium acetate (pH 5.5) in 35% acetonitrile. For the identification of risperidone and paliperidone, the multiple reaction monitoring (MRM) transitions of a precursor ion [M+H]+ into a specific fragment ion were recorded in the positive ESI mode at 30 V cone energy and 30 eV collision energy. The compound-specific MRM transitions were m/z 411.2→191.0 for risperidone and m/z 427.2→207.0 for paliperidone.
Determination of risperidone and paliperidone in the plasma and the brain
A dose of 3 mg/kg risperidone or paliperidone was administered intravenously to mice. Serial blood samples (50 µL each) were collected from the mouse facial vein before dosing and at 0.5, 1, 2, 3, 4, and 6 h after dosing. Following centrifugation at 3,000 × g for 10 min, the plasma was frozen at −20℃ until analysis. For the preparation of plasma samples, 20 µL of each plasma sample spiked with 2 µL internal standard (5 µg/mL diltiazem) was mixed with 60 µL methanol, vortexed, and then centrifuged at 25,464 × g for 5 min at 4℃. An aliquot of 10 µL of the supernatant was injected into an UPLC–MS/MS system, as described above. To prepare the brain samples, half of each brain was homogenized in a volume of deionized water (in mL) equal to twice the weight (in grams) of the brain using a Polytron HG-300 homogenizer. The brain homogenate (200 µL) was collected and mixed with 25 µL of internal standard (500 ng/mL diltiazem) and 400 µL 0.5 M Na2HPO4. The samples were extracted with 3 mL isopropyl ether twice. Following centrifugation (2000 × g for 10 min), the upper layers were removed and evaporated to dryness by nitrogen at 40℃. An aliquot of 100 µL mobile phase was added to the residue, mixed, and then centrifuged at 16,000 × g prior to UPLC-MS/MS analysis. For diltiazem, the fragment ions were recorded in the positive ESI mode at 20 V cone energy and 20 eV collision energy and the MRM transitions were m/z 415.4→177.9.
Statistical analyses
Student’s t-test was used to analyze the differences in protein expression and drug concentrations between HD and WT mice. The differences in the mRNA levels among groups were analyzed by analysis of variance (ANOVA), and pairwise comparisons between groups were made using Tukey's test. A Z test for two proportions was used to compare the percentage of p65 in the nuclei of CD31-positive cells between HD and WT mice. Statistical analyses were performed using SYSTAT v10 (Systat, Inc., Evanston, IL, USA), and P < 0.05 was considered statistically significant.
Results
Activity of NF-κB in brain capillaries of HD mice
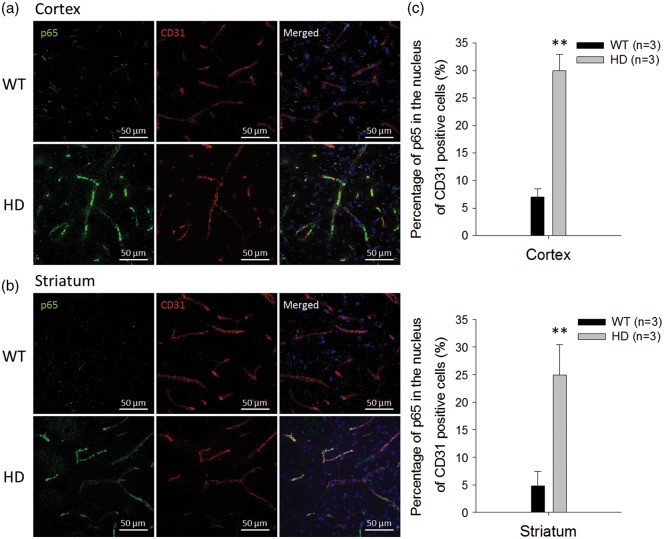
While NF-κB activation has been observed in the neurons and astrocytes of HD transgenic mice,3,9 it has never been reported in their brain capillaries. Therefore, to investigate NF-κB activity in brain capillaries of HD transgenic mice, brain sections from 12-week-old R6/2 HD mice and the WT controls were stained with antibodies that recognize the p65 subunit, nucleus, and brain capillary endothelial cells. As shown in Figure 1, the immunostaining of the NF-κB p65 subunit is prominent in the cytoplasm and nuclei of CD31-positive endothelial cells in the cortex (Figure 1a) and striatum (Figure 1b) of HD transgenic mice. The orthogonal views of these images corroborate nuclear localization of p65 in endothelial cells of HD mice (Supplementary Figure 1). Compared with WT mice, the percentage of p65 in the nuclei of endothelial cells was much higher in HD mice (Figure 1c), suggesting that aberrant activation of NF-κB occurs in the brain capillaries of HD mice.
Figure 1.
Aberrant NF-κB p65 signaling in brain capillaries of R6/2 HD mice and WT controls. The nuclear distribution of the p65 subunit of NF-κB in the cortex (a) and striatum (b) were identified by immunostaining p65 (green) and CD31 (red) in brain capillaries. Nuclei were stained with Hoechst 33258 (blue). (c) The percentages of p65 in the nuclei of CD31-positive capillary endothelial cells were quantified from immunostaining images. Data are presented as the mean ± SEM of three animals. Scale bars indicate 50 µm. (**P < 0.01).
mRNA expression of P-gp, Mrp2 and Bcrp in the brain cortex, intestine, liver, and kidney of HD mice
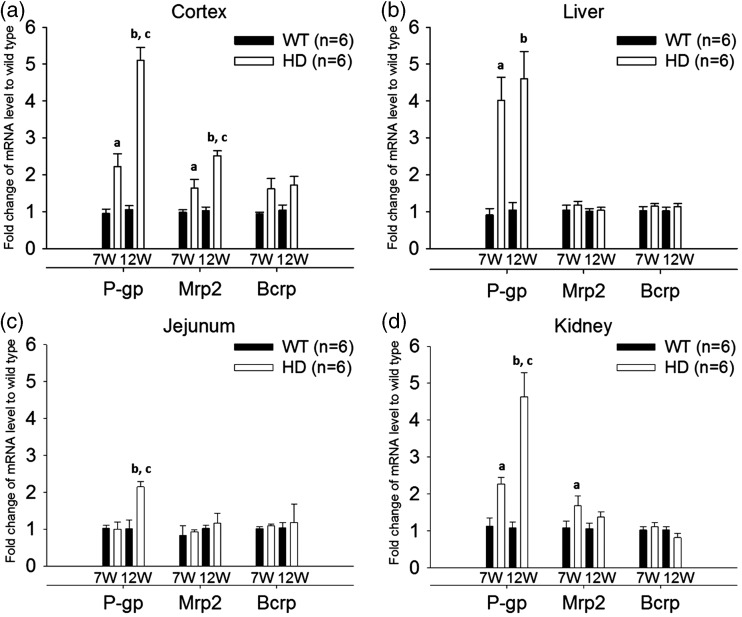
Given that the expression of P-gp, Mrp2, and Bcrp are regulated by NF-κB,16,17 their mRNA levels were measured by RT-qPCR in samples from the cerebral cortex, jejunum, liver, and kidney of R6/2 HD mice and WT mice at 7 weeks old and 12 weeks old to examine the expression of these genes in organs that are important for the absorption and disposition of drug substances. As shown in Figure 2, the mRNA levels of P-gp increased by 2.2 - to 5.1-fold in tissues collected from 12-week-old female HD mice, compared to those of female WT controls. Similar findings were also observed in males (Supplementary Figure 2), indicating that the regulation of P-gp in HD is independent of gender. Notably, the increase of P-gp mRNA in HD mice was greater in mice at 12 weeks of age than in those at 7 weeks of age in the cerebral cortex and some other tissues. As R6/2 transgenic mice at 7 weeks and 12 weeks of age represent symptomatic stages of minimal and pronounced deterioration in motor performance, respectively,18 the regulation of P-gp appeared to be dependent on disease stage in HD.
Figure 2.
mRNA levels of P-gp, Mrp2, and Bcrp in the cerebral cortex (a), liver (b), jejunum (c), and kidney (d) of R6/2 HD mice at 7 weeks and 12 weeks of age (white bars), compared to WT controls (black bars). For tissues from mice of the same age, the relative expression was calculated by 2−ΔΔCt. The ΔΔCt value was obtained by subtracting the mean ΔCt value of WT controls from the individual ΔCt value of the same transporter. The data are given as the mean ± SEM of six animals. Fold changes greater than 1 indicate upregulation and fold changes less than 1 indicate down-regulation. aP < 0.05 compared to WT mice at 7 weeks of age; bP < 0.05 compared to WT mice at 12 weeks of age; cP < 0.05 compared to HD mice at 7 weeks of age.
Protein expression of P-gp in the brains of HD mice and humans
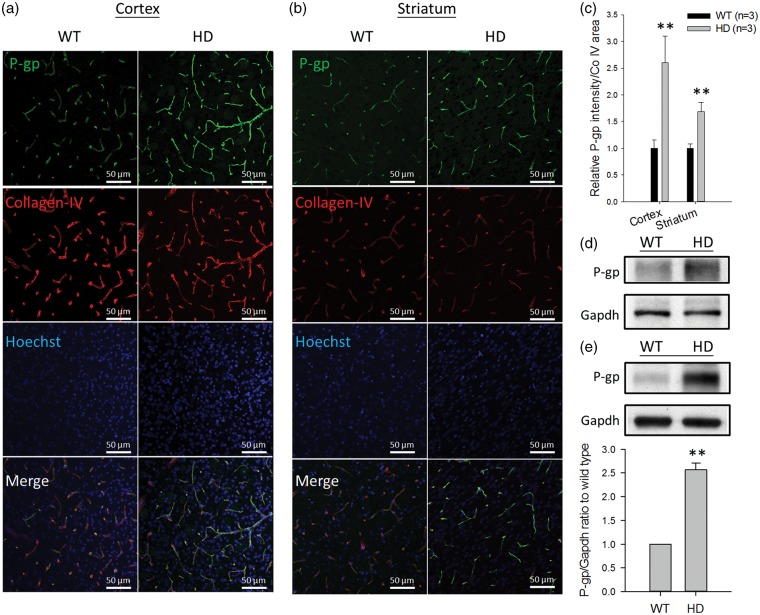
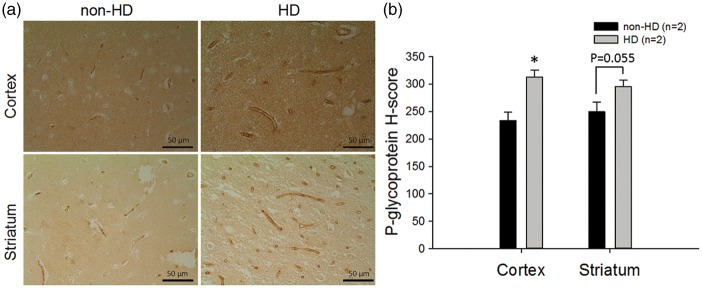
Given that the mRNA level of P-gp was increased in the brains of HD mice, P-gp protein was further examined in brain capillaries and the whole brain membrane fractions from these mice. In brain capillaries, P-gp expression was measured by immunofluorescence in brain sections and determined by the intensity of stained P-gp normalized to the coverage area of collagen-IV in the capillaries. As shown in Figure 3, the expression of P-gp protein was approximately 2.6-fold higher in brain capillaries of the cortex (Figure 3a) and was approximately 1.7-fold higher in the striatum (Figure 3b) of HD mice than in WT controls (Figure 3c). Western blotting also showed higher P-gp expression in HD mice than in WT mice in the lysates of isolated brain capillaries (Figure 3d) and the membrane fraction of the whole brain (Figure 3e). In addition to the measurement in HD mice, P-gp expression was also examined by immunohistochemistry in brain sections of human subjects with or without HD. These results parallel the findings in HD mice, in which P-gp expression was significantly higher in the brain capillaries of HD patients compared to that in non-HD subjects (Figure 4).
Figure 3.
The immunostaining of P-gp protein in brain capillaries in the cortex (a) and striatum (b) of R6/2 HD mice and WT controls (green, p-gp; red, collagen-IV; blue, nuclei). Scale bars indicate 50 µm. (c) The quantification of P-gp intensity normalized to collagen-IV coverage area in HD and WT mice. (d) Western blotting of P-gp in the lysates of pooled brain capillaries isolated from six R6/2 mice and six WT mice, respectively. (e) Western blotting and the quantification results of P-gp in the membrane fractions isolated from the whole brains of HD and WT mice. The quantitative results in (c) and (e) are presented as the mean ± SEM of three mice. (**P < 0.01).
Figure 4.
Immunohistochemical analysis of P-gp protein in the cortex (upper panel) and striatum (lower panel) of human brains in non-HD and HD subjects (a) and the quantification results (b). Scale bars indicate 50 µm. Representative images are shown. To quantify P-gp expression, a total of three fields were randomly chosen from each subject. Six assigned H-score values from HD patients (n = 2) and six from non-HD controls (n = 2) are compared. The data are given as the mean ± SEM, and the asterisk indicates P < 0.05 compared to the results of non-HD human brains.
Effects of mutant HTT on the expression of P-gp
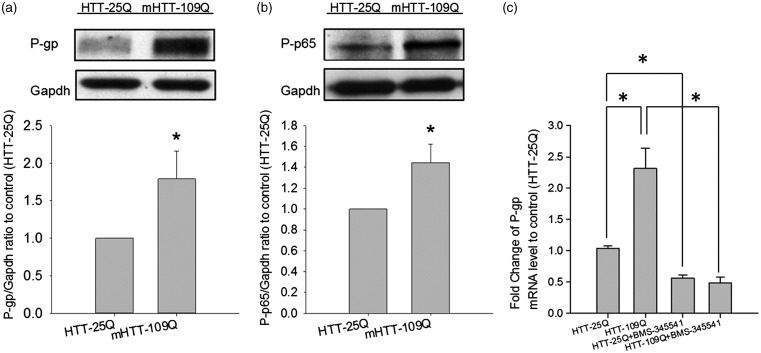
To investigate the role of HTT on P-gp expression in brain capillaries, the expression of HTT was first examined in brain capillaries isolated from the R6/2 HD mice, the WT controls, and C57BL/6 mice. The RT-qPCR analysis showed the expression of HTT mRNA in both the isolated brain capillaries and cerebral cortex of these mice (Supplementary Table 2). The effects of human HTT on the expression of P-gp and the activity of NF-κB were then explored in HEK293T cells. As shown in Figure 5a, the expression of P-gp protein was significantly increased in HEK293T cells transfected with mHTT-109Q compared to cells transfected with HTT-25Q. Additionally, NF-κB activity was elevated in mHTT-109Q-expressing cells, but not in cells with normal HTT-25Q (Figure 5b). Further investigation showed that co-treatment with an IKK inhibitor, BMS-345541, decreased P-gp mRNA levels in cells transfected with mHTT-109Q or normal HTT-25Q, indicating the role of NF-κB in HTT-mediated P-gp regulation (Figure 5c).
Figure 5.
Effect of normal and mutant human huntingtin (HTT) on P-gp expression. (a) Expression of P-gp protein in HEK293T cells transfected with the normal human 25 polyQ-containing HDx1-EGFP gene (HTT-25Q) or the mutant 109 polyQ-containing HDx1-EGFP gene (mHTT-109Q). (b) Protein levels of phosphorylated p65 subunit of NF-κB in HEK293T cells transfected with either normal HTT-25Q or mHTT-109Q. (c) Effects of IKK inhibitor (BMS-345541, 10 µM) on the mRNA levels of P-gp in HEK293T cells transfected with normal HTT-25Q or mHTT-109Q. The data are given as the mean ± SEM of three independent experiments, each in triplicate.
Brain extracellular levels of risperidone and paliperidone in HD mice
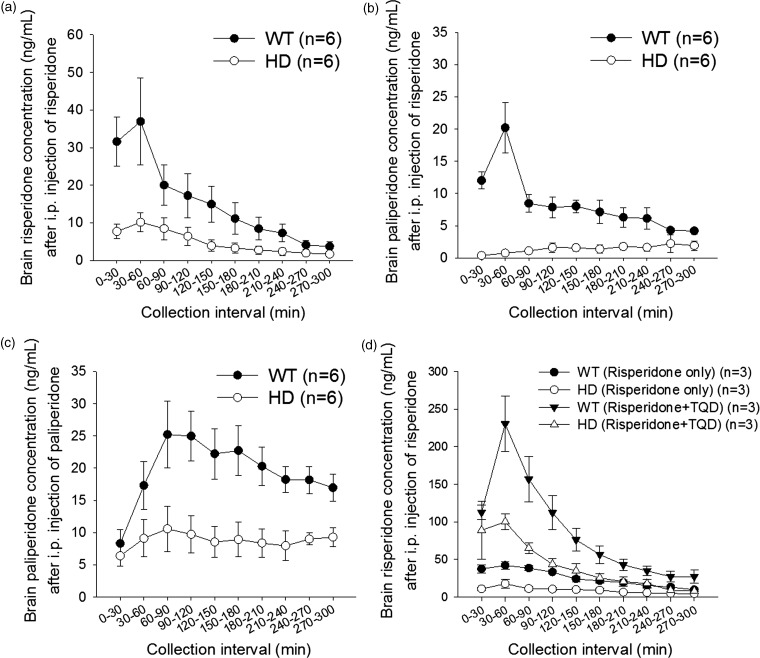
As P-gp is highly expressed at the BBB and both risperidone and its active metabolite, 9-hydroxyrisperidone (i.e. paliperidone), are P-gp substrates, the brain extracellular levels of these drugs were measured by in vivo brain microdialysis. After an i.p. injection of risperidone, the Tmax (time to reach the maximal brain extracellular concentration) for risperidone and paliperidone was at 30-60 collection interval. The brain extracellular levels of both risperidone and paliperidone were significantly lower in female HD mice than in the female controls (Figure 6a and b). The areas under the concentration–time curve (AUCs) (all as mean ± SD) for risperidone were 1328 ± 1129 and 3799 ± 2334 min•ng/mL in HD and WT mice, respectively (P < 0.05); the AUCs for the metabolite, paliperidone, were 392 ± 299 min•ng/mL and 2234 ± 1477 min•ng/mL, in HD and WT mice, respectively (P < 0.05). Likewise, when paliperidone was given by i.p. administration, the Tmax for paliperidone was at 60–90 collection interval and the AUCs of paliperidone at brain extracellular levels were reduced by 55% in HD mice compared to WT mice (the AUCs were 2514 ± 696 min•ng/mL and 5027 ± 1912 min•ng/mL in female HD and WT mice, respectively; P < 0.05) (Figure 6c). These data suggest that the transfer of risperidone and paliperidone across the BBB was significantly reduced in HD mice. Further study showed that the pre-treatment with tariquidar, a P-gp inhibitor, significantly increased extracellular levels of risperidone in the brains of HD mice and the WT controls (Figure 6d). The AUCs were 2462 ± 533 min•ng/mL and 10283 ± 2184 min•ng/mL in male HD mice without and with tariquidar treatment, respectively (P < 0.05) and the AUCs were 6158 ± 1313 min•ng/mL and 22451 ± 8275 min•ng/mL in male WT mice without and with tariquidar treatment, respectively (P < 0.05). These findings demonstrate the important role of P-gp in regulating BBB transport of the drugs. Gender did not affect brain extracellular levels of risperidone in mice. When the effect of tariquidar was further examined, the results showed that tariquidar treatment did not significantly change P-gp expression in the brains of mice (Supplementary Figure 3). Thus, tariquidar increased extracellular levels of risperidone in the brain by inhibiting the efflux activity but not the expression of P-gp at the BBB.
Figure 6.
(a–c) Extracellular levels of risperidone and its metabolite (9-hydroxyrisperidone or paliperidone) in the brains of female WT mice (black circles) and HD transgenic mice (white circles) receiving an intraperitoneal (i.p.) administration of 3 mg/kg risperidone (a and b) or paliperidone (c). (d) Effects of tariquidar (TQD) treatment (6 mg/kg, single intravenous injection) on brain extracellular levels of risperidone in male WT and HD mice receiving an i.p. administration of 3 mg/kg risperidone. The data are presented as the mean ± SEM of 3–6 mice.
Plasma levels of risperidone and paliperidone in R6/2 HD mice
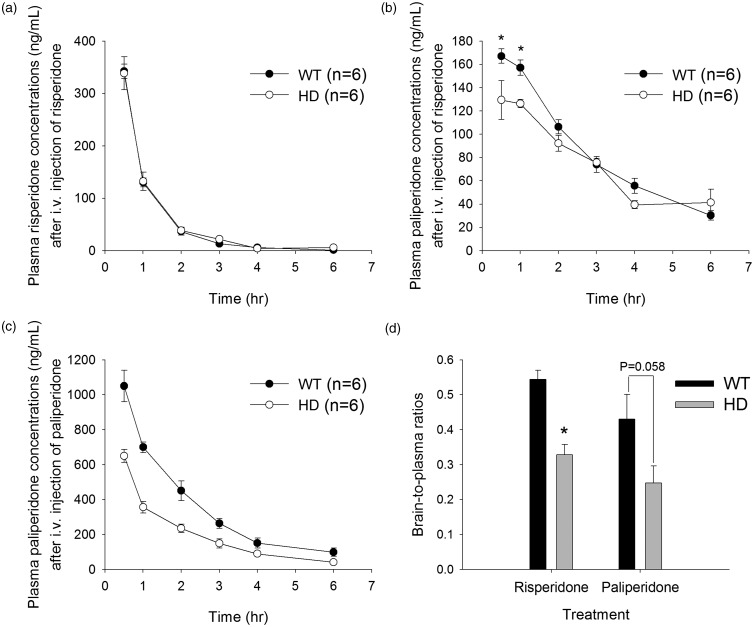
To investigate whether plasma levels of risperidone and paliperidone were also different between HD mice and controls, risperidone and paliperidone were given to the mice by intravenous injection. After the injection of risperidone, the plasma levels of risperidone were comparable between HD and control mice (Figure 7a). In contrast, the concentrations of its active metabolite, paliperidone, were significantly lower in HD shortly after the injection but then became comparable in these two groups afterward (Figure 7b). Interestingly, after intravenous administration of paliperidone, plasma levels of paliperidone were all significantly lower in HD mice than in control mice. The AUCs (mean ± SD) were 1993 ± 188 h•ng/mL and 2998 ± 748 h•ng/mL in HD mice and controls, respectively; P < 0.05) (Figure 7c). The clearance (estimated by the ratio of the dose to AUC) of paliperidone was 1.5-fold higher in HD mice than in control mice (1516 ± 142 mL/h and 1047 ± 236 mL/h in HD mice and controls, respectively).
Figure 7.
Plasma concentrations of risperidone (a) and its metabolite (paliperidone) (b) in WT mice (black circles) and R6/2 HD mice (white circles) after an intravenous injection of 3 mg/kg risperidone. The asterisk indicates P < 0.05 compared to HD mice. (c) Plasma concentrations of paliperidone after an intravenous injection of 3 mg/kg paliperidone. (d) Brain-to-plasma ratios of risperidone or paliperidone after an intravenous injection of 3 mg/kg risperidone or paliperidone, respectively. The data are presented as the mean ± SEM of five mice.
After intravenous administration of risperidone, the brain-to-plasma ratios of risperidone were 0.54 and 0.33 in WT and HD mice, respectively; after paliperidone treatment, the brain-to-plasma ratios of paliperidone were 0.43 and 0.25 in WT and HD mice, respectively (Figure 7d). Both outcomes are consistent with the findings from in vivo brain microdialysis.
Discussion
P-gp is an important component of the BBB that limits the entry of a variety of compounds into the brain. Altered P-gp activity caused by pathological states may alter the pharmacokinetics of drug substances and their therapeutic efficacy in the central nervous system. HD is a neurodegenerative disease whose treatment may include antihyperkinetic and antipsychotic agents. Given the complexity of drugs used in HD, many of which are substrates of P-gp,19,20 understanding the function and expression of P-gp in this disease is important, especially at the BBB. The current results are the first to show that the expression of P-gp is upregulated in brain capillaries in the cerebral cortex and striatum of human HD patients and R6/2 HD mice that express mutant HTT. Notably, the expression of P-gp in the cortex increased with disease progression, and P-gp mRNA levels were higher at a later disease stage. The reduced extracellular levels of risperidone and paliperidone were in line with the increased P-gp expression in brain capillaries in R6/2 mice. These findings suggest that altered drug neuropharmacokinetics caused by increased P-gp expression deserves attention in the treatment of HD.
In addition to the brain, a remarkable increase of P-gp mRNA was also observed in the liver and kidney of HD transgenic mice. Both the liver and kidney are important for the disposition of administered drugs. The increase of P-gp expression in the liver and kidney can increase biliary and renal secretion of P-gp substrates (such as risperidone and paliperidone). After an intravenous injection of paliperidone, the total clearance of paliperidone increased 1.5-fold in HD mice compared to WT controls. In contrast, after giving risperidone, the clearance of risperidone was not affected by the pathological state of HD, although the plasma level of its active metabolite, paliperidone, was lower (shortly after risperidone injection) in HD mice than in control mice. These results may be attributed to the difference in the pharmacokinetic properties of risperidone and paliperidone. Paliperidone is highly excreted in an unchanged form in the urine (80%), whereas risperidone is mainly metabolized by the liver, but not excreted by the kidney.21 Thus, the change of P-gp expression in the kidney would exhibit higher impacts on the clearance of paliperidone than on that of risperidone. Yet, despite the differences in clearance and plasma levels, the brain-to-plasma ratios of risperidone and paliperidone were both significantly decreased in R6/2 transgenic mice, demonstrating that brain delivery of both risperidone and paliperidone were significantly impaired in mice with HD. Nevertheless, as concomitant use of tariquidar can inhibit the efflux activity of P-gp at the BBB and increase extracellular levels of risperidone in the brain, the use of P-gp inhibitors may be useful in the treatment of HD as modulators to increase brain drug levels and rescue therapeutic efficacy.
HTT is a transcription factor that regulates a number of genes.22 Changes in the transcription of mHTT have been reported by a number of studies.23–25 Cells expressing mHTT and striatal cells from HD transgenic mice had elevated NF-κB activity through direct interaction between mHTT and IKK.9 In this study, an elevated NF-κB activity was found in brain capillaries of HD mice. When the role of mHTT on P-gp expression was examined, the results showed that NF-κB is involved because blocking NF-κB activity with an IKK inhibitor abolished P-gp upregulation in HEK293T cells expressing human mHTT-109Q. This observation not only supports the critical role of NF-κB signaling pathway in regulating P-gp expression at the BBB,7,8 but also indicates that mHTT may cause aberrant expression of other NF-κB target genes that may have impacts on drug disposition in patients with HD. On the other hand, given the close cell–cell associations between astrocytes and brain capillary endothelial cells, the astrocyte–endothelial interaction is worth attention. According to a recent report, astrocytes increase endothelial cell proliferation by producing more vascular endothelial growth factor in HD.26 Activation of the NF-κB pathway in astrocytes also triggers a neuroinflammatory response with increased production of pro-inflammatory cytokines, such as tumor necrosis factor-α and interleukin-6, that may play a role in the up-regulation of P-gp at the BBB.8,27,28
In conclusion, the function and expression of P-gp were increased in the brains of HD transgenic mice, which limited the BBB transfer of risperidone and paliperidone. These findings may provide a basis for the selection of therapeutic agents in HD treatment. Further studies will be required to verify the clinical significance of these results.
Supplementary Material
Funding
The author(s) disclosed receipt of the following financial support for the research, authorship, and/or publication of this article: This study was in part supported by Grant NSC101-2325-B-002-015 from National Science Council of Taiwan.
Declaration of conflicting interests
The author(s) declared no potential conflicts of interest with respect to the research, authorship, and/or publication of this article.
Authors’ contributions
Y-H Kao contributed to the design; acquisition and analysis of data, drafting the article, and final approval of the manuscript; Y Chern contributed to conception and design, advised experiments, revised the article critically for important intellectual content, and final approval of the manuscript; H-T Yang contributed to acquisition and analysis of data and final approval of the manuscript; H-M Chen contributed to acquisition of data in animal experiments and final approval of the manuscript; C-J Lin contributed to the conception and design, advised and supervised experiments, drafting and revised the articles critically for important intellectual content, and final approval of the manuscript.
Supplementary material
Supplementary material for this paper can be found at http://jcbfm.sagepub.com/content/by/supplemental-data
References
- 1.MacDonald ME, Ambrose CM, Duyao MP, et al. A novel gene containing a trinucleotide repeat that is expanded and unstable on Huntington's disease chromosomes. Cell 1993; 72: 971–983. [DOI] [PubMed] [Google Scholar]
- 2.Shin JY, Fang ZH, Yu ZX, et al. Expression of mutant huntingtin in glial cells contributes to neuronal excitotoxicity. J Cell Biol 2005; 171: 1001–1012. [DOI] [PMC free article] [PubMed] [Google Scholar]
- 3.Hsiao HY, Chen YC, Chen HM, et al. A critical role of astrocyte-mediated nuclear factor-kappaB-dependent inflammation in Huntington’s disease. Hum Mol Genet 2013; 22: 1826–1842. [DOI] [PubMed] [Google Scholar]
- 4.Drouin-Ouellet J, Sawiak SJ, Cisbani G, et al. Cerebrovascular and blood-brain barrier impairments in Huntington’s disease: Potential implications for its pathophysiology. Ann Neurol 2015; 78: 160–177. [DOI] [PubMed] [Google Scholar]
- 5.Li SH, Li XJ. Huntingtin-protein interactions and the pathogenesis of Huntington's disease. Trends Genet 2004; 20: 146–154. [DOI] [PubMed] [Google Scholar]
- 6.Gunawardena S, Goldstein LS. Polyglutamine diseases and transport problems: deadly traffic jams on neuronal highways. Arch Neurol 2005; 62: 46–51. [DOI] [PubMed] [Google Scholar]
- 7.Zhang J, Zhang M, Sun B, et al. Hyperammonemia enhances the function and expression of P-glycoprotein and Mrp2 at the blood-brain barrier through NF-kappaB. J Neurochem 2014; 131: 791–802. [DOI] [PubMed] [Google Scholar]
- 8.Bauer B, Hartz AM, Miller DS. Tumor necrosis factor alpha and endothelin-1 increase P-glycoprotein expression and transport activity at the blood-brain barrier. Mol Pharmacol 2007; 71: 667–675. [DOI] [PubMed] [Google Scholar]
- 9.Khoshnan A, Ko J, Watkin EE, et al. Activation of the IkappaB kinase complex and nuclear factor-kappaB contributes to mutant huntingtin neurotoxicity. J Neurosci 2004; 24: 7999–8008. [DOI] [PMC free article] [PubMed] [Google Scholar]
- 10.Lauterbach EC. Neuroprotective effects of psychotropic drugs in Huntington's disease. Int J Mol Sci 2013; 14: 22558–22603. [DOI] [PMC free article] [PubMed] [Google Scholar]
- 11.Anderson K, Craufurd D, Edmondson MC, et al. An international survey-based algorithm for the pharmacologic treatment of obsessive-compulsive behaviors in Huntington's disease. PLoS Curr 2011; 3: RRN1261. [DOI] [PMC free article] [PubMed] [Google Scholar]
- 12.Feng B, Mills JB, Davidson RE, et al. In vitro P-glycoprotein assays to predict the in vivo interactions of P-glycoprotein with drugs in the central nervous system. Drug Metab Dispos 2008; 36: 268–275. [DOI] [PubMed] [Google Scholar]
- 13.Wu KC, Lu YH, Peng YH, et al. Decreased expression of organic cation transporters, Oct1 and Oct2, in brain microvessels and its implication to MPTP-induced dopaminergic toxicity in aged mice. J Cereb Blood Flow Metab 2015; 35: 37–47. [DOI] [PMC free article] [PubMed] [Google Scholar]
- 14.Wu KC, Pan HJ, Yin HS, et al. Change in P-glycoprotein and caveolin protein expression in brain striatum capillaries in New Zealand obese mice with type 2 diabetes. Life Sci 2009; 85: 775–781. [DOI] [PubMed] [Google Scholar]
- 15.Lin CJ, Tai Y, Huang MT, et al. Cellular localization of the organic cation transporters, OCT1 and OCT2, in brain microvessel endothelial cells and its implication for MPTP transport across the blood-brain barrier and MPTP-induced dopaminergic toxicity in rodents. J Neurochem 2010; 114: 717–727. [DOI] [PubMed] [Google Scholar]
- 16.Ronaldson PT, Ashraf T, Bendayan R. Regulation of multidrug resistance protein 1 by tumor necrosis factor alpha in cultured glial cells: Involvement of nuclear factor-kappaB and c-Jun N-terminal kinase signaling pathways. Mol Pharmacol 2010; 77: 644–659. [DOI] [PubMed] [Google Scholar]
- 17.Ke SZ, Ni XY, Zhang YH, et al. Camptothecin and cisplatin upregulate ABCG2 and MRP2 expression by activating the ATM/NF-kappaB pathway in lung cancer cells. Int J Oncol 2013; 42: 1289–1296. [DOI] [PubMed] [Google Scholar]
- 18.Carter RJ, Lione LA, Humby T, et al. Characterization of progressive motor deficits in mice transgenic for the human Huntington's disease mutation. J Neurosci 1999; 19: 3248–3257. [DOI] [PMC free article] [PubMed] [Google Scholar]
- 19.El Ela AA, Hartter S, Schmitt U, et al. Identification of P-glycoprotein substrates and inhibitors among psychoactive compounds–implications for pharmacokinetics of selected substrates. J Pharm Pharmacol 2004; 56: 967–975. [DOI] [PubMed] [Google Scholar]
- 20.Wang JS, Ruan Y, Taylor RM, et al. The brain entry of risperidone and 9-hydroxyrisperidone is greatly limited by P-glycoprotein. Int J Neuropsychopharmacol 2004; 7: 415–419. [DOI] [PubMed] [Google Scholar]
- 21.Dolder C, Nelson M, Deyo Z. Paliperidone for schizophrenia. Am J Health-Syst Pharm 2008; 65: 403–413. [DOI] [PubMed] [Google Scholar]
- 22.Johnson R, Zuccato C, Belyaev ND, et al. A microRNA-based gene dysregulation pathway in Huntington's disease. Neurobiol Dis 2008; 29: 438–445. [DOI] [PubMed] [Google Scholar]
- 23.Zuccato C, Ciammola A, Rigamonti D, et al. Loss of huntingtin-mediated BDNF gene transcription in Huntington’s disease. Science 2001; 293: 493–498. [DOI] [PubMed] [Google Scholar]
- 24.Cha JH. Transcriptional dysregulation in Huntington's disease. Trends Neurosci 2000; 23: 387–392. [DOI] [PubMed] [Google Scholar]
- 25.Li SH, Cheng AL, Zhou H, et al. Interaction of Huntington disease protein with transcriptional activator Sp1. Mol Cell Biol 2002; 22: 1277–1287. [DOI] [PMC free article] [PubMed] [Google Scholar]
- 26.Hsiao HY, Chen YC, Huang CH, et al. Aberrant astrocytes impair vascular reactivity in Huntington's disease. Ann Neurol 2015; 78: 178–192. [DOI] [PubMed] [Google Scholar]
- 27.Abbott NJ, Roninback L, Hanssan E. Astrocyte-endothelial interactions at the blood-brain barrier. Nat Rev Neurosci 2006; 7: 41–53. [DOI] [PubMed] [Google Scholar]
- 28.Björkqvist M, Wild EJ, Thiele J, et al. A novel pathogenic pathway of immune activation detectable before clinical onset in Huntington’s disease. J Exp Med 2008; 205: 1869–1877. [DOI] [PMC free article] [PubMed] [Google Scholar]
Associated Data
This section collects any data citations, data availability statements, or supplementary materials included in this article.


