

Abstract
Cerebral autoregulation ensures constant cerebral blood flow during periods of increased blood pressure by increasing cerebrovascular resistance. However, whether this increase in resistance occurs at the level of major cerebral arteries as well as at the level of smaller pial arterioles is still unknown in humans. Here, we measure cerebral arterial compliance, a measure that is inversely related to cerebrovascular resistance, with our novel non-invasive magnetic resonance imaging-based measurement, which employs short inversion time pulsed arterial spin labelling to map arterial blood volume at different phases of the cardiac cycle. We investigate the differential response of the cerebrovasculature during post exercise ischemia (a stimulus which leads to increased cerebrovascular resistance because of increases in blood pressure and sympathetic outflow). During post exercise ischemia in eight normotensive men (30.4 ± 6.4 years), cerebral arterial compliance decreased in the major cerebral arteries at the level of and below the Circle of Willis, while no changes were measured in arteries above the Circle of Willis. The reduction in arterial compliance manifested as a reduction in the arterial blood volume during systole. This study provides the first evidence that in humans the major cerebral arteries may play an important role in increasing cerebrovascular resistance.
Keywords: Arterial compliance, cerebral autoregulation, arterial spin labelling, post exercise ischemia, sympathetic nervous activity
Introduction
The brain is very sensitive to changes in cerebral blood flow (CBF), with both hypo- and hyperperfusion having severe consequences such as ischemic stroke or cerebral hyperperfusion syndrome. The effect of changes in mean arterial pressure (MAP), and therefore cerebral perfusion pressure, is buffered well in the brain by cerebral autoregulation. Cerebral autoregulation is the process that ensures that CBF remains within healthy limits in the face of variations in arterial blood pressure (BP). It is generally accepted that in order to maintain CBF, cerebrovascular resistance increases during periods of increased BP. However, controversy exists where in the cerebrovascular tree this increased resistance occurs; at the level of the smaller pial arterioles, the major brain feeding arteries or a combination of both.1
An important source of this controversy is the lack of in vivo human data that assesses the response of the arteries along the cerebral arterial tree to a change in MAP. In the 1930s, Fog2 used cranial windows in anaesthetised cats to measure decreases in pial arteriole diameters during rises in MAP (and increases in diameter with decreased MAP) without measuring changes in vascular resistance in the proximal cerebrovasculature. In the 1970s, McHedlishvili et al.3 then showed that in dogs there is marked constriction of the internal carotid artery during increases in MAP. In contrast, a decade later Faraci et al.4 showed that the vertebral artery in cats does not respond to a change in MAP. These results, therefore, highlight not only the controversy of the location of cerebrovascular resistance but also the difficulty of translating results of such experiments between species. However, it is clear that it is an increase in vascular smooth muscle cell (SMC) tone that underlies the increased cerebrovascular resistance during periods of elevated pressure.
It is important to note that, in addition to elevated systemic pressure, increased sympathetic nerve activity (SNA) can also lead to increased vascular SMC tone in humans.5,6 Umeyama et al.6 performed a study in which unilateral blockage of sympathetic innervation of the human cerebrovasculature resulted in increased CBF solely to the ipsilateral side, suggesting that blockage of sympathetic stimulation leads to decreased SMC tone and a decrease in cerebrovascular resistance. However, the role of the sympathetic nervous system in cerebral autoregulation and its key vascular sites of action are still incompletely understood.1,7
In the current study, we aim to investigate the response of the major cerebral arteries to a physiological challenge that increases both systemic BP and SNA and, therefore, raises cerebrovascular resistance. For this purpose, we use isometric forearm contraction (IFC) followed by post exercise ischemia (PEI) in healthy volunteers because this intervention is well known for increasing systemic BP and SNA.8,9 We apply our recently introduced and non-invasive magnetic resonance imaging (MRI) method to measure cerebral arterial compliance (AC), which assesses arterial blood volume (aBV) at different phases of the cardiac cycle with short inversion time (TI) pulsed arterial spin labelling (PASL).10 Because AC is inversely related to vascular resistance,11 we hypothesised that we would find decreased cerebral AC during PEI. Secondary to investigating the response of the major cerebral arteries, we aimed to demonstrate that whole brain perfusion remains similar during the intervention by including a measurement of whole brain CBF with multi TI PASL.
Methods
Eight healthy males (average age: 30.4 ± 6.4 years) were recruited for this study. Imaging data were acquired on a 3T whole body MRI system (GE Excite HDx, Milwaukee, WI) using an eight-channel receive-only head coil. Informed consent was obtained from all volunteers under ethical approval from the Cardiff University School of Psychology Ethics Committee, and all experiments were performed in accordance with the guidelines stated in the Cardiff University Research Framework (version 4.0, 2010).
Post exercise ischemia
The PEI protocol was similar to that previously described by Sander et al.8 A pneumatic in-house made and MRI-compatible handgrip device was used. Participants were first asked to use their dominant hand (all were right handed) to perform their maximum effort handgrip twice, each time holding for 2 s. During the task, each participant was instructed via visual cues to do an IFC at 40% of his maximum grip for 3 min. After 2 min of IFC, a brachial BP cuff, placed ipsilateral to the gripping hand, was inflated to 100 mmHg above resting systolic BP. The BP cuff was inflated for 10 min. Note that this meant that there was 1 min of overlap of IFC and cuff inflation. The total duration of this PEI protocol was 12 min.
AC measurements
The MRI scan session contained two measurements of compliance: one resting scan series, in which participants were instructed to look at a cross-hair for the duration of the scan (10 min), and one series preceded by the IFC task and scanned in the following 10 min of PEI. Image acquisition for the rest and PEI series was identical.
Each AC measurement was performed as described previously:10 short TI pulsed ASL was used with seven TIs: 250–850 ms (spacing of 100 ms). PICORE tagging was applied with label thickness of 200 mm, a QUIPSS II12 cut-off at 700 ms and 32 tag-control pairs were acquired for each TI. The gap between the distal end of the labelling slab and the most proximal slice was 1 cm. A gradient echo spiral read-out with a single interleaf was used. Other acquisition parameters were variable repetition time (TR), minimum TR = 1 s, TE = 2.7 ms, voxel size = 3.5 × 3.5 × 7 mm,3 12 slices, slice gap 1 mm, slice delay 29 ms and whole brain coverage. A calibration image was acquired with the same acquisition parameters, except for the repetition time (TR = 4s) and without applying a labelling pulse, in order to obtain the equilibrium magnetisation of cerebrospinal fluid (M0,CSF), which was needed for the quantification of aBV.
Physiological monitoring
BP was measured continuously with a finger cuff on the left thumb (BIOPAC Systems, Goleta, USA). MAP was calculated as follows: MAP = (1/3) × BPSys + (2/3) × BPDia and pulse pressure (PP) was calculated as the difference between systolic and diastolic BP (PP = BPSys − BPDia). Average MAP and PP were calculated for the durations of the AC scans in rest and PEI. Finger photoplethysmography was used to measure cardiac traces, a pneumatic belt just below the rib cage was used to monitor respiratory rate and a nasal cannula to monitor end-tidal partial pressures of carbon dioxide (PETCO2) and oxygen (PETO2).
Image analysis
PASL time series were motion corrected using MCFLIRT13 within the FMRIB Software Library v5.0 (FSL). Retrospective synchronisation was then performed using in-house programmes written in MATLAB R2012b (Mathworks, Natick, MA, USA). A time shift of 225 ms was applied to the finger plethysmograph trace to account for the delay between the cerebral and finger pulse. This time period was deduced from delay times found in the literature between the R-peak in the electrocardiogram and the left finger14 and the time delay between R-peak in the ECG and the onset of the carotid pulse wave.15 Images were further analysed on a slice-by-slice basis, taking into account the slice time delay. The normalised cardiac phase (ϕc,norm) of each acquired slice was determined according to the following
| (1) |
where tacq is the time of the slice acquisition, t1 the time of the previous systolic peak in the shifted plethysmography trace and t2 the time of the following systolic peak in the plethysmography trace. The cardiac cycle was then divided into six bins, i.e. the first bin containing slices acquired with 0 ≤ ϕc,norm < 1/6, the second bin containing slices acquired with 2/6 ≤ ϕc,norm < 3/6 and so on. Slices acquired in ‘early diastole’ corresponded to those with 0/6 ≤ ϕc,norm ≤ 1/6 and slices acquired in ‘early systole’ were those with 4/6 ≤ ϕc,norm ≤ 5/6. Average tag and control images were calculated and subtracted to obtain maps of ΔM per TI and per cardiac phase, e.g. for one participant during rest there are 7 ΔM images (7 TI) in systole.
Calculation of compliance related parameter maps
We used equation (2) to estimate aBV in volume percentage of the voxel (%v), arterial arrival time (Δtart) in ms, and bolus dispersion (σ) in ms, on a voxelwise basis for each of the six cardiac phases separately (least-square fitting, lsqcurvefit in MATLAB)
| (2) |
The bolus duration (τ) was fixed at 700 ms by the QUIPSS II cut-off, the w(t) was a square weighting function (1 for t < τ, 0 elsewhere) and µ(σ,t) a Gaussian kernel with width σ and centred on Δtart. The equilibrium magnetisation of blood (M0,a) was calculated from M0,CSF,16 the labelling efficiency (α) was set to 1 and the longitudinal relaxation time of arterial blood (T1,a) was 1664 ms.17 Maps of aBVDia (calculated from images acquired in ‘early diastole’) and aBVSys (calculated from images acquired in ‘early systole’) were used to calculate AC according to
| (3) |
Note that here AC is normalised for the aBV in diastole and is, therefore, calculated as percentage change in aBV per mmHg (%/mmHg).
Regions of interest
For each participant, regions of interest (ROI) were determined based on an average aBV map: a map of aBV resulting from fitting equation (2) to an average ΔM image containing the tag-control data for all TIs and all cardiac phases (no synchronisation with cardiac phase). For instance, in the slice just superior to the Circle of Willis these regions were drawn to encompass the right middle, left middle, right posterior, left posterior and anterior cerebral arteries (RMCA, LMCA, RPCA, LPCA, and ACA, respectively). These manually drawn ROIs were multiplied with the thresholded average aBV map (aBV ≥ 0.5%v) to create individual ROIs for each artery. Note that ROIs were created for average aBV maps from both the Rest and PEI AC time series. For each artery, the union of the ROIs resulting from the Rest and PEI data was used for the region-based analysis.
To investigate compliance changes along the cerebrovascular tree, slice-by-slice average AC was calculated by merging the ROIs within each slice. Proximal to the Circle of Willis, these ROIs encompassed the internal carotid and basilar arteries. At the level of and distal to the Circle of Willis, the right and left MCA were included.
Perfusion measurement and image analysis
After the compliance measurements, two perfusion scans were acquired: one resting scan series and one scanned during PEI. CBF was measured with multi TI pulsed ASL, adapted for brainstem imaging.18 PICORE labelling with label thickness of 200 mm and a QUIPSSII cut-off at 700 ms12 was used and 10 tag-control pairs were acquired for each of eight TIs (250 ms, 400 ms, 550 ms, 700 ms, 1000 ms, 1300 ms, 1600 ms and 1900 ms). A gradient echo image acquisition was performed with two spiral interleaves, to minimise signal loss due to field inhomogeneities and physiological noise. Other acquisition parameters were variable repetition time (TR), minimum TR =1 s, TE = 2.7 ms, voxel size = 3.5 × 3.5 × 7 mm,3 12 slices and slice gap 1 mm. Total acquisition time was approximately 10 min. A calibration image was acquired with the same acquisition parameters, except for the repetition time (TR = 4 s) and without applying a labelling pulse, in order to obtain the equilibrium magnetisation of cerebrospinal fluid (M0,CSF), used in the quantification of CBF. An image with minimal contrast was also acquired to map the coil sensitivity profile (same acquisition parameters except for TE = 11 ms, TR = 2 s and 8 interleaves). A high-resolution T1-weighted structural image (3D fast spoiled gradient echo) was acquired for registration purposes (TE = 2.9 ms, TR = 7.8 ms, voxel size = 1 × 1 × 1 mm3).
The PASL time series were motion corrected (MCFLIRT,13 within FSL). Edge-preserving smoothing was applied to the minimal contrast image (SUSAN,19 within FSL) and the result was used to correct the CBF time series for the coil sensitivity profile, i.e. the CBF time series was divided by the pre-processed minimal contrast image. Average difference images (ΔM) were obtained for each TI after tag-control subtraction of the CBF time series. Chappell’s two-compartment model, containing both a macro- and microvascular compartment,17 was then used to obtain voxel-wise estimates of CBF. The reader is referred to the work of Chappell et al.17 for a full description of the model.
Masks of whole brain grey matter were used to calculate average grey matter CBF. These masks were created by segmentation of the T1-weighted structural scan with FAST20 (within FSL). For each participant, the grey matter mask was registered to the perfusion image by a transformation matrix obtained by inverting the transformation matrix resulting from linear registration of the CSF image to the T1-weighted structural image with FLIRT13 (within FSL). For this registration, trilinear interpolation was used. The resulting grey matter mask in the subject’s functional space was thresholded at 0.5, to reduce partial volume contributions from white matter.
Statistics
In order to investigate the differences in aBV at the level of the Circle of Willis, we performed a three-way repeated measures ANOVA (RM-ANOVA) with three independent factors: physiological state (rest versus PEI), ROI (RMCA, LMCA, ACA, RPCA and LPCA) and cardiac phase (six different phases). To determine the differences in compliance during PEI we performed a two-way RM-ANOVA with only two independent factors: physiological state and ROI. To investigate changes in compliance during PEI and along the cerebrovascular tree, a two-way RM-ANOVA was performed with two independent factors: physiological state and slice. The dependent variable was the slice-by-slice calculated AC. A pairwise t-test was used to investigate whether there was a significant difference in grey matter CBF during rest and PEI. Unless stated otherwise, data are presented here as average ± standard deviation.
Microneurography
To measure muscle SNA (MSNA), peroneal microneurography was performed by an experienced microneurographer. Tungsten microelectrodes were inserted directly into the right peroneal nerve, where multiunit discharges from efferent sympathetic c-fibres were measured.21 A muscle sympathetic fascicle was identified when taps on the muscle belly or passive muscle stretch evoked mechanoreceptive impulses.22 Contamination from efferent discharges in skin sympathetic fibres was ruled out when auditory stimuli evoked no skin sympathetic discharges. MSNA was measured during 5 min of baseline, the IFC and PEI (12 min) and a 5-min recovery period. Physiological monitoring was the same as during the MRI scan session, except no respiratory belt to measure respiratory rate or nasal cannula to measure end-tidal gas concentrations was used.
MSNA was measured according to the methods described previously:22,23 participants were in supine position with a foam pad under their right thigh and MSNA was recorded from the right peroneal nerve at the fibular head using insulated tungsten microelectrodes. A muscle sympathetic fascicle was identified when taps on the muscle belly or passive muscle stretch evoked mechanoreceptive impulses, and no afferent neural response was evoked by skin stimuli. The recorded signal was amplified 80,000-fold, band-pass filtered (700 to 5000 Hz), rectified and integrated (resistance-capacitance integrator circuit time constant 0.1 s) by a nerve traffic analyser (NeuroAmp EX and PowerLab 8/35, ADInstruments, Bella Vista, Australia). MSNA data were recorded with LabChart 7 (ADInstruments, Bella Vista, Australia) and analysed with in-house written scripts (Spike 2, Cambridge Electronic Design, Cambridge, UK) to yield burst frequency (bursts/100 heartbeats).
Results
All the eight participants attended two study sessions; one microneurography session to measure the MSNA and one MRI session to measure AC and CBF during PEI. There was one participant for which the MSNA measurement was unsuccessful and another participant who did not complete the CBF measurement during PEI.
Figure 1 shows results of the main physiological parameters measured during the microneurography session (N = 7). BP increased during the IFC and remained elevated throughout the PEI period, as illustrated by the elevated MAP. MSNA, as measured by bursts/100 beats showed a steady increase during both the IFC and PEI, peaking at the end of PEI period (group average increase in MSNA: 111.7% ± 68.5%, t = 17 min compared to t = 5 min).
Figure 1.
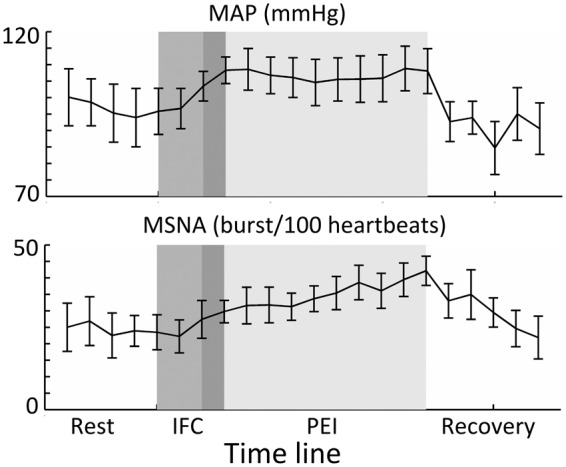
Group average data (N = 7) resulting from the MSNA sessions. In each of the sessions, there was a resting recording (of at least 3 min), followed by a 3-min period of IFC at 40% (middle grey) and a 10-min period of PEI (lightest grey). Note that there was 1 min of overlap (dark grey) between the IFC and occlusion with the brachial blood pressure cuff (PEI). In the top graph, it can be seen that mean arterial pressure (MAP) increases during IFC and remains elevated throughout PEI. In the bottom graph, it can be seen that MSNA shows a steady increase from baseline to a maximum at the end of PEI. Error bars indicate SEM.
During the MRI session to measure AC, MAP was significantly elevated during PEI compared with rest (96.9 ± 11.3 mmHg vs. 87.7 ± 8.9 mmHg, paired t-test, p < 0.05), while there was no significant difference in PP (57.0 ± 6.8 mmHg vs. 58.1 ± 6.7 mmHg, p > 0.05). Other relevant physiological measurements are summarised in Table 1.
Table 1.
Relevant physiological parameters (average ± standard deviation) for the rest and PEI periods during acquisition of the AC and CBF measurements.
| Arterial compliance (N = 8) |
Cerebral blood flow (N = 7) |
Microneurography (N = 7) |
||||
|---|---|---|---|---|---|---|
| Rest | PEI | Rest | PEI | Rest | PEI | |
| BPSys (mmHg) | 126.4 ± 9.5 | 134.9 ± 11.0a | 132.1 ± 10.1 | 135.1 ± 16.1 | 130.8 ± 22.6 | 147.8 ± 19.8 |
| BPDia (mmHg) | 68.3 ± 9.3 | 77.9 ± 12.1a | 71.7 ± 8.1 | 76.9 ± 15.0 | 79.6 ± 13.9 | 86.2 ± 15.5 |
| PP (mmHg) | 58.1 ± 6.7 | 57.0 ± 6.8 | 60.4 ± 7.1 | 58.2 ± 9.0 | 51.4 ± 11.7 | 61.3 ± 10.4 |
| MAP (mmHg) | 87.7 ± 8.9 | 96.9 ± 11.3a | 91.8 ± 8.3 | 96.3 ± 14.8 | 96.8 ± 16.6 | 106.8 ± 16.2 |
| Heart rate (beats/min) | 58.7 ± 11.5 | 62.6 ± 12.6 | 56.3 ± 9.2 | 62.6 ± 11.3a | 53.3 ± 8.7 | 61.5 ± 11.2a |
| Breathing rate (breaths/min) | 16.4 ± 4.3 | 16.1 ± 5.6 | 16.6 ± 3.0 | 15.0 ± 5.6 | – | – |
| PET,CO2 (mmHg) | 38.1 ± 5.3 | 35.6 ± 5.6 | 35.5 ± 5.1 | 31.9 ± 4.8a | – | – |
Note that all average values stated here are calculated for a time period of approximately 10 min (for the duration of each scan). BPSys: systolic blood pressure; BPDia: diastolic blood pressure; PP: pulse pressure; MAP: mean arterial pressure; PET,CO2: end-tidal CO2 partial pressure; PEI: post exercise ischemia.
Significantly different (paired t-test, p < 0.05).
Results of the three-way RM-ANOVA investigating differences in aBV at the level of the circle of Willis are stated in Table 2. During PEI, there was a significant interaction between physiological state and cardiac phase (F(5,35) = 3.1, p < .05), indicating that aBV only decreases in certain cardiac phases (as illustrated by Figure 2). Further analysis revealed that, averaged over all arteries at the circle of Willis, systolic aBV showed a stronger decrease during PEI than diastolic aBV (ΔaBVDia =0.03 ± 0.1%v and ΔaBVSys = − 0.29 ± 0.1%v, paired t-test: p < 0.05). Peak MCA aBV values (in rest) ranged from 6 to 10%v. In comparison, an MCA segment with a diameter of 3 mm crossing a 3.5 × 3.5 × 7 mm3 axial voxel would give an aBV of 14.4%v. The group average values of aBV at the level of the Circle of Willis are on the order of 1%v and hereby reflect that aBV is calculated based on median ROI values.
Table 2.
Summary of main effects and interactions of the two- and three-way repeated measures ANOVAs performed in this study.
| Source | F statistic | p value | |
|---|---|---|---|
| Three-way RM-ANOVA investigating differences in aBV at the level of the Circle of Willis | Physiological state | F(1,7) = 2.1 | 0.192 |
| ROI | F(4,28) = 3.0 | 0.055 | |
| Cardiac phase | F(5,35) = 5.9 | 0.002a | |
| Physiological state × ROI | F(4,28) = 0.6 | 0.675 | |
| Physiological state × Cardiac phase | F(5, 35) = 3.1 | 0.028a | |
| ROI × Cardiac phase | F(20, 140) = 0.6 | 0.866 | |
| Physiological state × ROI × Cardiac phase | F(20, 140) = 1.4 | 0.177 | |
| Two-way RM-ANOVA investigating differences in AC at the level of the Circle of Willis | Physiological state | F(1,7) = 10.7 | 0.014a |
| ROI | F(4,28) = 2.0 | 0.139 | |
| Physiological state × ROI | F(4,28) = 2.6 | 0.082 | |
| Two-way RM-ANOVA investigating differences in AC over six different slices | Physiological state | F(1,7) = 5.7 | 0.048a |
| Slice | F(5,35) = 4.7 | 0.004a | |
| Physiological state × Slice | F(5,35) = 3.2 | 0.017a |
RM-ANOVA: repeated measures analysis of variance; aBV: arterial blood volume; ROI: region of interest; AC: arterial compliance.
Significant results (p < 0.05).
Figure 2.

Fitted aBV (%v) per cardiac phase (ϕc). Group average values (N = 8) are shown for the arteries in a single slice containing the Circle of Willis, indicated by the inlay in the upper right corner. The angiogram in the centre illustrates the locations of the cerebral arteries. During PEI, aBV was particularly lower during systole (ϕc = 5), while there was no decrease in aBV during diastole (ϕc = 1), indicating that PEI is related to a decrease in AC by affecting the aBV at higher BP (note that BPSys > BPDia). Error bars indicate SEM. aBV: arterial blood volume; BP: blood pressure; PEI: post exercise ischemia.
At the level of the Circle of Willis, there was a significant decrease in AC during PEI (RM-ANOVA, F(1,7) = 10.7, p < 0.02, see Figure 3). However, there was no significant difference in compliance between the different arteries (RM-ANOVA, F(4,28) = 2.0, p = 0.14). The latter suggests that there are no differences in compliance between the arteries branching from the Circle of Willis. However, separate one-way ANOVAs for Rest and PEI, with ROI as independent variable, revealed that although there were no significant differences in compliance between flow territories in Rest (F(4,28) = 0.749, p = 0.53), the bilateral posterior cerebral arteries had significantly lower compliance than the anterior cerebral artery during PEI (p < 0.05, post-hoc paired t-tests after significant effect of ROI; F(4,28) = 5.06, p < 0.01). Example AC maps at the level of the Circle of Willis are plotted in Figure 4.
Figure 3.

Top row: Arterial compliance (AC) for the middle, posterior and anterior arteries at the level of the Circle of Willis in rest and during PEI. Each dot represents data from one participant (N = 8). Each graph contains a line that illustrates no change in AC (ACRest = ACPEI). It can be seen that during PEI AC decreases, as was also illustrated by repeated measures ANOVA, where there was a significant main effect of PEI on AC (F(1,7) = 10.7, p < 0.02). Bottom: an example of an angiogram indicating the location of the slice at the level of the Circle of Willis (CoW). RMCA & LMCA: right and left middle cerebral arteries; ACA: anterior cerebral artery; RPCA & LPCA: right and left posterior cerebral artery.
Figure 4.

Example of T1-weighted structural image with AC maps overlaid in Rest and during PEI for a single subject. Note that the AC maps are masked with the ROIs as defined by the average aBV images (see Methods section for details of ROI formation). In addition, the maps are thresholded to show voxels with positive AC. It can be seen that AC decreases during PEI. A: anterior; P: posterior.
When averaging AC together for the ROI proximal to the Circle of Willis, encompassing the internal carotid and basilar arteries, and the right and left MCA at the level of and distal to the Circle of Willis, it can be seen that during PEI on average the larger, proximal arteries show a decrease in AC, while the arteries distal to the Circle of Willis show little change in average compliance (see Figure 5). The two-way RM-ANOVA showed a significant interaction between physiological state and slice (F(5,35) = 3.2, p < 0.02), with post-hoc paired t-tests showing a significant decrease in compliance at the level of the Circle of Willis (p < 0.05).
Figure 5.

Group average aBVDia, aBVSys and AC plotted against slice location from two slices below to three slices above the CoW. On the right, an example of the slice locations is overlaid on an angiogram for a single subject. Note that the data are averaged over the ROIs of the major brain feeding arteries below the Circle of Willis (internal carotid and basilar/vertebral arteries) and both RMCA and LMCA above the CoW. Although none of the ROIs show a change in aBVDia, the larger and more proximal arteries show a decrease in aBVSys during PEI. Note that this leads to the figure on the right, where it can be seen that the arteries below and at the level of the CoW show a decrease in AC during PEI, while the MCAs more distal from the CoW show no decrease in AC during PEI. Error bars indicate SEM. AC: Arterial compliance; PEI: Post exercise ischemia; CoW: Circle of Willis.
The main effects and interactions of the RM-ANOVAs in this study are summarised in Table 2.
Whole brain grey matter CBF was not significantly different during PEI (CBFRest = 52.1 ± 6.8 ml/100 g/min, CBFPEI = 57.8 ± 19.1 ml/100 g/min, paired t-test p = 0.450).
Discussion
We have shown for the first time that, using our recently introduced method of non-invasive measurement of AC,10 the large arteries proximal to and at the level of the Circle of Willis are important determinants of cerebrovascular resistance in humans. That is, increased cerebrovascular resistance during a manoeuvre that triggers both an increase in BP and sympathetic nerve activity in humans (PEI) is caused by decreased compliance of the major arteries supplying the brain. Moreover, during PEI there was no change in compliance in arteries distal to the Circle of Willis. Finally, we also observed that there was no change in CBF, during a period of increased BP and SNA; consequently, these changes in compliance (or resistance) of the cerebral larger arteries are likely to be an important contributor to autoregulation.
Origin of increased cerebrovascular resistance
The compliance of the cerebral arteries at the level of the Circle of Willis shows a significant decrease during PEI, as is illustrated by Figure 3. The decrease in compliance is likely to be caused by an increase in SMC tone within the vessel walls. However, as can be seen in Figures 2 and 5, it is mainly aBVSys that is affected by the increase in SMC tone and no change of aBVDia occurs. This result may be explained by the fact that mechanical properties of arterial walls are dependent on three tissues: collagen, elastin and SMCs.24 During arterial wall distension, collagen and elastin are the passive components and SMCs are the active or contractile components. Bank et al.24,25 measured the contribution of each of the individual components to the stiffness of the human brachial artery at different levels of intra-arterial pressure and smooth muscle tone. Their results showed that at lower transmural pressure (i.e. 70 mmHg), an increase in SMC tone does not change the mechanical properties of the arterial wall, but changes the relative contributions of the three components to the wall stiffness. The contribution of SMC to the stiffness of the arterial wall becomes larger and the contribution of collagen decreases. However, at higher transmural pressure (i.e. 100 mmHg), an increase in SMC tone also increases arterial wall stiffness,25 which would explain why here we find a significantly smaller change in average aBVDia than in aBVSys during PEI.
Increased tone of SMCs in the cerebral arterial walls can be caused by increased BP, as well as by increased sympathetic nerve activity. The decrease in cerebral compliance occurring in this study may be caused by the significant increases in BPSys and BPDia. From ex vivo experiments, it is known that in the absence of sympathetic stimulation, SMC also show a myogenic response: The contraction mechanism of the muscle cells is activated by stretch of the arterial walls induced by elevated BP.26 However, elevated sympathetic activity in the periphery (Figure 1, bottom image) correlates well with increased norepinephrine spill over measured in the cerebral vasculature in humans.27 Although there is an ongoing debate regarding the role of SNA in cerebral autoregulation in humans, the cerebral vasoconstriction found here may, therefore, also have been caused by sympathetic activity directed to the cerebral vasculature.28 The following paragraphs discuss whether here it is the increase in BP or the increase in sympathetic outflow that caused the decrease in compliance of the arteries proximal to and at the level of Circle of Willis during PEI.
It is difficult to assess whether the change in BP is causing the cerebrovascular vasoconstriction as found in this study. On the one hand, the increase in MAP during PEI was only + 10 mmHg. Osol et al.29 showed in vitro that when transmural pressure ranged from 60 to 140 mmHg in the absence of sympathetic stimulation there were only minor changes in rat PCA diameter (although wall tension did show a related increase). Osol’s results suggest that the increase in BP in the current experiment may not be sufficient to cause marked vasoconstriction in the cerebral arteries. On the other hand, the fact that the arteries distal to the Circle of Willis do not constrict may suggest that cerebral autoregulation has taken place: As a response to the PEI, proximal cerebral arteries increase their resistance to protect the distal cerebrovasculature1 and maintain CBF (no change in grey matter CBF is found here). As a result, the BP in the arteries distal to the Circle of Willis may not have changed and, therefore, there is no vasoconstriction. Intracranial BP measurements are necessary to investigate whether increased BP is contributing to the elevated SMC tone.
The fact that arteries distal to the Circle of Willis are unaffected during PEI while there is a decrease in compliance in the larger proximal cerebral arteries may be explained by the decrease in sympathetic perivascular stimulation along the cerebrovascular tree. From ex vivo and animal experiments, it is known that perivascular sympathetic nerves are surrounding the basal cerebral arteries but their density decreases along the cerebrovascular tree, such that parenchymal arterioles are not innervated by the sympathetic nervous system at all.7,30–33 Furthermore, Cipolla et al.31 demonstrated in rats that the difference in sensitivity to sympathetic stimulation lies in the presence of norepinephrine α1-receptors on the surface of SMC; while these receptors are abundant in SMC of the proximal MCA, SMC in the walls of pial arteries branching from the MCA contain progressively less of these vasoconstriction-related receptors. In addition, Baumbach et al.34 showed that in rabbits and cats only basal cerebral arteries show a marked vasoconstriction with an increase in sympathetic stimulation. In their experiment, Baumbach et al. controlled for potential myogenic responses from the SMC by directly stimulating sympathetic nerves such that there was no change in systemic BP. Although human equivalents of these animal experiments are difficult to perform, the results of the animal studies combined with the presence of sympathetic perivascular nerves in humans make it plausible that in the current PEI experiment the elevated sympathetic outflow, at least in part, is causing the decrease in AC in the larger cerebral arteries.
Only finding a significant difference in compliance between the bilateral PCA and ACA at the level of the Circle of Willis during PEI and not in rest (one-way RM-ANOVAs, Table 2) suggests that the PCAs have a higher reactivity to PEI than the ACA. What underlies this difference is unclear; it could reflect a difference in how increased MAP is buffered by the vertebral and basilar arteries, which have a major contribution to the blood supply of the PCA, compared with the internal carotid arteries, which are the main suppliers of the anterior circulation. Interestingly, the origin of sympathetic innervation of these major brain feeding arteries differs: The perivascular sympathetic nerves innervating the internal carotid arteries originate from the superior cervical ganglion, while those innervating the vertebral and basilar arteries originate from the stellate ganglion.7
Even in the absence of a conclusive explanation for the elevated SMC tone, this experiment shows the first in vivo evidence of the differential response of the human cerebrovasculature to increases in BP and sympathetic outflow. In order to separate the effects of both of these processes on the vasculature, a control experiment is necessary in which sympathetic outflow is altered without an increase in BP or vice versa.
Additional impacts of the measurement of cerebral AC
The majority of research into cerebral autoregulation in humans uses CBF velocity measurements by transcranial Doppler (TCD) ultrasound assessments of the MCA or PCA.1,9 Our non-invasive measurement of cerebral AC is able to give complementary information to the existing body of research as it is able to address the major assumption of constant MCA diameter in studies using TCD ultrasound. As an example, Ainslie et al.9 used a similar hand grip task as is used here to investigate changes in blood flow through the MCA with TCD ultrasound and found that this task does not change the peak flow velocity within the MCA but does increase cerebrovascular resistance (as assessed by dividing MAP by peak flow velocity). It is important to note that Ainslie et al. assume that no vasoconstriction of the MCA has taken place because of the difficulty of assessing this with TCD ultrasound. Our results of decreased aBVSys, and therefore decreased compliance, at the level of the M1 segment of the MCA suggest that there is in fact a change in systolic MCA diameter. However, as Ainslie et al.,9 we also find an increase in cerebrovascular resistance (decrease in compliance). An important aspect from our experiment is that because of the inclusion of a volumetric measure (aBV), our data illustrate that it is an increase in cerebrovascular tone of the MCA contributing to increased cerebrovascular resistance during PEI.
AC is also an important marker of cerebrovascular health. Compliant arteries smooth out the pulsatile blood flow originating from the heart to ensure almost continuous blood flow through the capillary bed of the brain.35,36 Continuous blood flow within the brain parenchyma ensures optimal exchange of oxygen, nutrients and metabolites.35 With decreasing compliance, i.e. increasing arterial stiffness, blood flow within the cerebral microvasculature becomes increasingly pulsatile which can have detrimental effects. The increased pulsatile stress can lead to damage of small vessel walls which in turn can underlie severe cerebrovascular pathologies such as cerebral small vessel disease,37 vascular cognitive impairment (dementia and Alzheimer’s Disease)38 and cerebral aneurysms.39 Our compliance measurement may, therefore, be an important non-invasive imaging marker of cerebrovascular health.
Methodological considerations
Using peripheral BP as a surrogate for cerebral BP is not optimal, in particular since it is known that in young people PP in the common carotid is often lower than brachial PP.40 Moreover, distal to the common carotid artery PP decreases even further to ensure that there is (almost) constant pressure and flow in the capillary bed of the brain.35,36 Note that, due to the inverse relationship between compliance and PP, overestimating the latter by using brachial measurements leads to underestimation of local compliance of the cerebral arteries. In particular, this may suggest that with the decrease in PP along the cerebrovascular tree compliance of the arteries above the Circle of Willis may not be lower than compliance of more proximal larger arteries, as we have found here. However, the differential response of the different size arteries to PEI is still valid because there was no significant difference in PP between rest and PEI during the compliance measurement, despite the increase in MAP of approximately 10 mmHg. Note that we assume that there is no change in the decrease of the PP along the vascular tree with increasing MAP.
Although here we were able to assess compliance in cerebral arteries, including those branching from the Circle of Willis, the current set-up does not allow for reliable measurement of compliance within the smaller and more distal arterioles. Contributing to this is the longer transit time of the blood from the labelling location in the neck to the arterioles distal to the Circle of Willis (>600 ms),18,41 with respect to our maximal TI (TI = 850 ms). From this data set we can, therefore, not comment on the extent to which, in addition to the major cerebral arteries proximal to the Circle of Willis, the more distal arterioles play a role in maintaining cerebral perfusion.
Although IFC followed by PEI has shown to be an appropriate stimulus to decrease AC of the large cerebral arteries and can be used to investigate cerebral autoregulation, its use is limited because of the variable effects on whole body physiology when repeated. This variability is illustrated by the not significant increase in MAP and the decrease in end-tidal partial pressure of carbon dioxide when the intervention was performed a second time for the CBF measurement here. The former suggests that young healthy men habituate to this stimulus by performing two 40% handgrip tasks consecutively, which is strengthened by not finding a significant difference in gripping strength between the first and second handgrip (paired t-test of average grip strength, p = 0.31, data not shown). In addition, participants may change their breathing during IFC followed by PEI, which affects the end-tidal partial pressures of gases. Future experiments investigating cerebral autoregulation should include physiological challenges that target MAP and SNA, while controlling other physiological variables.
To summarise, the work presented here has demonstrated the utility of our recently introduced method of measuring cerebral AC to assess the differential response of the human cerebrovasculature to PEI. The major cerebral arteries show a significant decrease in AC, while there was no change in the smaller arteries distal to the Circle of Willis. The decrease in compliance is caused by an increase in tone of SMCs within the vessel walls, but further investigation is required to clarify whether this was due to the increase in sympathetic outflow or BP, or a combination of both. However, this study illustrates the application of our non-invasive measurement of cerebral AC and demonstrates for the first time in humans the importance of the largest cerebral arteries in autoregulation.
Author Note
There are ethical restrictions on the data, and the authors do not have ethical approval to make the data publicly available. The authors can share the anonymised data set with interested researchers upon request. Please send requests via email to the corresponding author.
Authors’ Contributions
Planning and design of experiments: EW, EH, RW. Performing experiments: EW, EH. Data analysis: EW, EH, KM. Writing paper: EW, EH, JH, KM, RW.
Declaration of conflicting interests
The author(s) declared no potential conflicts of interest with respect to the research, authorship, and/or publication of this article.
Funding
EW received support from a President’s Research Scholarship from Cardiff University, EH received support from the British Heart Foundation [IBSRF FS/11/1/28400], KM received support from the Wellcome Trust [090199] and RW received funding from the Higher Education Funding Council of Wales.
References
- 1.Willie CK, Tzeng Y-C, Fisher JA, et al. Integrative regulation of human brain blood flow. J Physiol 2014; 592: 841–859. [DOI] [PMC free article] [PubMed] [Google Scholar]
- 2.Fog M. The relationship between the blood pressure and the tonic regulation of the pial arteries. J Neurol Psychiatry 1938; 1: 187–197. [DOI] [PMC free article] [PubMed] [Google Scholar]
- 3.Mchedlishvili GI, Mitagvaria NP, Ormotsadze LG. Vascular mechanisms controlling a constant blood supply to the brain (“Autoregulation”). Stroke 1973; 4: 742–750. [DOI] [PubMed] [Google Scholar]
- 4.Faraci FM, Heistad DD, Mayhan WG. Role of large arteries in regulation of blood flow to brain stem in cats. J Physiol 1987; 387: 115–123. [DOI] [PMC free article] [PubMed] [Google Scholar]
- 5.Toda N. Alpha adrenergic receptor subtypes in human, monkey and dog cerebral arteries. J Pharmacol Exp Ther 1983; 226: 861–868. [PubMed] [Google Scholar]
- 6.Umeyama T, Kugimiya T, Ogawa T, et al. Changes in cerebral blood flow estimated after stellate ganglion block by single photon emission computed tomography. J Auton Nerv Syst 1995; 50: 339–346. [DOI] [PubMed] [Google Scholar]
- 7.Sándor P. Nervous control of the cerebrovascular system: doubts and facts. Neurochem Int 1999; 35: 237–259. [DOI] [PubMed] [Google Scholar]
- 8.Sander M, Macefield VG, Henderson LA. Cortical and brain stem changes in neural activity during static handgrip and postexercise ischemia in humans. J Appl Physiol 2010; 108: 1691–1700. [DOI] [PubMed] [Google Scholar]
- 9.Ainslie PN, Ashmead JC, Ide K, et al. Differential responses to CO2 and sympathetic stimulation in the cerebral and femoral circulations in humans. J Physiol 2005; 566: 613–624. [DOI] [PMC free article] [PubMed] [Google Scholar]
- 10.Warnert EAH, Murphy K, Hall JE, et al. Noninvasive assessment of arterial compliance of human cerebral arteries with short inversion time arterial spin labeling. J Cereb Blood Flow Metab 2015; 35: 461–468. [DOI] [PMC free article] [PubMed] [Google Scholar]
- 11.Thiele RH, Nemergut EC, Lynch C. The physiologic implications of isolated alpha1 adrenergic stimulation. Anesth Analg 2011; 113: 284–296. [DOI] [PubMed] [Google Scholar]
- 12.Luh WM, Wong EC, Bandettini PA, et al. QUIPSS II with thin-slice TI1 periodic saturation: a method for improving accuracy of quantitative perfusion imaging using pulsed arterial spin labeling. Magn Reson Med 1999; 41: 1246–1254. [DOI] [PubMed] [Google Scholar]
- 13.Jenkinson M, Bannister P, Brady M, et al. Improved optimization for the robust and accurate linear registration and motion correction of brain images. Neuroimage 2002; 17: 825–841. [DOI] [PubMed] [Google Scholar]
- 14.Myllylä T, Korhonen V, Vihriälä E, et al. Human heart pulse wave responses measured simultaneously at several sensor placements by two MR-compatible fibre optic methods. J Sens 2012; 2012: 1–8. [Google Scholar]
- 15.Holdsworth DW, Norley CJ, Frayne R, et al. Characterization of common carotid artery blood-flow waveforms in normal human subjects. Physiol Meas 1999; 20: 219–240. [DOI] [PubMed] [Google Scholar]
- 16.Wong EC, Buxton RB, Frank LR. Quantitative imaging of perfusion using a single subtraction (QUIPSS and QUIPSS II). Magn Reson Med 1998; 39: 702–708. [DOI] [PubMed] [Google Scholar]
- 17.Chappell MA, MacIntosh BJ, Donahue MJ, et al. Separation of macrovascular signal in multi-inversion time arterial spin labelling MRI. Magn Reson Med 2010; 63: 1357–1365. [DOI] [PubMed] [Google Scholar]
- 18.Warnert EA, Harris AD, Murphy K, et al. In vivo assessment of human brainstem cerebrovascular function: a multi-inversion time pulsed arterial spin labelling study. J Cereb Blood Flow Metab 2014; 36: 956–963. [DOI] [PMC free article] [PubMed] [Google Scholar]
- 19.Smith SM, Brady JM. SUSAN – a new approach to low level image processing. Int J Comput Vis 1997; 23: 45–78. [Google Scholar]
- 20.Zhang Y, Brady M, Smith S. Segmentation of brain MR images through a hidden Markov random field model and the expectation-maximization algorithm. IEEE Trans Med Imaging 2001; 20: 45–57. [DOI] [PubMed] [Google Scholar]
- 21.Vallbo AB, Hagbarth K-E, Wallin BG. Microneurography: how the technique developed and its role in the investigation of the sympathetic nervous system. J Appl Physiol 2004; 96: 1262–1269. [DOI] [PubMed] [Google Scholar]
- 22.Sundlöf G, Wallin BG. The variability of muscle nerve sympathetic activity in resting recumbent man. J Physiol 1977; 272: 383–397. [DOI] [PMC free article] [PubMed] [Google Scholar]
- 23.Hart EC, Wallin BG, Barnes JN, et al. Sympathetic nerve activity and peripheral vasodilatator capacity in young and older men. Am J Physiol Heart Circ Physiol 2014; 306: H904–H909. [DOI] [PubMed] [Google Scholar]
- 24.Bank AJ, Wang H, Holte JE, et al. Contribution of collagen, elastin, and smooth muscle to in vivo human brachial artery wall stress and elastic modulus. Circulation 1996; 94: 3263–3270. [DOI] [PubMed] [Google Scholar]
- 25.Bank AJ, Wilson RF, Kubo SH, et al. Direct effects of smooth muscle relaxation and contraction on in vivo human brachial artery elastic properties. Circ Res 1995; 77: 1008–1016. [DOI] [PubMed] [Google Scholar]
- 26.Webb RC. Smooth muscle contraction and relaxation. Adv Physiol Educ 2003; 27: 201–206. [DOI] [PubMed] [Google Scholar]
- 27.Ferrier C, Esler MD, Eisenhofer G, et al. Increased norepinephrine spillover into the jugular veins in essential hypertension. Hypertension 1992; 19: 62–69. [DOI] [PubMed] [Google Scholar]
- 28.Hart EC, Joyner MJ, Wallin BG, et al. Sex, ageing and resting blood pressure: gaining insights from the integrated balance of neural and haemodynamic factors. J Physiol 2012; 590: 2069–2079. [DOI] [PMC free article] [PubMed] [Google Scholar]
- 29.Osol G, Brekke JF, McElroy-Yaggy K, et al. Myogenic tone, reactivity, and forced dilatation: a three-phase model of in vitro arterial myogenic behavior. Am J Physiol Heart Circ Physiol 2002; 283: H2260–H2267. [DOI] [PubMed] [Google Scholar]
- 30.Hamel E. Perivascular nerves and the regulation of cerebrovascular tone. J Appl Physiol 2006; 100: 1059–1064. [DOI] [PubMed] [Google Scholar]
- 31.Cipolla MJ, Li R, Vitullo L. Perivascular innervation of penetrating brain parenchymal arterioles. J Cardiovasc Pharmacol 2004; 44: 1–8. [DOI] [PubMed] [Google Scholar]
- 32.Faraci FM, Heistad DD. Regulation of large cerebral arteries and cerebral microvascular pressure. Circ Res 1990; 66: 8–17. [DOI] [PubMed] [Google Scholar]
- 33.Pires PW, Dams Ramos CM, Matin N, et al. The effects of hypertension on the cerebral circulation. Am J Physiol Hear Circ Physiol 2013; 304: 1598–1614. [DOI] [PMC free article] [PubMed] [Google Scholar]
- 34.Baumbach GL, Heistad DD. Effects of sympathetic stimulation and changes in arterial pressure on segmental resistance of cerebral vessels in rabbits and cats. Circ Res 1983; 52: 527–533. [DOI] [PubMed] [Google Scholar]
- 35.Hall JE, Guyton AC. Vascular distensibility and functions of the arterial and venous systems. Textbook of medical physiology, Philadelphia: Elsevier Inc, 2006, pp. 171–180. [Google Scholar]
- 36.Santisakultarm TP, Cornelius NR, Nishimura N, et al. In vivo two-photon excited fluorescence microscopy reveals cardiac- and respiration-dependent pulsatile blood flow in cortical blood vessels in mice. Am J Physiol Heart Circ Physiol 2012; 302: H1367–H1377. [DOI] [PMC free article] [PubMed] [Google Scholar]
- 37.Pantoni L, Garcia JH. Pathogenesis of leukoaraiosis: a review. Stroke 1997; 28: 652–659. [DOI] [PubMed] [Google Scholar]
- 38.Nation DA, Wierenga CE, Clark LR, et al. Cortical and subcortical cerebrovascular resistance index in mild cognitive impairment and Alzheimer’s disease. J Alzheimers Dis 2013; 36: 689–698. [DOI] [PMC free article] [PubMed] [Google Scholar]
- 39.Dusak A, Kamasak K, Goya C, et al. Arterial distensibility in patients with ruptured and unruptured intracranial aneurysms: is it a predisposing factor for rupture risk? Med Sci Monit 2013; 19: 703–709. [DOI] [PMC free article] [PubMed] [Google Scholar]
- 40.Laurent S, Cockcroft J, Van Bortel L, et al. Expert consensus document on arterial stiffness: methodological issues and clinical applications. Eur Heart J 2006; 27: 2588–2605. [DOI] [PubMed] [Google Scholar]
- 41.Ho YCL, Petersen ET, Golay X. Measuring arterial and tissue responses to functional challenges using arterial spin labeling. Neuroimage 2010; 49: 478–487. [DOI] [PubMed] [Google Scholar]