

Abstract
Cell growth and proliferation depend upon many different aspects of lipid metabolism. One key signaling pathway that is utilized in many different anabolic contexts involves Phosphatidylinositide 3-kinase (PI3K) and its membrane lipid products, the Phosphatidylinositol (3,4,5)-trisphosphates. It remains unclear, however, which other branches of lipid metabolism interact with the PI3K signaling pathway. Here, we focus on specialized fat metabolizing cells in Drosophila called larval oenocytes. In the presence of dietary nutrients, oenocytes undergo PI3K-dependent cell growth and contain very few lipid droplets. In contrast, during starvation, oenocytes decrease PI3K signaling, shut down cell growth and accumulate abundant lipid droplets. We now show that PI3K in larval oenocytes, but not in fat body cells, functions to suppress lipid droplet accumulation. Several enzymes of fatty acid, triglyceride and hydrocarbon metabolism are required in oenocytes primarily for lipid droplet induction rather than for cell growth. In contrast, a very long chain fatty-acyl-CoA reductase (FarO) and a putative lipid dehydrogenase/reductase (Spidey, also known as Kar) not only promote lipid droplet induction but also inhibit oenocyte growth. In the case of Spidey/Kar, we show that the growth suppression mechanism involves inhibition of the PI3K signaling pathway upstream of Akt activity. Together, the findings in this study show how Spidey/Kar and FarO regulate the balance between the cell growth and lipid storage of larval oenocytes.
Author Summary
Lipids play diverse roles in health and disease. Some types of lipids function as metabolic fuels for energy homeostasis, whereas others act as components of cell membranes or serve as signals regulating cell behaviors. Much, however, remains to be discovered about the molecular connections between different categories of lipids. Phosphatidylinositide 3-kinase (PI3K) is an enzyme that synthesizes phosphatidylinositide lipids, which act as signals essential for growth during normal development and cancer. Using genetics in the fruit fly, Drosophila, we identify new regulatory links between phosphatidylinositides and lipid oxidoreductases in specialized fat-metabolizing cells called oenocytes. We find that an enzyme metabolizing very long chain fatty acids (VLCFAs) and also a putative lipid dehydrogenase/reductase both act to prevent the inappropriate overgrowth of oenocytes. In the case of the latter enzyme, it suppresses cell growth by inhibiting phosphatidylinositide signaling. Future studies will determine whether similar lipid enzymes regulate PI3K signaling in other cell and tissue types during normal development and tumorigenesis.
Introduction
The regulation of cell growth is fundamentally important for a wide range of biological processes [reviewed in 1, 2, 3]. A key signal transduction network regulating cell growth and proliferation in response to nutrients involves two related kinases, Target-of-Rapamycin (TOR) and Class I phosphatidylinositol 3-kinase (PI3K) [4–7]. A variety of nutritional and growth factor stimuli are known to activate PI3K, which converts the membrane phospholipid phosphatidylinositol-4,5-bisphosphate (PIP2) into phosphatidylinositol-3,4,5-trisphosphate (PIP3) [8]. Levels of PIP3 are kept in check by Phosphatase and Tensin Homologue (PTEN), which hydrolyzes PIP3 back to PIP2. PIP3 is a signaling lipid that stimulates plasma membrane recruitment of proteins with PIP3-specific pleckstrin homology (PH) domains such as Akt (also known as protein kinase B) and phosphoinositide-dependent kinase 1 (PDK1). The colocalization of Akt and PDK1 at the membrane surface increases the rate at which PDK1 phosphorylates Akt at a regulatory site essential for its activation [9]. Activated Akt is then able to phosphorylate numerous targets in the TOR/PI3K network, including Forkhead box subgroup O (FoxO) transcription factors and Tuberous Sclerosis Complex 2 (TSC2), an inhibitor of TOR [reviewed in 10]. Akt phosphorylation of both of these negative growth regulators attenuates their activities, thus promoting an increase in cell growth and biomass.
Drosophila melanogaster provide a useful genetic system for studying cell growth and PI3K signaling in the context of an intact organism. Tissue growth in Drosophila, as in mammals, depends upon the Insulin-like receptor (InR)/PI3K pathway and the interconnected amino-acid/TOR pathway [reviewed in 11, 12–15]. Class I PI3K is required for the growth of most if not all Drosophila tissues but the ways in which it is differentially regulated as a function of cell type and developmental stage are not yet fully clear. Nevertheless, some insights have been gained by experiments showing that there is selective tissue growth in larvae subjected to nutrient restriction (NR). At early larval stages, NR shuts down the growth of developing tissues, and prevents the stem cells of the central nervous system (neuroblasts) from re-entering the cell cycle after a period of quiescence [16–18]. At late larval stages, however, growth in neuroblast lineages is almost completely spared during NR, whereas it is approximately halved for the epithelial progenitors of adult structures (imaginal discs) and reduced to near zero in many other larval tissues [19, 20].
Among the larval tissues that are not spared during NR are two major organs of the Drosophila adipose axis: fat body cells (adipocytes) and oenocytes. The fat body provides the major storage depot in Drosophila for neutral lipids such as triglycerides, in the form of intracellular lipid droplets [21]. This tissue is important for the maintenance of energy homeostasis during starvation and acts as a nutrient sensor. Depending upon amino acid levels, the fat body can either store or release lipid nutrients into the hemolymph, in the form of lipoproteins [22–24]. Oenocytes are endocrine cells specialized for lipid metabolism [reviewed in 25, 26]. There are two morphologically distinct populations of Drosophila oenocytes, larval and adult (imaginal), each deriving from a separate pool of ectodermal progenitors [27–29]. Adult oenocytes synthesize species and sex-specific mixes of cuticular hydrocarbons that function in desiccation resistance and pheromonal communication [30–32]. These cuticular hydrocarbons are synthesized from very-long chain (VLC) fatty acids via a pathway requiring the cytochrome P450 enzyme Cyp4g1, a VLC fatty aldehyde decarbonylase [33, 34]. Larval oenocytes, on the other hand, are known to be essential for molting and synthesize VLC fatty acids required for waterproofing the tracheal system [35, 36]. Unlike most other cell types, larval oenocytes accumulate numerous lipid droplets during NR [35]. This oenocyte NR response resembles, at least superficially, the fasting-induced build up of neutral lipids (steatosis) observed in mammalian hepatocytes. In mammals, this steatosis is thought to be a physiological response to elevated lipolysis in adipose tissue. Similarly, in Drosophila, fat-body specific overexpression of an ortholog of Adipose Triglyceride Lipase (ATGL) is sufficient to induce steatosis in the oenocytes of fed larvae [35]. Hence, during NR, neutral lipid in the form of lipid droplets is lost from the fat body but gained by the oenocytes. The induction of lipid droplets during starvation requires the activity of the Lipophorin receptor (Lpr2) in oenocytes and so presumably involves the uptake of lipids released into the hemolymph [36]. It nevertheless remains unclear which tissue-specific signaling mechanisms allow neutral lipid content in the fat body and in oenocytes to be simultaneously regulated in opposite directions during starvation.
Here, we characterize novel regulatory interactions between PI3K signaling, lipid metabolism and cell growth in the context of the Drosophila adipose axis. Tissue-specific and clonal genetic analyses reveal that oenocytes respond to nutrition and PI3K signaling very differently from the fat body. PI3K signaling stimulates neutral lipid storage in fat body cells but it inhibits this process in oenocytes. We identify two lipid oxidoreductases that regulate the balance between lipid storage and cell size in oenocytes and show that one of these is part of an oenocyte-specific regulatory circuit that modulates PI3K-dependent cell growth.
Results
PI3K signaling inhibits lipid droplets in oenocytes but promotes them in fat body
When raised on an optimal diet, Drosophila larvae grow (increase mass) by more than two orders of magnitude as they develop through three instars (L1-L3) over a four-day (~96 hr) period. Fat body and oenocytes (Fig 1A), in common with many other larval tissues, grow via an increase in cell size and ploidy rather than by cell division [37, 38]. We first compared how oenocytes and fat body respond to PI3K signaling. To assess the cell-autonomous effects of class I PI3K signaling upon fat body cell size and intracellular lipid droplets, genetic mosaic larvae were generated via Flp/FRT mediated activation of the GAL4/UAS system (Flp-out clones). A previous study found that overexpressing PI3K (UAS-Dp110) in Flp-out clones in the fat body is sufficient to increase cell size in well-fed larvae [39]. During starvation it is known that neutral lipids, stored in intracellular lipid droplets, decrease in the fat body yet increase in oenocytes and neither tissue is able to grow significantly [19, 35]. To investigate the role of PI3K signaling in the regulation of lipid droplets during nutrient restriction (NR), larvae at the early-L3 stage (48hr after larval hatching) were switched from fed (yeast/cornmeal/agar) to NR (PBS/agarose) medium for 18 hr. Tissues were analyzed either at the early L3 stage (Fed48 control group) or 18 hr later (NR66 experimental and Fed66 control groups) (Fig 1B). NR applied at early L3 induces developmental arrest such that, for NR66 larvae, their chronologically matched control is Fed66 but their developmentally matched control is Fed48. Figures therefore show comparisons between Fed48 and NR66 larvae, although in most cases the Fed66 time point was also analyzed. Following 18 hr of NR, the size of fat body cells is decreased but they are only partially depleted of stored neutral fat and so still contain numerous lipid droplets [23, 35 and Fig 1C]. Overexpression of PI3K resulted in increases in fat body cell size, lipid droplet diameter and neutral lipid content following NR (Figs 1C, S1A and S2A). The converse manipulation, expressing a dominant-negative PI3K (Dp110DN) resulted in the expected decrease in fat body cell size but it did not significantly alter lipid droplet content in fed conditions (Figs 1D, S1B and S2B). These results together suggest that a decrease in PI3K signaling is needed for neutral lipid loss from the fat body during NR but that this change alone is not enough to drive lipid loss in the fed state.
Fig 1. PI3K signaling inhibits lipid droplets in oenocytes but promotes them in fat body.

(A) Cartoon of a Drosophila larva showing the principal organs of lipid metabolism: fat body (orange), oenocytes (green) and gut (gray). (B) Time line (0 hr to 96 hr) of development through the three larval instars (L1 to L3) with the experimental regimes of fed and nutrient restriction (NR) windows indicated beneath (Fed48, Fed66 and NR66). (C,D) Fat body flip-out clones marked with nlsGFP, nuclei stained with DAPI. Overexpressing PI3K (Dp110) in NR66 larvae (C) gives larger cells with larger lipid droplets (LipidTOX) than those in control clones. Expressing dominant-negative PI3K (Dp110DN) in Fed48 larvae (D) gives smaller cells with a similar density of lipid droplets (LipidTOX) as in control clones. (E, F) Oenocyte-cluster specific (PromE-GAL4) expression of wild-type (Dp110) or dominant-negative (Dp110DN) showing oenocyte morphology (mGFP), phospho-Akt staining (p-Akt) and lipid droplets (LipidTOX). In Fed48 larvae (E), oenocyte lipid droplets are largely absent but oenocyte size and membrane p-Akt expression are increased by Dp110 and decreased by Dp110DN expression. In NR66 larvae (F), lipid droplets are abundant in control and Dp110DN but not in Dp110 oenocyte clusters. NR oenocyte size is increased by Dp110 and decreased by Dp110DN. NR membrane p-Akt expression is dramatically increased in Dp110, compared to control larvae and Dp110DN-expressing oenocytes. Scale bar is 10 μm. In this and all subsequent figures, confocal images are projections of several sections unless stated otherwise. See S1 and S2 Figs for quantitations.
We next manipulated PI3K activity in oenocytes using a larval oenocyte-specific GAL4 driver (PromE-GAL4, [31, 36]). To monitor PI3K signaling levels during these manipulations, we used an antibody recognizing phospho-Akt (Ser505). Although technically challenging to detect, membrane localization of phospho-Akt provides a readout for most Akt activity [19, 40, 41]. Control GFP-labeled oenocyte clusters showed higher and more consistent expression of membrane phospho-Akt in Fed48 than in NR66 larvae, consistent with the known nutrient-dependence of PI3K/TOR signaling (Fig 1E and 1F). GFP-labeled oenocyte clusters with overactive PI3K signaling (PromE>Dp110) are very large in size in both Fed48 and NR66 larvae and this "giant oenocyte" phenotype is associated with increased expression and membrane localization of phospho-Akt (Figs 1E, 1F and S2C–S2F). Increased oenocyte size was also observed using a second method for boosting PI3K activity: expressing an activated myristoylated form of Akt (myr-Akt) in Flp-out clones (S2G Fig). Conversely, we found that dominant-negative PI3K (PromE>Dp110DN) decreases oenocyte size in both Fed48 and NR66 larvae and, in the latter context, p-Akt staining remains detectable, although weak and close to the limit of detection (Figs 1E, 1F and S2C–S2F). A similar cell size decrease is also observed in Flp-out clones expressing Dp110DN (S2G Fig). During NR, we observed that oenocytes not only express weak p-Akt but they also retain higher expression of a GFP sensor for PIP3 levels [tGPH, 39] and weaker nuclear FoxO expression than do fat body cells (S3 Fig). Oenocytes therefore sustain low-level PI3K signaling during NR. Nevertheless, decreasing this low level even further using Dp110DN does not significantly block the normal 100-fold increase in lipid droplets during NR, suggesting that it is not an obligate positive input (Figs 1F and S1C–S1E). Rather, PI3K signaling in oenocytes has primarily a negative input as Dp110DN induces a low level of lipid droplets in the fed state and Dp110 overexpression efficiently blocks them during NR (Figs 1E, 1F, S1D and S1E). In the context of adult oenocytes, it was reported that lipid droplet induction during starvation requires Insulin-like receptor activation via Ilp6 secreted from the adult fat body [42]. For larval oenocytes, however, we find that Ilp6 is not required for lipid droplet induction during NR (S4A and S4B Fig). Together, the results thus far demonstrate that artificial overactivation of PI3K is sufficient to stimulate NR growth of both cell types in the larval adipose axis but that it has opposite effects on NR fat storage in lipid droplets: inhibiting it in oenocytes yet promoting it in the fat body.
Many lipid metabolic enzymes regulate lipid droplets but not oenocyte size
Before determining how PI3K signaling inhibits lipid droplets in a tissue-specific manner, we first investigated the oenocyte droplet induction mechanism itself. We focused on the metabolism of VLCFAs as these are known to be synthesized selectively in larval oenocytes [35, 36 and Fig 2A]. Consistent with a previous study [36], in Fed48 larvae, PromE-GAL4 driven RNAi knockdown of the malonyl-CoA synthesizing enzyme Acetyl-CoA Carboxylase (Acc) significantly increased oenocyte lipid droplets (Figs 2B and S1F). This fed increase reflects an amount of lipid droplets per oenocyte that is considerably lower than that observed during NR in control larvae. It is known to be mediated via the uptake of fatty acids in fed larvae via Lpr2, a Lipophorin receptor [36]. Unexpectedly, in NR larvae, we observed that Acc knockdown decreased lipid droplet induction, suggesting that fatty acid synthesis makes a contribution to starvation-induced oenocyte steatosis (Figs 2B and S1G). In a previous study, Acc knockdown in oenocytes was also associated with tracheal flooding and systemic hypoxia [36]. Importantly, however, using our genetic and dietary conditions, the majority of larvae expressing PromE-GAL4 driven UAS-RNAi of Acc or other genes in this study do not display tracheal flooding even though knockdown efficiencies are over 90% (S4C and S5 Figs). As the PromE knockdown phenotypes described in our study are observed in most if not all larvae, they are highly unlikely to be a secondary consequence of hypoxia due to flooding of the trachea. Similar to Acc, knockdown of Diacylglycerol acyltransferase 1 (DGAT1), a dedicated enzyme in the synthesis of TAGs [43], gave a decrease in lipid droplet induction during NR in oenocytes (Figs 2B, S1F and S1G). Conversely, PromE overexpression of Lsd-2 (perilipin-2), a protein that inhibits lipolysis to promote TAG storage in lipid droplets [44], led to a statistically significant increase in oenocyte lipid droplets in Fed48 but not in NR larvae (Figs 2B, S1F and S1G). This suggests that there is active lipolysis in the fed state and that this may help to prevent the accumulation of lipid droplets. Cytochrome P450 4g1 (Cyp4g1), with its redox partner Cytochrome P450 reductase (Cpr), together form a microsomal holoenzyme involved in converting VLCFAs into hydrocarbons in the oenocytes of adults [33]. Strikingly, RNAi knockdowns for either enzyme or a Cyp4g1 loss-of-function mutation [35] attenuated lipid droplet induction during NR but had little effect in Fed48 larvae (Figs 2B, 2C and S1F–S1H). These results strongly suggest that the Cyp4g1/Cpr holoenzyme is required for the induction of lipid droplets in larval oenocytes during NR. We next tested whether any of the above lipid biosynthetic enzymes regulating oenocyte lipid droplets might also control oenocyte size during NR. However, no significant differences in oenocyte volume were observed with PromE driven overexpression of Lsd2 or RNAi knockdown of Acc, Dgat1, Cyp4g1 or Cpr (Fig 2D). Together with the previous results, this demonstrates regulation of oenocyte lipid droplets, not only by PI3K signaling but also by triglyceride and hydrocarbon biosynthetic enzymes. In contrast, regulation of oenocyte cell size is sensitive to PI3K signaling but not to the five tested triglyceride and hydrocarbon biosynthetic enzymes.
Fig 2. Fatty acid, triglyceride and hydrocarbon metabolism regulate oenocyte lipid droplets.

(A) Simplified presentation of the pathway for long chain (LCFA) and very long chain (VLCFA) fatty acid, triglyceride (TAG) and hydrocarbon synthesis. See text for details of the Drosophila enzymes (blue) analyzed in this study. The questionmark indicates that the enzyme activity of Kar has not yet been directly established. (B) Oenocyte clusters (mGFP labeled) from Fed48 and NR66 larvae expressing PromE-GAL4 driven UAS-RNAi for Acc, Dgat1, Cyp4g1 or Cpr indicating decreased or blocked induction of lipid droplets (LipidTOX) during NR. PromE-GAL4 driven UAS-Acc RNAi or UAS-Lsd2 are the only manipulations that gave a modest increase in oenocyte lipid droplets in Fed48 larvae. Scale bar is 10 μm (C) Oenocyte cluster from a Cyp4g1Δ4 hemizygous larva (Cyp4g1 mutant) showing a decrease in lipid droplet (Oil Red O) induction during NR. (D) Graph of relative oenocyte volumes for the five genetic manipulations in B showing no significant changes in cell size in NR66 larvae. In this and subsequent graphs, error bars represent 1 s.d. and asterisks show statistical significance in Student t tests (*p<0.05, and **p<0.001) compared to the black control bar unless otherwise indicated. See S1 Fig for quantifications.
Oenocyte Kar and FarO promote lipid droplets and suppress cell growth
We next extended the oenocyte genetic analysis to two enzymes, Kar and FarO, which are not dedicated to triglyceride or hydrocarbon production but to more general roles in the synthesis of VLCFAs, VLCF aldehydes and VLCF alcohols (Fig 2A). CG1444 encodes a protein with YXXXK catalytic and putative NADH binding motifs found in many enzymes of the short-chain reductase/dehydrogenase (SDR) family [45]. It has been reported to encode the only predicted 3-ketoacyl-CoA reductase (Kar) in the Drosophila melanogaster genome and is required in larval oenocytes for the synthesis of a putative VLCFA implicated in tracheal waterproofing and also in adult oenocytes for the synthesis of VLCFA-derived cuticular hydrocarbons [34, 36]. However, the activities and substrate specificities of the Kar enzyme (also known as Spidey) have yet to be directly determined. We raised an antibody against Kar and observed that the levels of Kar protein are substantially attenuated but nevertheless remain expressed in oenocytes during NR, whereas Acc levels do not noticeably change between fed and NR (Fig 3A). Kar protein levels are also moderately decreased when PI3K signaling is inhibited in the oenocytes of Fed48 larvae (Fig 3B). Hence, dietary nutrients and PI3K signaling not only regulate lipid droplet accumulation in oenocytes but also Kar expression. Another enzyme of VLCFA metabolism, fatty acyl-CoA reductase, converts fatty acyl-CoA esters into fatty alcohols. CG18031 encodes one of several predicted fatty acyl-CoA reductases in Drosophila. It is selectively expressed in oenocytes [35] and will therefore be referred to as FarO. It encodes a protein with a Rossmann–fold NAD(P)H binding domain with a [ST]GXXGXXG motif and also a YXXXK active site motif as found in other fatty–acyl–CoA reductases (Fig 3C). Drosophila FarO produced from a recombinant baculovirus in Sf9 cells is a microsomal enzyme that, in the presence of NADH or NADPH, can convert tetracosanoic-CoA ester (C24:0-CoA) to a product with an elution time identical to that of tetracosanol (C24:0) (Fig 3D and 3E). Recombinant FarO also produced alcohols from C26:0-CoA, as well as from C26:0 and C28:0 fatty acids pre-incubated with CoA-SH. These biochemical experiments demonstrate that FarO is a fatty acyl-CoA reductase that reduces VLCFA-CoAs to VLCF alcohols.
Fig 3. Kar is regulated by nutrients and FarO is a VLC fatty acyl-CoA reductase.

(A,B) Nutrients and PI3K signaling are required for maximal Kar expression. (A) Kar protein is expressed more strongly in oenocytes from Fed48 than from NR66 larvae, whereas Acc protein levels do not change so noticeably. (B) Kar protein levels decrease in Fed48 larvae following inhibition of PI3K activity (PromE>Dp110DN). (C) FarO amino acid sequence showing three regions (bold) incorporating the diagnostic Rossman Fold and YXXXK containing catalytic motif and the peptide used to produce polyclonal antisera (underlined). (D) Western blot of microsomes or supernatants (sol.) of Sf9 cell lysates infected with recombinant baculovirus encoding either FarO or housefly CPR at different multiplicities of infection (MOI), probed with anti-FarO antibody. (E) GC traces of extracts from functional assays of recombinant FarO or CPR (negative control) incubated with 24:0-CoA. Reactions with FarO yielded a product with an identical migration to that of a 24:0 alcohol standard.
We next tested the effects of knocking down Kar or FarO with RNAi. In the fat body, RNAi Flp-out clones for Kar or FarO did not detectably alter lipid droplets or cell size during NR (S6A Fig). In oenocytes, however, RNAi knockdown of either gene did give a phenotype using PromE-GAL4 or a second tissue-selective driver (see Materials and Methods). Knockdown of Kar but not FarO was associated with a significant increase of lipid droplets in the fed state, to a low level similar to that observed with Acc knockdown (Figs 4A and S1I). Nevertheless, the knockdown of either Kar or FarO strongly decreased the accumulation of oenocyte lipid droplets during NR (Figs 4A and S1J). Using a second genetic method, Flp-out clones, FarO RNAi was also observed to abrogate oenocyte droplet induction (S6B and S6C Fig). Together, these findings demonstrate that the lipid reductases/dehydrogenases Kar and FarO are both required in oenocytes for the induction of lipid droplets during NR. Strikingly, we also observed that RNAi knockdown of either Kar or FarO with PromE-GAL4 markedly increases the volume of Fed48 or NR66 oenocytes (Fig 4A insets and 4B). Control and knockdown oenocytes are similar in size prior to larval hatching (0 hr) so excessive oenocyte size likely reflects a greater volume gain (i.e growth rate) during the first 48 hr of larval development. However, by 66 hr (Fed66), Kar and FarO knockdown oenocyte sizes are no longer significantly different from controls, even though oenocyte size remains PI3K-dependent at this later developmental stage (S6D and S6E Fig). Given that controls catch up in size with knockdown oenocytes by 66hr, it may be that Kar or FarO RNAi do not alter final oenocyte size at the end of larval development (96 hr). We conclude more generally that, even though many oenocyte enzymes involved in triglyceride and hydrocarbon biosynthesis do not influence cell size, the two lipid oxido reductases Kar and FarO both play a key role in preventing excessive cell growth during early larval development.
Fig 4. Kar and FarO decrease oenocyte size and stimulate lipid droplet induction.
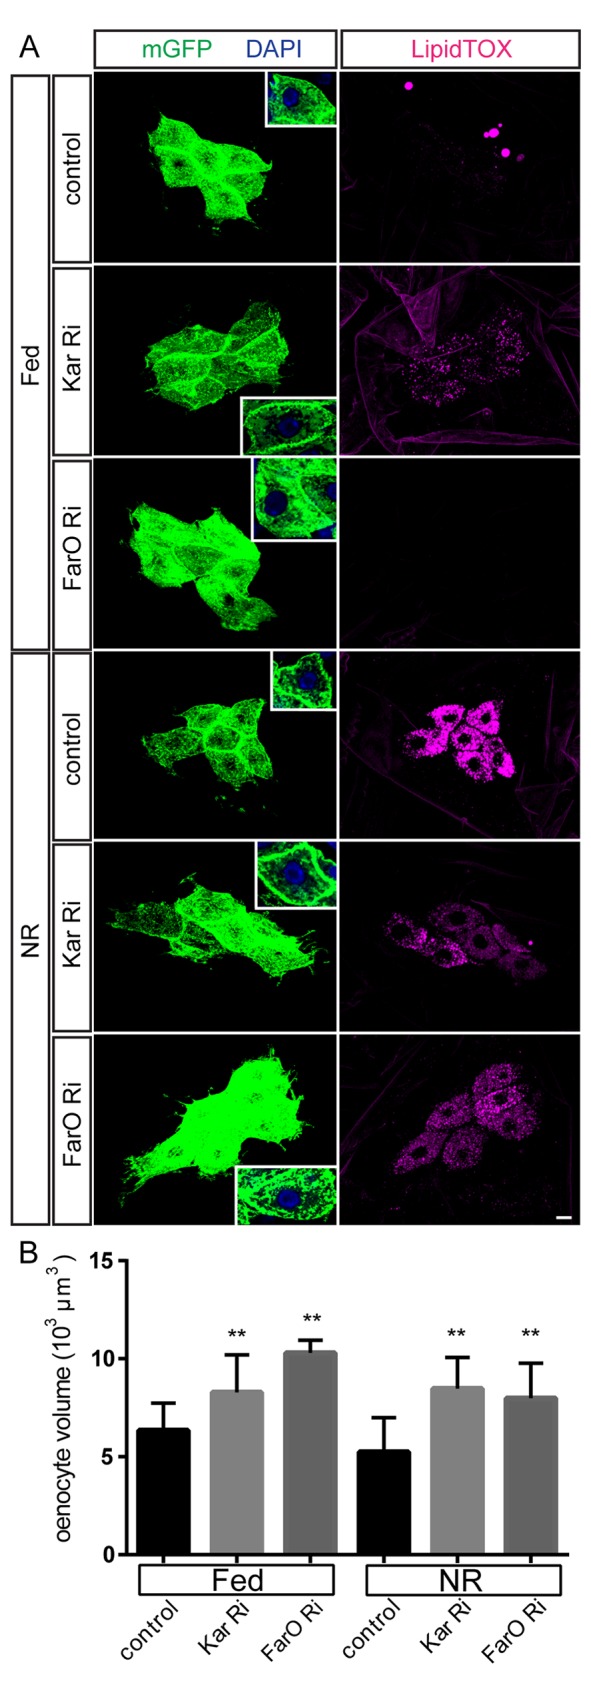
(A) Oenocyte-specific RNAi knockdown (PromE-GAL4) for Kar or FarO in oenocytes increases their cell size in both Fed48 and NR66 larvae (insets) and markedly decreases the induction of lipid droplets (LipidTOX) in NR larvae. Note that oenocytes from Fed48 Kar RNAi larvae also display a small increase in lipid droplets, as is also seen with Acc RNAi. Scale bar is 10μm (B) Graph showing quantitation of larval oenocyte volumes and a significant (**p<0.001) increase in Fed48 and NR cell volumes for Kar RNAi and FarO RNAi. See S1 Fig for quantitations.
Kar regulates oenocyte nuclear size and endoreplication
Kar and FarO could potentially regulate oenocyte size via several distinct mechanisms, such as osmotic swelling/shrinkage or the cell cycle. The developmental growth of many larval cell types, including oenocytes, is known to be accompanied by rounds of DNA replication without cytokinesis that lead to polyploidy and increasing nuclear size [reviewed in 38]. Following RNAi knockdown of Kar or FarO, we observed that NR cell volume increases are concomitant with nuclear enlargement (Fig 5A). To visualize DNA replication directly, we then used the in vivo incorporation of the thymidine analogue 5-ethynyl-2'-deoxyuridine (EdU). Consistent with previous studies, EdU is incorporated into the polyploid nuclei of many mid-L2 tissues including oenocytes in fed larvae. In contrast, when L2 larvae were subjected to NR for 12 hr before exposure to EdU in NR medium, nuclear incorporation in many tissues such as the salivary gland is near zero whereas in the majority, although not all, oenocytes it is detectable (Fig 5B). This suggests that, unlike salivary gland cells, oenocytes retain a low-level of endoreplication for at least 12 hr during NR. Importantly, EdU incorporation in oenocyte nuclei during NR is markedly increased in the enlarged oenocytes generated by Kar knockdown (PromE>Kar Ri) and can be even further increased in the giant oenocytes resulting from strong PI3K hyperactivation (PromE>Dp110) (Fig 5B). Kar therefore regulates a bona fide growth mechanism that increases both cell size and nuclear ploidy. Moreover, the opposing effects of Kar and PI3K upon oenocyte size correlate with their effects upon the oenocyte endocycle.
Fig 5. Kar is required to restrain oenocyte endoreplication.
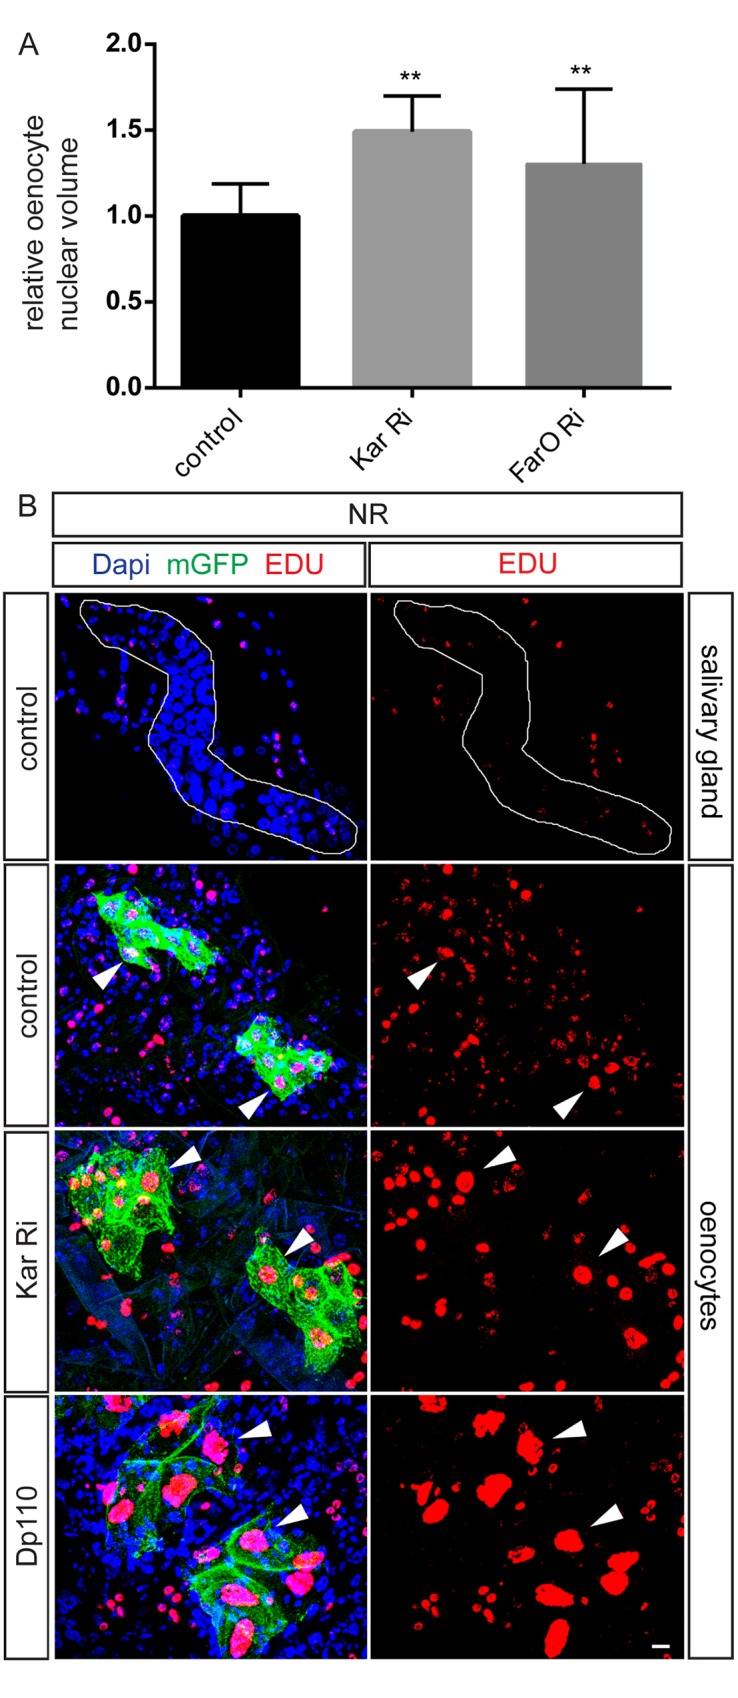
(A) PromE-GAL4 driven Kar RNAi or FarO RNAi in NR larvae leads to a significant (**p<0.001) increase in oenocyte nuclear volume. (B) PromE-GAL4 driven Kar RNAi or PI3K overexpression (Dp110) in NR larvae increases endoreplication (EdU nuclear incorporation) in oenocytes (marked with mGFP). Note that in larvae of the control genotype, endoreplication is shut down by NR in almost all cells of the salivary gland (outlined in white) but not in all oenocytes. Examples of EdU-positive oenocytes are indicated (white arrowheads). Scale bar is 10 μm.
Kar inhibits p-AKT and PI3K signaling to limit oenocyte growth
To explore further the genetic interactions between lipid oxidoreductases and PI3K signaling, we made double combinations of Kar or FarO RNAi with dominant negative PI3K (Dp110DN). For oenocyte lipid droplets, double combinations were analyzed in the fed state as Dp110DN does not have any significant effect in NR larvae. Kar knockdown and Dp110DN each increase fed oenocyte lipid droplets to a moderate level and, not surprisingly, this was also observed when they were combined (Fig 6A and 6B). A different result was obtained with FarO knockdown, which efficiently blocked the Dp110DN increase of lipid droplets seen in Fed48 larvae (S7A and S7B Fig). These results show that, in the context of oenocyte lipid metabolism, FarO and PI3K interact antagonistically. They also suggest that Kar and FarO interact differently with PI3K signaling. Genetic interactions of Kar and FarO with PI3K were also analyzed in the context of oenocyte size. For FarO knockdown, an intermediate oenocyte size phenotype was obtained with Dp110DN precluding clear conclusions about regulatory connections (S7A and S7C Fig). For Kar knockdown, however, the small cell volume obtained with Dp110DN was epistatic in both fed and NR larvae (Fig 6A and 6C). This shows that the increase in oenocyte size observed following Kar knockdown is strictly dependent upon PI3K activity.
Fig 6. Genetic interactions between Kar and PI3K.

(A) In Fed48 larvae, both PromE>Kar Ri and PromE>Dp110DN genotypes accumulate low levels of oenocyte lipid droplets and this is also seen in PromE>Kar Ri Dp110DN. In NR larvae, PromE>Dp110DN does not noticeably alter lipid droplet induction and thus inhibition of NR droplet induction is similar in PromE>Kar Ri and in PromE>Kar Ri Dp110DN. Oenocyte volume in both Fed48 and NR larvae is increased in PromE>Kar Ri but decreased in PromE>Kar Ri Dp110DN to a similar extent as for PromE>Dp110DN alone. Panels show single confocal sections and the scale bar is 10 μm. (B) Relative neutral lipid content of oenocytes in Fed48 larvae of the genotypes in panel A. (C) Oenocyte volumes of the genotypes in panel A in Fed48 and NR66 larvae, demonstrating that PromE-GAL4 driving the expression of Dp110DN is epistatic to Kar RNAi with respect to cell size. Statistical significance in Student t tests is indicated with asterisks (*p<0.05 and **p<0.001). See S1 Fig for LipidTOX quantifications.
To investigate further the regulatory relationship between Kar, FarO and PI3K in larval oenocytes, we used immunostaining for phospho-AKT. No significant change in membrane phospho-Akt levels was detected following FarO knockdown in NR larvae, suggesting that it functions downstream or in parallel to PI3K during the negative regulation of oenocyte growth (S8A Fig). Importantly, Kar knockdown using either the PromE-GAL4 or the Flp-out clonal method gave a moderate and reproducible increase in membrane phospho-Akt expression during NR (Figs 7A, 7B, S8B and S8C). Together with the genetic interaction analysis, these phospho-Akt results demonstrate that Kar plays a key role in inhibiting PI3K signaling and thus suppressing the inappropriate overgrowth of oenocytes.
Fig 7. Kar is required to dampen the expression of membrane phospho-Akt.

(A) Oenocyte clusters from NR larvae expressing Kar RNAi (PromE>Kar RNAi) and marked with GFP (mGFP) display higher intensity P-Akt staining than those from NR larvae of a control genotype. Single confocal sections are shown and insets correspond to a higher magnification of the boxed region. (B) The three rows of panels show two oenocyte clusters from a single NR larva, one of which is a Flp-out clone for Kar RNAi (marked with nlsGFP) that includes all oenocytes of one cluster. The nlsGFP-positive oenocyte cluster displays a decrease in lipid droplets (LipidTOX) and an increase in membrane p-Akt staining, compared to its neighboring control nlsGFP-negative oenocyte cluster. Nuclei are marked with DAPI and the scale bar is 10 μm. (C) Proposed model for the cross regulation between Kar and PI3K signaling in oenocytes. Diagrams depict the genetic interactions between Kar and PI3K signaling that balance cell growth and lipid droplet induction in fed (left panel) and nutrient restricted (right panel) states. In the fed state, cell growth predominates over lipid droplets as dietary nutrients stimulate high PI3K activity, which is prevented from becoming even higher by Kar mediated negative feedback, but also suppresses lipid droplet induction. In the nutrient restricted state, lipid droplets predominate over cell growth as Kar remains active, albeit at lower expression, but PI3K signaling is insufficient to promote substantial cell growth or to inhibit the lipid droplet induction process. Note that this model does not explain the genetic interactions underlying the aberrant accumulation of oenocyte lipid droplets in the fed state, as observed following Acc or Kar knockdown. Arrows indicate genetic interactions that are not necessarily mediated by the known enzymatic activities of the proteins (see text for details).
Discussion
PI3K regulation of fat body-oenocyte lipid metabolism
During starvation, internal levels of nutrients decrease and growth is attenuated in many larval tissues including the fat body and oenocytes [19, 46]. Our study now suggests that the decrease in PI3K signaling during starvation plays a physiological role in permitting neutral lipids to be lost from the fat body and concomitantly gained in oenocytes. For the fat body, decreased PI3K signaling is a necessary but not a sufficient condition for neutral lipid loss, indicating that other regulators must also be important for the starvation response in this tissue. For larval oenocytes, reduced PI3K signaling is not only needed for lipid droplet induction during NR but it can also trigger inappropriate lipid droplets in the fed state. Hence, different tissue-specific responses to PI3K signaling may be an important component of the mechanism regulating lipid metabolism in the larval fat body-oenocyte axis.
It has been reported that starvation induces lipid droplets in adult oenocytes [42], as is known to be the case for larval oenocytes [35]. In contrast to our current findings in larvae, it was concluded in adult flies that starvation increases oenocyte PI3K signaling and that lipid droplet induction requires Insulin-like receptor signaling in oenocytes, triggered by Ilp6 secreted from the adult fat body [42]. For larval oenocytes, however, the lipid droplet induction mechanism is very different as our study shows that it is compromised by high PI3K signaling and does not require Ilp6.
Oenocyte lipid droplet biogenesis requires VLCFA and hydrocarbon enzymes
This study reveals that genes metabolizing fatty acids (Acc), triglycerides (Dgat1), VLCFAs (FarO and possibly Kar) and hydrocarbons (Cyp4g1 and Cpr) are all required for maximal lipid droplet induction in larval oenocytes during NR. For Acc and Kar, this starvation function in lipid droplet induction adds to their previously known roles in waterproofing the larval tracheal system [36]. Our genetic analyses also suggest that derivatives of long and very long chain fatty acids, including hydrocarbons, could either regulate the induction of oenocyte lipid droplets or be part of their neutral lipid cargo. The fat composition of larval oenocyte lipid droplets is, however, not yet clear due to the inherent technical difficulty of obtaining enough purified material for meaningful lipidomic analysis. Given that the accumulation of as yet unidentified neutral lipids in larval oenocytes reflects increased fatty acid release from the fat body [35], it is tempting to speculate that they may play an important metabolic role during starvation. Although the physiological functions of oenocyte lipid droplets have not yet been clearly demonstrated in larvae, oenocyte lipid uptake in adult flies is thought to play an important role in promoting lipid turnover and survival during starvation [42].
Kar mediates a PI3K negative feedback loop during oenocyte growth
An unexpected finding of this study is that two lipid dehydrogenase/reductase enzymes, Kar and FarO, regulate the balance between lipid droplets and the cell size of oenocytes. Knockdown of either enzyme blocks droplet induction and also increases cell size. Four other genes required for the induction of lipid droplets (Acc, Dgat1, Cyp4g1 and Cpr) did not detectably influence oenocyte size, arguing that blocking lipid droplet induction per se does not automatically lead to an increase in cell growth. Oenocyte size regulation therefore appears to be a selective property of a subset of lipid metabolic enzymes rather than all enzymes that synthesize/modify fatty acids. Kar is reported to be a 3-ketoacyl-CoA reductase for the elongation of long chain fatty acids into VLCFAs and it is known to be required in oenocytes to produce their derivatives, the cuticular hydrocarbons [34, 36]. A recent study, however, provides evidence that Kar, also known as Spidey, regulates ecdysteroid levels in larvae and so could function as a steroid dehydrogenase rather than a ketoacyl-CoA reductase [47]. For FarO, we demonstrated biochemically that it is a bona fide VLC fatty acyl-CoA reductase that reduces VLCFA-CoA esters into their corresponding VLCF alcohols. It remains to be established, however, whether or not the functions of Kar or FarO in cell growth require their reductase/dehydrogenase catalytic activities. Intriguingly, we found that Kar is required for the induction of oenocyte lipid droplets during starvation, despite a decrease in its protein levels. Genetic analysis indicates that the lower levels of Kar during NR are compatible with its function in lipid droplet induction. Presumably less Kar is also needed during NR for its other function in limiting PI3K activity, which is itself much lower during NR than in the fed state. The Kar decrease during NR can be mimicked in fed larvae by blocking oenocyte PI3K signaling, indicating that PI3K is a positive regulator of Kar expression. Our study also provides two lines of evidence for the reciprocal regulation i.e. Kar-dependent repression of PI3K signaling. Hence, the increase in oenocyte growth following Kar knockdown requires PI3K activity and membrane phospho-Akt levels are elevated by Kar knockdown. The existence of such cross-regulation supports a model in which a PI3K negative feedback loop mediated by Kar prevents excessive oenocyte growth (Fig 7C). So why does PI3K negative feedback mediated by Kar exist in some cell types (e.g oenocytes) but apparently not in others (e.g fat body cells)? One possibility is that this regulatory coupling is only important in those cell types that express high levels of Kar and dedicate a large fraction of their energy resources to metabolizing its substrates. Kar's role and indeed that of FarO could therefore be to ensure that critical physiological functions of oenocytes requiring VLCFA or ecdysteroid metabolism are not sacrificed at the expense of growth. Future biochemical and biophysical studies will be needed in order to elucidate the mechanisms by which Kar and FarO suppress oenocyte growth. Regulation of PI3K signaling at the level of membrane p-Akt was detected for Kar, although not for FarO. In principle, Kar could regulate PI3K signaling via effects upon ecdysone signaling and/or by changing the composition of the membrane where PI3K is active. With regard to the latter possibility, it is interesting that studies in various other biological contexts have shown that VLCFAs can modulate the activity of the PI3K signaling pathway. For example, docosahexenoic acid, a polyunsaturated VLCFA, inhibits PI3K signaling and the growth of prostate and colon cancer cells whereas it can stimulate PI3K signaling and the survival of neuronal cells [48–50]. Future studies will reveal whether oenocyte-like Kar regulation of PI3K exists in these contexts or in other tissues known to synthesize large quantities of VLCFAs and other specialized lipids such as those found in the mammalian liver and skin.
Materials and Methods
Drosophila strains and larval analysis
Drosophila were raised at 25°C using a standard cornmeal/agar diet unless otherwise stated. Larvae were staged at the L2/L3 molt according to morphology and early L3 larvae were either dissected immediately (the Fed48 group) or transferred for 18hr to PBS/1% low melting point agarose (the NR66 group) or for 18h to food (the Fed66 group) before dissection (Fig 1). For all RNAi experiments, early L1 larvae were transferred to 29°C until dissection. For tracheal flooding assays, larvae were transferred 6-8hr after the L2/L3 molt from food to PBS in a petri dish and maintained submerged for 15 min using a wire mesh. The numbers of larvae with liquid in the main tracheal trunks were then scored. The oenocyte specific driver line PromE-Gal4, UAS-CD8::GFP [31] is expressed from embryonic stage 17 onwards. Key results with PromE-GAL4 were confirmed using a second oenocyte-specific GAL4 driver line Cee-GAL4 (Cyp4g1-Gal4; elav-Gal80; elav-Gal80), which is strongly expressed from the L1 stage in oenocytes and salivary glands (and weakly in trachea) and was generated by combining a copy of elav-Gal80 on the 2nd and on the 3rd chromosomes (gifts of Matthias Llandgraf) with Cyp4g1-Gal4NP6073 (DGRC, Kyoto) to suppress unwanted neural Gal4 activity. To induce flp-out clones, hs-flp; actin5C>CD2>Gal4 flies were crossed to the relevant UAS line and early L1 progeny were heat shocked at 37°C for 8 min. The larval progeny of GAL4 or UAS lines crossed to w1118 were used as controls. Oenocyte-less larvae were generated by crossing PromE-Gal4 to a UAS-reaper line [35]. Inducible RNA-interference (UAS-RNAi) lines for the genes CG11198KK108631 (Acc), CG11198GD8105 (Acc), CG1444GD40949 (Kar), CG14441444R-2 (Kar), CG18031GD30220 (FarO), CG31991GD6367 (DGAT1, midway), CG11567GD46715 (Cpr), CG11567GD44232 (Cpr), CG11567KK107422 (Cpr) and CG14049GD45218 (Ilp6) were obtained from VDRC and NIG-FLY. For the generation of inducible intron-spliced snapback UAS-Cyp4g1 RNAi lines (O-194 and O-196), the cDNA clone GH05567 was used as a template and a 330 bp Cyp4g1 fragment amplified with Pfu DNA polymerase using the following pairs of 5’ tagged primers: GAGTACTAGTAAGAGGAGTCACGTGCGATTGTTG and GTTGACTAGTGCGAAGACTTTAGCCTGGATG. The PCR fragment of Cyp4g1 was cloned as an inverted repeat into the UAS-RNAi vector pWIZ [51] and introduced in yw hosts by P-element-mediated transformation [52]. With the conditions used, PromE-GAL4 produced pupal/adult lethality when crossed with UAS-RNAi lines for Acc, Kar, Dgat1, Cyp4g1, Cpr or Dp110DN but not for FarO, Dp110 or overexpression of Lsd2. Cyp4g1Δ4 is a protein-null allele [35] and hemizygous mutant males were compared to Cyp4g1Δ4/FM7c female controls. Other stocks used were Df(1)Ilp6 [53], Cg-GAL4;UAS-Dicer2, UAS-nlsGFP, UAS-Dp110DNA2860C, UAS-Dp110 [54], UAS-myrAkt1 [55], tGPH [39], UAS-Lsd2 [line RKF391, 56]. Stocks obtained from the Bloomington Drosophila Stock Center (NIH P40OD018537) were used in this study.
Lipid droplet staining
Oil Red O staining was performed as previously described [35] and images were acquired using a Zeiss Axiophot 2 compound microscope. LipidTOX staining was performed after immunostaining: tissues were washed with PBS + 0.3% Triton. Then washed several times with PBS to remove the detergent and incubated O/N at 4°C with LipidTOX (HCS LipidTOX Red or Deep Red Neutral Lipid Stain, Life Technologies) at 1:1000 dilution.
Immunostaining
Larval pelts, cut along the dorsal side, were cleaned of internal tissues and immobilized in PBS cuticle face down with insect pins on silicone elastomer (Sylgard, Dow Corning) polymerized in a small petri dish. All subsequent reaction steps were done on pinned out pelts in the Sylgard dish, using a horizontal shaker. Pelts were then fixed in 4% formaldehyde (or 10% formaldehyde for P-Akt stainings) for 20 min. After permeabilization in PBST (PBS/0.1% TritonX-100) tissues were blocked for 1.5 hr in PBST containing 0.1% BSA, 10% NGS, then primary antibodies were added in block solution and incubated overnight at 4°C. After extensive washes, block solution containing secondary antibodies was added for 2 hr at room temperature, and then washed extensively. Washes (5x20 min) were in PBS/0.1% TritonX-100/0.1% BSA after incubation with primary and secondary antibodies. For P-Akt antibodies, samples were postfixed for 20 min in 4% formaldehyde. Pelts were then washed in PBST and mounted with the cuticle facing up in Vectashield (Vector Laboratories). Primary antibodies were used at the following dilutions: Acc (1:50 cat#3662 Cell Signaling Technology), rabbit anti-Foxo (1:500, gift of P. Leopold), P-Akt Ser505 (1:50, cat#4054 Cell Signaling Technology), mouse anti-Cyp4g1 (1:1000, 433-43-2e, gift of S. Kennel). Secondary goat antibodies used were Alexa Fluor F(ab')2 fragments (1: 400, Invitrogen) and streptavidin-A555 (1ug/mL, Molecular Probes). Nuclear labeling was performed by incubating the tissues with Dapi (1:1000 Sigma). Images were collected on a Nikon Digital Eclipse C1 confocal microscope. Affinity purified rabbit anti-Kar antibodies (used at 1:1000) and rabbit anti-Cpr antibodies (used at 1:500) were generated by Cambridge Research Biochemicals via immunization with the peptides LGTRKRALRRLAKEQ (307–321, reference protein sequence AAF46291) and YLKNKQPQGSEEVKV (497–511, reference protein sequence AAF52367) respectively. RNAi knockdown efficiencies for Acc, Cpr, Cyp4g1 and Kar were quantified in ImageJ from maximum intensity z-stack projections by measuring mean pixel intensity across an oenocyte cluster, followed by subtraction of background as the mean pixel intensity measured in the area surrounding each cluster. Relative lipid content was quantified from maximum intensity z-stack projections of LipidTOX stainings of fat body cells and oenocytes. Mean pixel intensities across the entire fat body cell or oenocyte cluster were calculated using the 'integrated density' value of the analysis measurement tool in Photoshop. Cell areas were manually selected according to CD8::GFP expression using the magnetic lasso tool. Similarly, mean pixel intensities for membrane p-Akt staining were quantified from single confocal sections by manually selecting the CD8::GFP positive membrane region of oenocytes.
EdU incorporation in vivo
Early L2 larvae were transferred to NR medium (PBS/0.5% low melting point agarose) for 12 hr and then removed, washed, and transferred to NR medium containing 0.1 mM EdU for 24 hr where larvae were seen “feeding” on the medium. Then larvae were dissected, fixed and EdU was detected using the Click-iT EdU Alexa Fluor 555 Imaging Kit (Life Technologies).
Oenocyte cell and nuclear volumes
Oenocyte cell volumes were measured from 1–2 oenocyte clusters from 5 different larvae per genotype. Oenocyte clusters expressing a CD8::GFP reporter were scanned on a Nikon Digital Eclipse C1 confocal microscope. The Z-stack was adjusted to cover the entire cluster and sections spaced 2 μm apart were collected in three channels. The channels were separated using ImageJ software (http://imagej.nih.gov/ij/) and the GFP channel was imported to Amira software (Visage Imaging, Inc.) for 3D volume analysis. The clusters were automatically segmented followed by manual verification of the segmentation process and the volume of each segmented cluster was calculated. The settings of the entire procedure were kept identical for all scanned clusters. Nuclear volumes were measured as above on individually segmented nuclei from DAPI stained images of 1 oenocyte cluster from 12 different larvae of each genotype. For fat body Flp-out clones, area measurements were calculated using the analysis measurement tool of Photoshop (Adobe Systems) with manual segmentation of GFP expressing cells using the magnetic lasso tool. For oenocyte Flp-out clones, volume measurements used Amira to segment the whole cluster automatically but with manual verification, followed by manual division into GFP-positive and GFP-negative cells. Volumes of GFP-positive cells were normalized to the mean volume of all GFP-negative oenocytes from the same cluster.
Production of recombinant FarO
The FarO ORF (clone LP02712, DGRC Bloomington) was subcloned into pENTR (Invitrogen), modified to remove the NcoI site [57]. The ORF was amplified by PCR using InFusF1 and InFusR1 linker primers to attach 15 nt overlapping the pENTR insertion site. pENTR was amplified using pENTR F4 and pENTR R5 primers. All PCR reactions used proof-reading polymerase (Pfu Ultra II HS; Agilent). Products were purified from agarose gels, joined by Gibson assembly using the Infusion HD cloning kit (Clontech, Mountainview, CA), and completely sequenced at the Nevada Genomics Center to verify integrity. The ORF was then transferred into Baculo-Direct baculoviral DNA using LR recombinase (Invitrogen), and transfected into Sf9 cells by standard methods [57]. A high titre P3 viral stock was produced by successive amplification of P1 and P2 stocks, and re-confirmed by sequencing. To produce recombinant FarO in Sf9 cells, liquid cultures were seeded at a concentration of 0.8x10⁶ cells/ml with 10% fetal bovine serum in SF900 unsupplemented media (Life technologies). Cultures were incubated at 27°C with shaking at 1,300 rpm on orbital shakers for 72 hr and centrifuged at 3000 rpm in the Beckman GS-6R centrifuge for 10 min at 4°C. The supernatant was discarded and the pellet was washed twice by successive resuspension in 5 ml of 100 mM Tris-HCl pH 7. The washed pellet was resuspended in cell lysis buffer [(CLB); 10 ml 100 mM Tris-HCl pH 7 with the addition of 100 μM DTT, 0.5 mM PMSF and 10 μl of protease inhibitor cocktail (Sigma)]. Pelleted cells were resuspended in 3ml CLB and sonicated using a Branson hand held sonifier (VWR Scientific) with 15 one second bursts repeated 3 times. 1ml aliquots were separated and microcentrifuged at 13,000 rpm for 20 min at 4°C. Supernatants were either used directly for functional assays or for microsomal preparations. Microsomes were prepared by centrifuging the lysate supernatant at 53,000 rpm in a Beckman Optima MaxE ultracentrifuge for 1 h at 4°C, removing the supernatant, and resuspending the microsomal pellet in cell lysis buffer. Genscript (Piscataway, NJ) was contracted to produce rabbit antisera to a FarO peptide (amino acids 412–425). FarO production in Sf9 cells was measured by Western blotting of microsomal and supernatant fractions. Recombinant housefly cytochrome P450 reductase (CPR) was similarly produced as described previously [57].
FarO functional assays
Recombinant FarO and CPR were assayed for reductase activity by incubating infected Sf9 cell lysate preparations with NAD(P)H and fatty acid (Sigma-Aldrich) or fatty acyl-CoA (Avanti Polar Lipids) substrates. Briefly, cell lysate supernatants in CLB were incubated in 100mM Tris HCl pH 7.0, 100 μM DTT, 0.5 mM PMSF and 10 μl of protease inhibitor cocktail (Sigma) supplemented with 120–150 μM 26:0–CoA or 24:0–CoA and 2.3 mM NADH (Fisher Scientific) or NADPH (Sigma Aldrich). All listed concentrations are final in 600–1000 μl reaction volumes. Samples were incubated at 30°C for 2 h and then extracted twice with hexane:ether (50/50, v/v) into glass vials. Samples were dried down to completion under N2 gas, resuspended in pure hexane and analyzed by gas chromatography using either a DB-5 column (Agilent) or a Shimadzu non-polar polysiloxane column, (catalog number: 220-94536-01, phase: SHR5XLB) with the following profile: injector temperature 150°C, FID temperature 300°C; program:160°C for 0.2 min, ramp to 265°C at 15°C/min, ramp to 295°C at 5°C/min, and hold for 5 min at 295°C.
Supporting Information
The relative lipid contents, calculated from neutral LipidTOX stainings, for experiments shown in the main Figures. (A,B) Flp-out clones in the fat body expressing Dp110 in NR (A) or Dp110DN in Fed48 larvae (B). (C-E) PromE-GAL4 controls in Fed48 and NR larvae (C) and PromE-GAL4 driven expression of Dp110 or Dp110DN in Fed48 (D) and NR (E) larvae. (F,G) PromE-GAL4 driven expression of RNAi for Acc, Dgat1, Cyp4g1 and Cpr, or of Lsd2 overexpression in Fed48 (F) and NR (G) larvae. (H) Cyp4g1Δ4 mutant NR larvae. (I,J) PromE-GAL4 driven expression of RNAi for Kar or FarO in Fed48 (I) and NR (J) larvae. Quantifications in (A-E) correspond to Fig 1, (F-H) correspond to Fig 2 and (I,J) correspond to Fig 4. In this and subsequent graphs, error bars represent 1 s.d. and asterisks show statistical significance in Student t tests (*p<0.05, and **p<0.001), compared to the one fold control condition unless otherwise indicated
(TIF)
(A, B) Fat body cell areas in Flp-out clones. Dp110 overexpression increases cell size relative to controls in NR larvae (A) and Dp110DN expression decreases cell size relative to controls in Fed48 larvae (B). (C, D) Quantitation of Oenocyte membrane p-Akt expression. Membrane p-Akt expression increases significantly in Fed48 (C) or NR (D) larvae following PromE-GAL4 driven Dp110 overexpression whereas the decreases following Dp110DN expression are not statistically significant. (E-G) Relative oenocyte volumes in Fed48 (E, G) or NR (F) larvae significantly increase following PromE-GAL4 driven Dp110 overexpression or Flp-out clonal expression of myrAkt. Oenocyte volumes significantly decrease following PromE-GAL4 or Flp-out clonal expression of Dp110DN.
(TIF)
Panels in top two rows show endogenous FoxO expression in fat body (left) and oenocytes (right, marked with PromE>mGFP) from Fed48 and NR66 larvae. Redistribution of FoxO from the cytoplasm to the nucleus (associated with decreased PI3K signaling) during NR is more pronounced in the fat body than in oenocytes. The nuclei of NR oenocytes (white arrowhead) express less FoxO than the nuclei of neighboring NR epidermal cells (yellow arrowhead). Panels in the bottom row show expression of the tGPH reporter for PI3K activity in fat body (left) and oenocytes (right) from Fed48 and NR66 larvae. Membrane expression of EGFP fused to the pleckstrin homology domain of Grp1 (a readout for PI3K activity in some but not in all cell types) is clearly decreased during NR in fat body but in oenocytes the NR change is less noticeable. Scale bar is 10 μm.
(TIF)
Clusters of oenocytes from NR larvae, marked with streptavidin-A555 and showing lipid droplets (LipidTOX) and nuclei (DAPI). (A) Larvae deficient for Ilp6 (Df(1)Ilp6) show lipid droplet induction similar to controls (w1118). (B) Larvae with fat body-specific RNAi knockdown of Ilp6 (Cg>Ilp6 Ri) show lipid droplet induction similar to controls (Cg-GAL4). Scale bar is 20 μm. (C) Most Acc, Kar, Cpr and Cyp4g1 RNAi larvae retain watertight trachea. Graph shows the percentage of larvae of various genotypes showing tracheal flooding at the early L3 stage. Asterisks indicates p<0.01. Each larval genotype carried the oenocyte-specific driver Pro-mE-GAL4 and the respective UAS-RNAi transgene indicated. The control genotype used was PromE-GAL4 crossed to w1118 and "oenocyte-less" refers to PromE>reaper.
(TIF)
(A) Antibody staining for Acc, Kar, Cyp4g1 and Cpr in oenocytes following PromE-GAL4 driven RNAi in NR larvae. Scale bar is 20μm. (B) Staining for Kar in nlsGFP positive Flp-out clones expressing Kar Ri in oenocytes. Scale bar is 10μm. (C) Graph of relative immunostaining intensity for Kar protein in Kar Ri oenocyte Flp-out clones during NR. (D-G) Graphs of relative staining intensity in oenocytes for Acc (D), Kar (E), Cyp4g1 (F) and Cpr (G) proteins following PromE-GAL4 driven RNAi knockdown of the corresponding genes in NR larvae.
(TIF)
(A) Neither Kar nor FarO RNAi detectably alter lipid droplets in the fat body. Flp-out clones for Kar RNAi (top row) or FarO RNAi (bottom row), marked with nlsGFP, show no detectable change in lipid droplets (LipidTOX), nuclear size or cell size in NR larvae. Nuclei are marked with DAPI and the scale bar is 10μm. (B, C) Oenocyte FarO Ri Flp-out clones in NR larvae, marked by nlsGFP, show decreased LipidTOX staining (B) and significantly decreased relative neutral lipid content (C) than control neighboring cells. Oenocyte Kar expression is not altered in FarO Ri Flp-out clones. (D, E) FarO and Kar do not regulate oenocyte volumes at the late larval stage. PromE-GAL4 mediated expression of Kar or FarO RNAi alone or in combination with Dp110DN in Fed66 larvae. In contrast to Fed48 and NR66 larvae, oenocyte volumes in Fed66 larvae are not significantly altered by Kar or FarO RNAi, although they remain PI3K dependent.
(TIF)
(A) In Fed48 larvae, PromE>Dp110DN induces a low level of oenocyte lipid droplets that are suppressed in PromE>FarO Ri Dp110DN. In NR larvae, PromE>Dp110DN does not noticeably alter lipid droplet induction and thus inhibition of NR droplet induction is similar in PromE>FarO Ri and in PromE>FarO Ri Dp110DN. In both Fed48 and NR larvae, oenocyte volume in PromE>FarO Ri Dp110DN is intermediate between that of PromE>FarO Ri alone and PromE>Dp110DN alone. Panels show single confocal sections and the scale bar is 10 μm. (B) Relative neutral lipid content of oenocytes from Fed48 larvae for the genotypes in panel A. Note that FarO is required for the increase in lipid droplets in fed larvae following PI3K inhibition. (C) Oenocyte volumes for the genotypes in panel A in Fed48 and NR66 larvae.
(TIF)
(A, B) Quantitation of membrane p-Akt intensity, relative to the control genotype, in NR oenocytes expressing FarO RNAi (A) or Kar RNAi (B). Membrane p-Akt intensity increases 1.7 fold with Kar RNAi but does not change significantly with FarO RNAi. (C) Panels show p-Akt staining in an oenocyte cluster (marked with mGFP) from control and Kar knockdown (PromE>Kar RNAi) NR66 larvae. Kar RNAi knockdown is associated with increased membrane p-Akt expression. Scale bar is 10 μm.
(TIF)
Acknowledgments
We are grateful to Matthias Llandgraf, Jacques Montagne, Leslie Pick, and Joel Levine for fly stocks and to Pierre Leopold for antibodies. Stocks obtained from the Bloomington Drosophila Stock Center (NIH P40OD018537) and the Kyoto Drosophila Genetic Resource and Vienna Drosophila RNAi Centers were used in this study. We thank Eugenio Gutierrez for making the Cyp4g1 RNAi lines. We acknowledge technical assistance from Tsz Fong (Cindy) Cho, James MacRae and Liron Yanovsky and thank Andrew Bailey, Fumiaki Obata, Irina Stefana and Vanessa Tixier for advice and critical reading of the manuscript.
Data Availability
All relevant data are within the paper and its Supporting Information files.
Funding Statement
EC, RM, AS, and APG are supported by the Francis Crick Institute (www.crick.ac.uk), which receives its core funding from Cancer Research UK, the UK Medical Research Council, and the Wellcome Trust and previously by the UK Medical Research Council (www.mrc.ac.uk), National Institute for Medical Research (U117584237). ZP was supported by the Jan M. and Eugenia Król charitable foundation and is an incumbent of the Lady Davis Professorship in Experimental Medicine and Cancer Research. EC was also supported by an ALTF (642-2007) from EMBO (www.embo.org/) and a Sara Lee Shupf postdoctoral award from the Weizmann Institute of Science program for advancing women in science. LPW, CT, GJB are supported by an award from the USDA-NIFA (2013-02488), a contribution of the Nevada Agricultural Experiment Station. The funders had no role in study design, data collection and analysis, decision to publish, or preparation of the manuscript.
References
- 1.Lloyd AC. The regulation of cell size. Cell. 2013;154: 1194–1205. 10.1016/j.cell.2013.08.053 [DOI] [PubMed] [Google Scholar]
- 2.Navarro FJ, Weston L, Nurse P. Global control of cell growth in fission yeast and its coordination with the cell cycle. Curr Opin Cell Biol. 2012;24: 833–837. 10.1016/j.ceb.2012.10.015 [DOI] [PubMed] [Google Scholar]
- 3.Ginzberg MB, Kafri R, Kirschner M. Cell biology. On being the right (cell) size. Science. 2015;348: 1245075 10.1126/science.1245075 [DOI] [PMC free article] [PubMed] [Google Scholar]
- 4.Laplante M, Sabatini DM. mTOR signaling in growth control and disease. Cell. 2012;149: 274–293. 10.1016/j.cell.2012.03.017 [DOI] [PMC free article] [PubMed] [Google Scholar]
- 5.Shimobayashi M, Hall MN. Making new contacts: the mTOR network in metabolism and signalling crosstalk. Nat Rev Mol Cell Biol. 2014;15: 155–162. 10.1038/nrm3757 [DOI] [PubMed] [Google Scholar]
- 6.Jewell JL, Russell RC, Guan KL. Amino acid signalling upstream of mTOR. Nat Rev Mol Cell Biol. 2013;14: 133–139. 10.1038/nrm3522 [DOI] [PMC free article] [PubMed] [Google Scholar]
- 7.Fruman DA, Rommel C. PI3K and cancer: lessons, challenges and opportunities. Nat Rev Drug Discov. 2014;13: 140–156. 10.1038/nrd4204 [DOI] [PMC free article] [PubMed] [Google Scholar]
- 8.Cantley LC. The phosphoinositide 3-kinase pathway. Science. 2002;296: 1655–1657. 10.1126/science.296.5573.1655 [DOI] [PubMed] [Google Scholar]
- 9.Falke JJ. Membrane Recruitment as a Cancer Mechanism: A Case Study of Akt PH Domain. Cellscience. 2007;4: 25–30. [PMC free article] [PubMed] [Google Scholar]
- 10.Hers I, Vincent EE, Tavare JM. Akt signalling in health and disease. Cell Signal. 2011;23: 1515–1527. 10.1016/j.cellsig.2011.05.004 [DOI] [PubMed] [Google Scholar]
- 11.Teleman AA. Molecular mechanisms of metabolic regulation by insulin in Drosophila. Biochem J. 2010;425: 13–26. 10.1042/BJ20091181 [DOI] [PubMed] [Google Scholar]
- 12.Hietakangas V, Cohen SM. Regulation of tissue growth through nutrient sensing. Annu Rev Genet. 2009;43: 389–410. 10.1146/annurev-genet-102108-134815 [DOI] [PubMed] [Google Scholar]
- 13.Grewal SS. Insulin/TOR signaling in growth and homeostasis: a view from the fly world. Int J Biochem Cell Biol. 2009;41: 1006–1010. 10.1016/j.biocel.2008.10.010 [DOI] [PubMed] [Google Scholar]
- 14.Andersen DS, Colombani J, Leopold P. Coordination of organ growth: principles and outstanding questions from the world of insects. Trends Cell Biol. 2013;23: 336–344. 10.1016/j.tcb.2013.03.005 [DOI] [PubMed] [Google Scholar]
- 15.Gokhale RH, Shingleton AW. Size control: the developmental physiology of body and organ size regulation. Wiley Interdiscip Rev Dev Biol. 2015; [DOI] [PubMed] [Google Scholar]
- 16.Britton JS, Edgar BA. Environmental control of the cell cycle in Drosophila: nutrition activates mitotic and endoreplicative cells by distinct mechanisms. Development. 1998;125: 2149–2158. [DOI] [PubMed] [Google Scholar]
- 17.Chell JM, Brand AH. Nutrition-responsive glia control exit of neural stem cells from quiescence. Cell. 2010;143: 1161–1173. 10.1016/j.cell.2010.12.007 [DOI] [PMC free article] [PubMed] [Google Scholar]
- 18.Sousa-Nunes R, Yee LL, Gould AP. Fat cells reactivate quiescent neuroblasts via TOR and glial insulin relays in Drosophila. Nature. 2011;471: 508–512. 10.1038/nature09867 [DOI] [PMC free article] [PubMed] [Google Scholar]
- 19.Cheng LY, Bailey AP, Leevers SJ, Ragan TJ, Driscoll PC, Gould AP. Anaplastic lymphoma kinase spares organ growth during nutrient restriction in Drosophila. Cell. 2011;146: 435–447. 10.1016/j.cell.2011.06.040 [DOI] [PubMed] [Google Scholar]
- 20.Lanet E, Gould AP, Maurange C. Protection of neuronal diversity at the expense of neuronal numbers during nutrient restriction in the Drosophila visual system. Cell Rep. 2013;3: 587–594. 10.1016/j.celrep.2013.02.006 [DOI] [PMC free article] [PubMed] [Google Scholar]
- 21.Arrese EL, Soulages JL. Insect fat body: energy, metabolism, and regulation. Annu Rev Entomol. 2010;55: 207–225. 10.1146/annurev-ento-112408-085356 [DOI] [PMC free article] [PubMed] [Google Scholar]
- 22.Canavoso LE, Jouni ZE, Karnas KJ, Pennington JE, Wells MA. Fat metabolism in insects. Annu Rev Nutr. 2001;21: 23–46. 10.1146/annurev.nutr.21.1.23 [DOI] [PubMed] [Google Scholar]
- 23.Colombani J, Raisin S, Pantalacci S, Radimerski T, Montagne J, Leopold P. A nutrient sensor mechanism controls Drosophila growth. Cell. 2003;114: 739–749. [DOI] [PubMed] [Google Scholar]
- 24.Palm W, Sampaio JL, Brankatschk M, Carvalho M, Mahmoud A, Shevchenko A, et al. Lipoproteins in Drosophila melanogaster—assembly, function, and influence on tissue lipid composition. PLoS Genet. 2012;8: e1002828 10.1371/journal.pgen.1002828 [DOI] [PMC free article] [PubMed] [Google Scholar]
- 25.Gould AP, Elstob PR, Brodu V. Insect oenocytes: a model system for studying cell-fate specification by Hox genes. J Anat. 2001;199: 25–33. [DOI] [PMC free article] [PubMed] [Google Scholar]
- 26.Makki R, Cinnamon E, Gould AP. The development and functions of oenocytes. Annu Rev Entomol. 2014;59: 405–425. 10.1146/annurev-ento-011613-162056 [DOI] [PMC free article] [PubMed] [Google Scholar]
- 27.Koch J. Die Oenocyten von Drosophila melanogaster. Rev suisse zool. 1945;52: 415–420. [Google Scholar]
- 28.Lawrence PA, Johnston P. Cell lineage of the Drosophila abdomen: the epidermis, oenocytes and ventral muscles. J Embryol Exp Morphol. 1982;72: 197–208. [PubMed] [Google Scholar]
- 29.Elstob PR, Brodu V, Gould AP. spalt-dependent switching between two cell fates that are induced by the Drosophila EGF receptor. Development. 2001;128: 723–732. [DOI] [PubMed] [Google Scholar]
- 30.Ferveur JF, Savarit F, O’Kane CJ, Sureau G, Greenspan RJ, Jallon JM. Genetic feminization of pheromones and its behavioral consequences in Drosophila males. Science. 1997/06/06 ed. 1997;276: 1555–1558. [DOI] [PubMed] [Google Scholar]
- 31.Billeter JC, Atallah J, Krupp JJ, Millar JG, Levine JD. Specialized cells tag sexual and species identity in Drosophila melanogaster. Nature. 2009;461: 987–991. 10.1038/nature08495 [DOI] [PubMed] [Google Scholar]
- 32.Blomquist GJ, Bagneres A-G. Insect hydrocarbons: biology, biochemistry, and chemical ecology Cambridge: Cambridge University Press; 2010. ISBN: 9780521898140 [Google Scholar]
- 33.Qiu Y, Tittiger C, Wicker-Thomas C, Le Goff G, Young S, Wajnberg E, et al. An insect-specific P450 oxidative decarbonylase for cuticular hydrocarbon biosynthesis. Proc Natl Acad Sci U S A. 2012;109: 14858–14863. 10.1073/pnas.1208650109 [DOI] [PMC free article] [PubMed] [Google Scholar]
- 34.Wicker-Thomas C, Garrido D, Bontonou G, Napal L, Mazuras N, Denis B, et al. Flexible origin of hydrocarbon/pheromone precursors in Drosophila melanogaster. J Lipid Res. 2015;56: 2094–2101. 10.1194/jlr.M060368 [DOI] [PMC free article] [PubMed] [Google Scholar]
- 35.Gutierrez E, Wiggins D, Fielding B, Gould AP. Specialized hepatocyte-like cells regulate Drosophila lipid metabolism. Nature. 2007;445: 275–280. [DOI] [PubMed] [Google Scholar]
- 36.Parvy JP, Napal L, Rubin T, Poidevin M, Perrin L, Wicker-Thomas C, et al. Drosophila melanogaster Acetyl-CoA-carboxylase sustains a fatty acid-dependent remote signal to waterproof the respiratory system. PLoS Genet. 2012;8: e1002925 10.1371/journal.pgen.1002925 [DOI] [PMC free article] [PubMed] [Google Scholar]
- 37.Edgar BA, Zielke N, Gutierrez C. Endocycles: a recurrent evolutionary innovation for post-mitotic cell growth. Nat Rev Mol Cell Biol. 2014;15: 197–210. 10.1038/nrm3756 [DOI] [PubMed] [Google Scholar]
- 38.Orr-Weaver TL. When bigger is better: the role of polyploidy in organogenesis. Trends Genet. 2015; 10.1016/j.tig.2015.03.011 [DOI] [PMC free article] [PubMed] [Google Scholar]
- 39.Britton JS, Lockwood WK, Li L, Cohen SM, Edgar BA. Drosophila’s insulin/PI3-kinase pathway coordinates cellular metabolism with nutritional conditions. Dev Cell. 2002;2: 239–249. [DOI] [PubMed] [Google Scholar]
- 40.Hietakangas V, Cohen SM. Re-evaluating AKT regulation: role of TOR complex 2 in tissue growth. Genes Dev. 2007;21: 632–637. 10.1101/gad.416307 [DOI] [PMC free article] [PubMed] [Google Scholar]
- 41.Kockel L, Kerr KS, Melnick M, Bruckner K, Hebrok M, Perrimon N. Dynamic switch of negative feedback regulation in Drosophila Akt-TOR signaling. PLoS Genet. 2010;6: e1000990 10.1371/journal.pgen.1000990 [DOI] [PMC free article] [PubMed] [Google Scholar]
- 42.Chatterjee D, Katewa SD, Qi Y, Jackson SA, Kapahi P, Jasper H. Control of metabolic adaptation to fasting by dILP6-induced insulin signaling in Drosophila oenocytes. Proc Natl Acad Sci U S A. 2014;111: 17959–17964. 10.1073/pnas.1409241111 [DOI] [PMC free article] [PubMed] [Google Scholar]
- 43.Wilfling F, Haas JT, Walther TC, Farese RV Jr. Lipid droplet biogenesis. Curr Opin Cell Biol. 2014;29C: 39–45. 10.1016/j.ceb.2014.03.008 [DOI] [PMC free article] [PubMed] [Google Scholar]
- 44.Kuhnlein RP. The contribution of the Drosophila model to lipid droplet research. Prog Lipid Res. 2011/05/31 ed. 2011;50: 348–356. 10.1016/j.plipres.2011.04.001 [DOI] [PubMed] [Google Scholar]
- 45.Beaudoin F, Gable K, Sayanova O, Dunn T, Napier JA. A Saccharomyces cerevisiae gene required for heterologous fatty acid elongase activity encodes a microsomal beta-keto-reductase. J Biol Chem. 2002;277: 11481–11488. 10.1074/jbc.M111441200 [DOI] [PubMed] [Google Scholar]
- 46.Ragan TJ, Bailey AP, Gould AP, Driscoll PC. Volume determination with two standards allows absolute quantification and improved chemometric analysis of metabolites by NMR from submicroliter samples. Anal Chem. 2013;85: 12046–12054. 10.1021/ac403111s [DOI] [PMC free article] [PubMed] [Google Scholar]
- 47.Chiang YN, Tan KJ, Chung H, Lavrynenko O, Shevchenko A, Yew JY. Steroid Hormone Signaling Is Essential for Pheromone Production and Oenocyte Survival. PLoS Genet. 2016;12: e1006126 10.1371/journal.pgen.1006126 [DOI] [PMC free article] [PubMed] [Google Scholar]
- 48.Gu Z, Wu J, Wang S, Suburu J, Chen H, Thomas MJ, et al. Polyunsaturated fatty acids affect the localization and signaling of PIP3/AKT in prostate cancer cells. Carcinogenesis. 2013;34: 1968–1975. 10.1093/carcin/bgt147 [DOI] [PMC free article] [PubMed] [Google Scholar]
- 49.Engelbrecht AM, Toit-Kohn JL, Ellis B, Thomas M, Nell T, Smith R. Differential induction of apoptosis and inhibition of the PI3-kinase pathway by saturated, monounsaturated and polyunsaturated fatty acids in a colon cancer cell model. Apoptosis. 2008;13: 1368–1377. 10.1007/s10495-008-0260-3 [DOI] [PubMed] [Google Scholar]
- 50.Akbar M, Calderon F, Wen Z, Kim HY. Docosahexaenoic acid: a positive modulator of Akt signaling in neuronal survival. Proc Natl Acad Sci U S A. 2005;102: 10858–10863. 10.1073/pnas.0502903102 [DOI] [PMC free article] [PubMed] [Google Scholar]
- 51.Lee YS, Carthew RW. Making a better RNAi vector for Drosophila: use of intron spacers. Methods. 2003;30: 322–329. [DOI] [PubMed] [Google Scholar]
- 52.Roberts DB. Drosophila A Practical Approach. Hames BD, editor. Oxford: Oxford University Press; 1998. ISBN: 9780199636600 [Google Scholar]
- 53.Zhang H, Liu J, Li CR, Momen B, Kohanski RA, Pick L. Deletion of Drosophila insulin-like peptides causes growth defects and metabolic abnormalities. Proc Natl Acad Sci U S A. 2009;106: 19617–19622. 10.1073/pnas.0905083106 [DOI] [PMC free article] [PubMed] [Google Scholar]
- 54.Weinkove D, Neufeld TP, Twardzik T, Waterfield MD, Leevers SJ. Regulation of imaginal disc cell size, cell number and organ size by Drosophila class I(A) phosphoinositide 3-kinase and its adaptor. Curr Biol. 1999;9: 1019–1029. [DOI] [PubMed] [Google Scholar]
- 55.Stocker H, Andjelkovic M, Oldham S, Laffargue M, Wymann MP, Hemmings BA, et al. Living with lethal PIP3 levels: viability of flies lacking PTEN restored by a PH domain mutation in Akt/PKB. Science. 2002;295: 2088–2091. [DOI] [PubMed] [Google Scholar]
- 56.Gronke S, Beller M, Fellert S, Ramakrishnan H, Jackle H, Kuhnlein RP. Control of fat storage by a Drosophila PAT domain protein. Curr Biol. 2003;13: 603–606. [DOI] [PubMed] [Google Scholar]
- 57.Sandstrom P, Welch WH, Blomquist GJ, Tittiger C. Functional expression of a bark beetle cytochrome P450 that hydroxylates myrcene to ipsdienol. Insect Biochem Mol Biol. 2006;36: 835–845. 10.1016/j.ibmb.2006.08.004 [DOI] [PubMed] [Google Scholar]
Associated Data
This section collects any data citations, data availability statements, or supplementary materials included in this article.
Supplementary Materials
The relative lipid contents, calculated from neutral LipidTOX stainings, for experiments shown in the main Figures. (A,B) Flp-out clones in the fat body expressing Dp110 in NR (A) or Dp110DN in Fed48 larvae (B). (C-E) PromE-GAL4 controls in Fed48 and NR larvae (C) and PromE-GAL4 driven expression of Dp110 or Dp110DN in Fed48 (D) and NR (E) larvae. (F,G) PromE-GAL4 driven expression of RNAi for Acc, Dgat1, Cyp4g1 and Cpr, or of Lsd2 overexpression in Fed48 (F) and NR (G) larvae. (H) Cyp4g1Δ4 mutant NR larvae. (I,J) PromE-GAL4 driven expression of RNAi for Kar or FarO in Fed48 (I) and NR (J) larvae. Quantifications in (A-E) correspond to Fig 1, (F-H) correspond to Fig 2 and (I,J) correspond to Fig 4. In this and subsequent graphs, error bars represent 1 s.d. and asterisks show statistical significance in Student t tests (*p<0.05, and **p<0.001), compared to the one fold control condition unless otherwise indicated
(TIF)
(A, B) Fat body cell areas in Flp-out clones. Dp110 overexpression increases cell size relative to controls in NR larvae (A) and Dp110DN expression decreases cell size relative to controls in Fed48 larvae (B). (C, D) Quantitation of Oenocyte membrane p-Akt expression. Membrane p-Akt expression increases significantly in Fed48 (C) or NR (D) larvae following PromE-GAL4 driven Dp110 overexpression whereas the decreases following Dp110DN expression are not statistically significant. (E-G) Relative oenocyte volumes in Fed48 (E, G) or NR (F) larvae significantly increase following PromE-GAL4 driven Dp110 overexpression or Flp-out clonal expression of myrAkt. Oenocyte volumes significantly decrease following PromE-GAL4 or Flp-out clonal expression of Dp110DN.
(TIF)
Panels in top two rows show endogenous FoxO expression in fat body (left) and oenocytes (right, marked with PromE>mGFP) from Fed48 and NR66 larvae. Redistribution of FoxO from the cytoplasm to the nucleus (associated with decreased PI3K signaling) during NR is more pronounced in the fat body than in oenocytes. The nuclei of NR oenocytes (white arrowhead) express less FoxO than the nuclei of neighboring NR epidermal cells (yellow arrowhead). Panels in the bottom row show expression of the tGPH reporter for PI3K activity in fat body (left) and oenocytes (right) from Fed48 and NR66 larvae. Membrane expression of EGFP fused to the pleckstrin homology domain of Grp1 (a readout for PI3K activity in some but not in all cell types) is clearly decreased during NR in fat body but in oenocytes the NR change is less noticeable. Scale bar is 10 μm.
(TIF)
Clusters of oenocytes from NR larvae, marked with streptavidin-A555 and showing lipid droplets (LipidTOX) and nuclei (DAPI). (A) Larvae deficient for Ilp6 (Df(1)Ilp6) show lipid droplet induction similar to controls (w1118). (B) Larvae with fat body-specific RNAi knockdown of Ilp6 (Cg>Ilp6 Ri) show lipid droplet induction similar to controls (Cg-GAL4). Scale bar is 20 μm. (C) Most Acc, Kar, Cpr and Cyp4g1 RNAi larvae retain watertight trachea. Graph shows the percentage of larvae of various genotypes showing tracheal flooding at the early L3 stage. Asterisks indicates p<0.01. Each larval genotype carried the oenocyte-specific driver Pro-mE-GAL4 and the respective UAS-RNAi transgene indicated. The control genotype used was PromE-GAL4 crossed to w1118 and "oenocyte-less" refers to PromE>reaper.
(TIF)
(A) Antibody staining for Acc, Kar, Cyp4g1 and Cpr in oenocytes following PromE-GAL4 driven RNAi in NR larvae. Scale bar is 20μm. (B) Staining for Kar in nlsGFP positive Flp-out clones expressing Kar Ri in oenocytes. Scale bar is 10μm. (C) Graph of relative immunostaining intensity for Kar protein in Kar Ri oenocyte Flp-out clones during NR. (D-G) Graphs of relative staining intensity in oenocytes for Acc (D), Kar (E), Cyp4g1 (F) and Cpr (G) proteins following PromE-GAL4 driven RNAi knockdown of the corresponding genes in NR larvae.
(TIF)
(A) Neither Kar nor FarO RNAi detectably alter lipid droplets in the fat body. Flp-out clones for Kar RNAi (top row) or FarO RNAi (bottom row), marked with nlsGFP, show no detectable change in lipid droplets (LipidTOX), nuclear size or cell size in NR larvae. Nuclei are marked with DAPI and the scale bar is 10μm. (B, C) Oenocyte FarO Ri Flp-out clones in NR larvae, marked by nlsGFP, show decreased LipidTOX staining (B) and significantly decreased relative neutral lipid content (C) than control neighboring cells. Oenocyte Kar expression is not altered in FarO Ri Flp-out clones. (D, E) FarO and Kar do not regulate oenocyte volumes at the late larval stage. PromE-GAL4 mediated expression of Kar or FarO RNAi alone or in combination with Dp110DN in Fed66 larvae. In contrast to Fed48 and NR66 larvae, oenocyte volumes in Fed66 larvae are not significantly altered by Kar or FarO RNAi, although they remain PI3K dependent.
(TIF)
(A) In Fed48 larvae, PromE>Dp110DN induces a low level of oenocyte lipid droplets that are suppressed in PromE>FarO Ri Dp110DN. In NR larvae, PromE>Dp110DN does not noticeably alter lipid droplet induction and thus inhibition of NR droplet induction is similar in PromE>FarO Ri and in PromE>FarO Ri Dp110DN. In both Fed48 and NR larvae, oenocyte volume in PromE>FarO Ri Dp110DN is intermediate between that of PromE>FarO Ri alone and PromE>Dp110DN alone. Panels show single confocal sections and the scale bar is 10 μm. (B) Relative neutral lipid content of oenocytes from Fed48 larvae for the genotypes in panel A. Note that FarO is required for the increase in lipid droplets in fed larvae following PI3K inhibition. (C) Oenocyte volumes for the genotypes in panel A in Fed48 and NR66 larvae.
(TIF)
(A, B) Quantitation of membrane p-Akt intensity, relative to the control genotype, in NR oenocytes expressing FarO RNAi (A) or Kar RNAi (B). Membrane p-Akt intensity increases 1.7 fold with Kar RNAi but does not change significantly with FarO RNAi. (C) Panels show p-Akt staining in an oenocyte cluster (marked with mGFP) from control and Kar knockdown (PromE>Kar RNAi) NR66 larvae. Kar RNAi knockdown is associated with increased membrane p-Akt expression. Scale bar is 10 μm.
(TIF)
Data Availability Statement
All relevant data are within the paper and its Supporting Information files.