Abstract
We report the first wide-field microscope for measuring two-dimensional infrared (2D IR) spectroscopic images. We concurrently collect more than 16 000 2D IR spectra, made possible by a new focal plane array detector and mid-IR pulse shaping, to generate hyperspectral images with multiple frequency dimensions and diffraction-limited spatial resolution. Both frequency axes of the spectra are collected in the time domain by scanning two pairs of femtosecond pulses using a dual acousto-optic modulator pulse shaper. The technique is demonstrated by imaging a mixture of metal carbonyl absorbed polystyrene beads. The differences in image formation between FTIR and 2D IR microscopy are also explored by imaging a patterned USAF test target. We find that our 2D IR microscope has diffraction-limited spatial resolution and enhanced contrast compared to FTIR microscopy because of the nonlinear scaling of the 2D IR signal to the absorptivity coefficient for the vibrational modes. Images generated using off-diagonal peaks, created from vibrational anharmonicities, improve the molecular discrimination and eliminate noise. Two-dimensional wide-field IR microscopy provides information on vibrational lifetimes, molecular couplings, transition dipole orientations, and many other quantities that can be used for creating image contrast to help disentangle and interpret complex and heterogeneous samples. Such experiments made possible could include the study of amyloid proteins in tissues, protein folding in heterogeneous environments, and structural dynamics in devices employing mid-IR materials.
Keywords: nonlinear microscopy, ultrafast spectroscopy, pulse shaping, chemical imaging, 2D IR, hyperspectral imaging
Graphical Abstract
Imaging techniques that rely on the nonlinear interaction of light with matter have been invaluable to the study of biology and materials science. Methods such as two-photon absorption,1 second-harmonic generation,2 transient absorption,3–5 and coherent anti-Stokes Raman scatttering6,7 (CARS) have all been instrumental in developing a more complete understanding of complex systems. Additionally, there has been recent interest in combining ultrafast spectroscopic techniques with microscopy to spatially map chemical dynamics.8 While all of these techniques are nonlinear in their light–matter interactions, they provide essentially one-dimensional spectra. For example, CARS generates a Raman spectrum of vibrational frequencies. In contrast, nonlinear spectroscopies, such as two-dimensional infrared spectroscopy (2D IR) and two-dimensional visible spectroscopy,9,10 provide multiple frequency axes that correlate optical transitions. Combining nonlinear microscopy with multidimensional spectroscopy would enhance the information content of images and provide new modes of contrast.
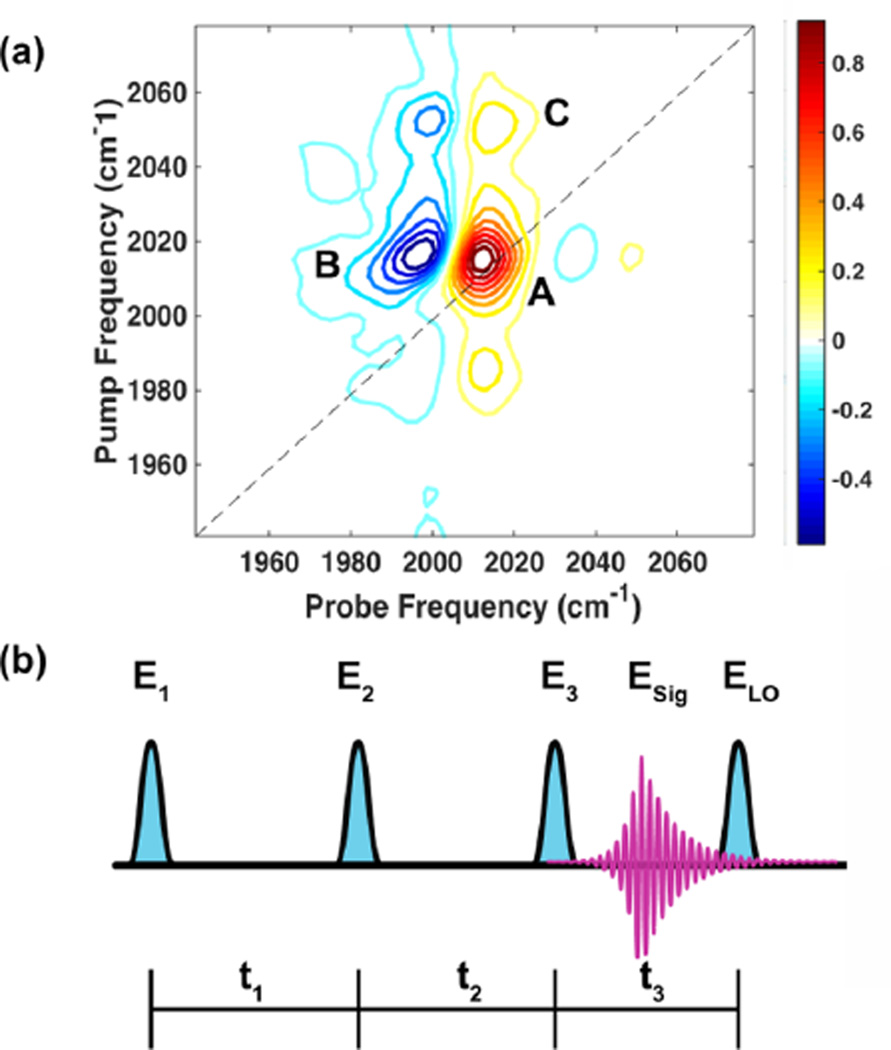
FTIR spectroscopy and imaging have long been utilized as simple, nondestructive, and label-free modes of chemical contrast.11,12 2D IR spectroscopy, the multidimensional analog of FTIR, is an ultrafast technique that has contributed to the study of protein folding13 and aggregation,14,15 liquid structure,16–19 and the dynamics of small molecules.20–22 2D IR spectroscopy exhibits sensitivity to molecular structure and local environments by spreading the vibrational spectrum across a pump and a probe frequency axis. Figure 1 shows a typical single-pixel 2D IR spectrum of dimanganese decacarbonyl (Mn2(CO)10, DMDC). A 2D spectrum consists of a positive peak along the diagonal that arises from ground-state bleach and stimulated emission of the ν = 0 to ν = 1 transition (red contours, labeled A in Figure 1a) and an anharmonically shifted negative peak that comes from excited-state absorption from the ν = 1 to ν = 2 transition (blue contours, labeled B in Figure 1a). The line shapes in a 2D spectrum report on the relative contributions of the homogeneous and inhomogeneous line widths to the total line shape measured in a conventional linear spectrum. The change in the 2D line shape as a function of time delay between the pump and the probe pulses yields information on the time scale of structural dynamics and solvation.23 Additionally, cross-peaks located off of the diagonal (labeled C in Figure 1a) can reveal energy transfer,24 chemical exchange,25 or vibrational coupling, which can assist in the determination of molecular structure and dynamics.26 With 2D wide-field IR microscopy we show below that we can now measure the spatial dependence of these properties, which opens the door to new ultrafast 2D IR experiments on complex, heterogeneous systems.
Figure 1.
Example 2D IR spectrum and general pulse sequence to measure 2D IR spectra. (a) 2D IR spectrum of Mn2(CO)10 absorbed in a polystyrene sphere. Peak A is a fundamental transition at ν = 0–1, peak B is its corresponding excited-state absorption transition (sometimes called the overtone or sequence band) at ν = 1–2, and peak C is one of a pair of cross-peaks. (b) Generic pulse sequence of two “pump” pulses, E1 and E2, a probe pulse, E3, the signal-free induction decay, Esig, and the local oscillator, ELO. Time delays are given by tn.
2D IR images can be generated using a standard spectrometer by carefully focusing all the laser pulses and raster scanning across the sample. In this manner, Valim et al. generated images using a mixed infrared/visible homodyne variant of 2D IR.27 Baiz et al. used a commercial IR microscope and a pulse shaper to create images from a grid of 2D IR spectra collected one after the other.28 These experiments serve as great examples of the new modes of contrast multidimensional spectroscopic imaging can offer.
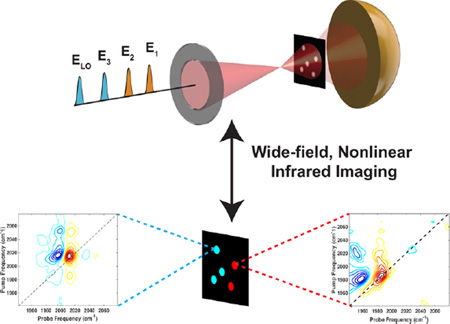
With the exception of recent two-photon29 and CARS experiments,30 all nonlinear microscopy experiments to date have relied on point-mapping or confocal methods to produce spatial resolution. In contrast to point-mapping methods, we simultaneously collect thousands of 2D IR spectra (one 2D spectrum per image pixel), from which we spatially map 2D IR spectral features with diffraction-limited resolution. We call our technique two-dimensional wide-field infrared microscopy, or 2D-WIRM.
Figure 1b shows a generic pulse sequence for measuring 2D IR spectra. Most researchers in the field use a mixed “time–frequency” method of data acquisition.31 In this scheme, the pump frequency dimension is acquired by scanning the time delay between two pump pulses, E1 and E2. A third pulse, E3, probes the sample, and the 2D IR signal field, Esig, is emitted in the phase-matching direction. The spectrum of Esig is then measured in the frequency domain by dispersing the signal and a reference pulse, often referred to as the local oscillator, ELO, in a spectrograph (in some experimental implementations of 2D IR, E3 is also used as ELO). By Fourier transforming the Esig spectrum as a function of the pump pulse time delay, t1, one generates the pump frequency axis of a 2D IR spectrum. Taking the approach of Baiz et al., an image can be generated by scanning the sample to generate spatial resolution.28 When point mapping, the detector is used to measure the spectrum of Esig rather than its spatial distribution. Wide-field imaging requires a different approach for detection because the detector measures an image and so cannot be used to measure the spectrum. Instead, we recover the spectrum of Esig by collecting images for a series of time delays between E3 and ELO for each delay between E1 and E2. In other words, we eliminate the need for the spectrograph by scanning both the t1 and t3 time delays and subsequently compute a double Fourier transform to generate the two axes of a 2D IR spectrum.26 A similar procedure is used in other 2D spectroscopies that use nonoptical detection.32,33 In this manner, a 2D IR spectrum is simultaneously generated for each pixel on the camera with a spatial resolution and field of view set by the focusing conditions of the microscope.
In this article, we report diffraction-limited 2D IR images collected using a 128 × 128 pixel mercury cadmium telluride (MCT) focal plane array (FPA). Only recently has the FPA technology progressed enough to be compatible with the kHz repetition rate of regeneratively amplified ultrafast laser systems. We use two germanium acoustic optic modulators (AOMs) to create the desired pulse sequences. The AOM pulse shapers allow the time delays and phases of each pulse to be updated shot-to-shot for rapid data acquisition and background subtraction.34 This is, to our knowledge, the first implementation of wide-field, nonlinear microscopy in the mid-IR.
RESULTS AND DISCUSSION
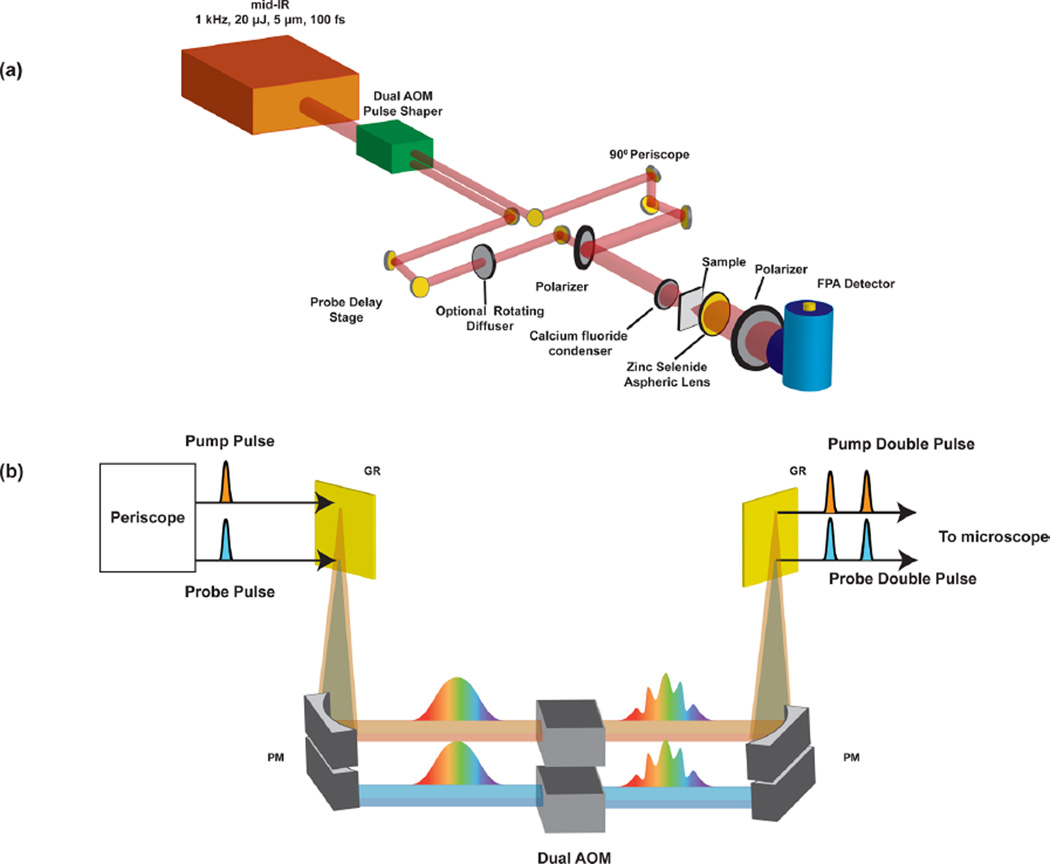
The 2D-WIRM microscope was constructed by addition of a pump pulse pair, generated with a mid-IR pulse shaper, to our FTIR microscope, described in detail previously.35 A schematic of the setup is given in Figure 2. In brief, the 1 kHz output of a regenerative amplifier (Coherent Libra) is used to pump a commercial optical parametric amplifier (OPA, TOPAS, Light Conversion) and a home-built difference frequency generation (DFG) module. The 20 µJ mid-IR pulses are approximately 100 fs in duration and centered at a wavelength of 5 µm. The output is sent through a periscope, where a 90/10 beam splitter is used to generate vertically offset beams that are sent into a pulse shaper equipped with two Ge-AOMs stacked on top of each other.36 Although we shape using stacked AOMs, two separate pulse shapers would serve the same purpose. Pulses are modulated in the frequency domain in a 4f-geometry. After shaping to generate two pairs of double pulses, the pump polarization is rotated 90° relative to the probe before both pump and probe pulses are collinearly overlapped using a wiregrid polarizer. The light is focused with a calcium fluoride lens to illuminate a ~100 µm diameter area on the sample, which can be adjusted depending on the desired field of view. A 0.7 numerical aperture ZnSe aspheric lens is used as the imaging objective to form an image at the focal plane on the FPA. A wire grid polarizer is placed before the detector to prevent pump light from saturating the MCT detector.
Figure 2.
Schematic of the 2D-WIRM microscope. Diagram of the laser and optical layout (a) and dual AOM pulse shaper (b). FPA: focal plane array, AOM: acousto-optic modulator, MR: mirror, PM: 1D parabolic mirror, GR: grating.
The magnification of the microscope is set by moving the FPA and the sample relative to the objective to satisfy the thin lens equation. For the images reported, the camera is set to generate a 36× magnification image. The physical size of the pixels is about 40 × 40 µm, which means each pixel records a 1.1 µm area under these focusing conditions. In the Supporting Information, we also report 50× magnification images that have a pixel size of about 0.8 µm. These images oversample the airy disk of the point-spread function, which we use to measure the spatial resolution of our microscope.
As described above, our approach is to measure the third-order response function, Esig, at each image pixel utilizing the time–time method of acquisition.26 More specifically, one AOM generates the pump pulse pair to set the t1 delay and phases of E1 and E2. The other AOM generates the probe pulse pair to set the t3 time delay and the phases of E3 and ELO. For the data presented in this paper, t1 was scanned from 0 to 3.48 ps in 60 fs increments, while t3 was scanned from 0 to 3.48 ps in 30 fs steps. The phase of the moving pulse was adjusted at each time delay to shift the observed frequency of the signal by 1900 cm−1. This “rotating frame” allows for unambiguous undersampling of the two-dimensional interferogram and significantly decreases the number of data points needed to satisfy the Nyquist criterion.34 The waiting time, t2, was set to ~1 ps using a translation stage, although scanning this time could be used to study the ultrafast evolution of the 2D spectrum and would provide even more contrast mechanisms, as recently demonstrated by Baiz et al.28 For the experiments reported, we collect over 16 000 spectra in about 50 s. The pulse sequence is then repeated until the desired signal-to-noise ratio is achieved. All images reported required about 2 h to collect.
There are many types of 2D IR spectra. We are interested in generating absorptive spectra because they have the highest frequency resolution.31,37 Absorptive spectra are produced by adding together the rephasing and nonrephasing components of the third-order response function. In addition to these desired signals, the collinear optical geometry of the 2D-WIRM microscope also results in lower order signals and pulse interferences that create a background, only some of which are reduced by the polarizer before the detector. To eliminate these unwanted signals, we utilize the phase dependence of the 2D IR signal, S2DIR, which is given by3,31,38
| (1) |
where ϕi is the phase, in radians, of the ith laser pulse. Table 1 illustrates the phases used for each pulse sequence. After collecting all of these phase combinations for each t1 and t3 time delay, the data can be processed as in eq 2 or 3, depending on the plotting convention desired.
| (2) |
| (3) |
From the time-domain data the 2D IR spectra are generated by computing a two-dimensional Fourier transform.
Table 1.
Phase Cycling Scheme for Isolating the 2D IR Signala
| ϕ1 | ϕ2 | ϕ3 | ϕLO | |
|---|---|---|---|---|
| S1 | 0 | 0 | 0 | 0 |
| S2 | π | 0 | 0 | 0 |
| S3 | 0 | π | 0 | 0 |
| S4 | π | π | 0 | 0 |
| S5 | 0 | 0 | π | 0 |
| S6 | π | 0 | π | 0 |
| S7 | 0 | π | π | 0 |
| S8 | π | π | π | 0 |
Sn are the signals for each of the individual pulse sequences that are linearly combined, each using the indicated phases for each laser pulse ϕn.
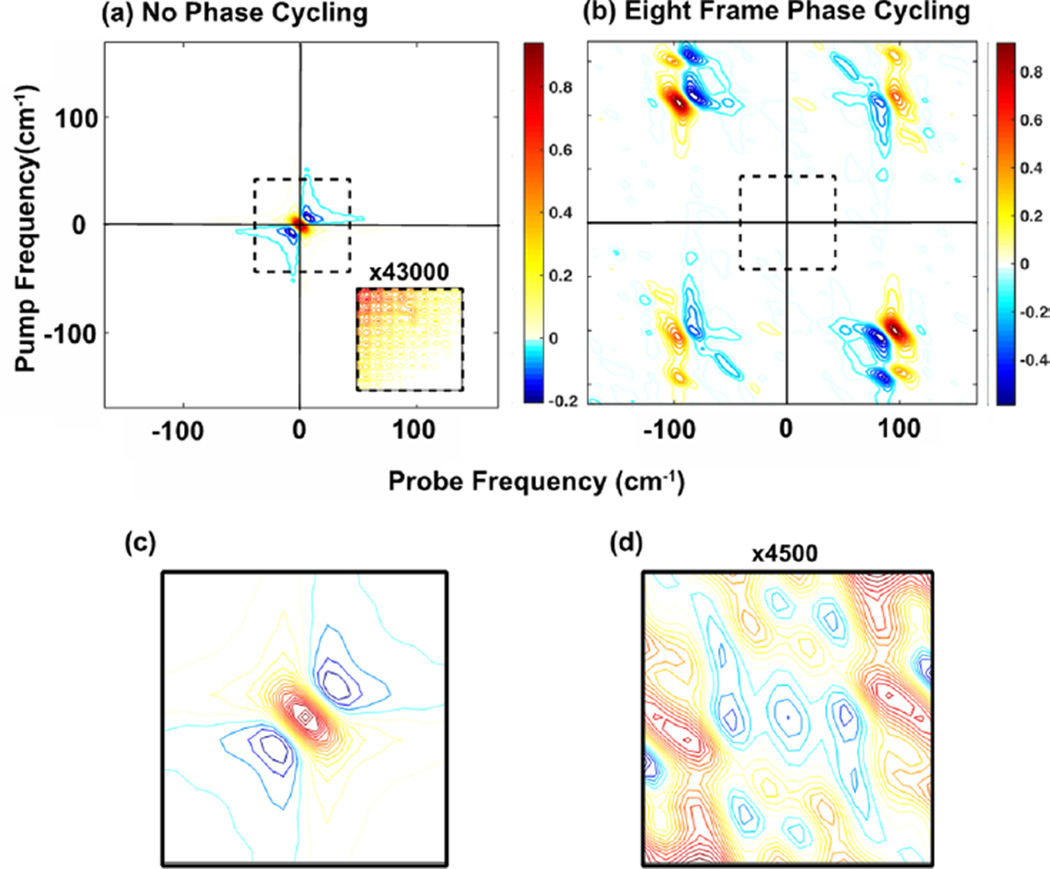
Figure 3 demonstrates the reduction in background when phase cycling. 2D IR spectra shown were collected in the 2D-WIRM microscope without (a) and with (b) phase cycling. In Figure 3a a very large feature is observed at zero frequency that is created by the background signals. It completely obscures the 2D spectrum. In Figure 3b phase cycling reduces this background feature by a factor of ~43 000 to reveal rephasing and nonrephasing spectra in their respective quadrants.31,38 Figure 3c and d illustrate the reduction of this zero-frequency feature. Absorptive spectra are generated by adding the rephasing and nonrephasing components together (not shown). Indeed, even when plotting more contours or zooming in to the regions where we know there is 2D signal, the inset in (a), the signal is still unobservable and dominated by the wings of the zero-frequency feature. This eight-frame phase-cycling scheme is well known to be advantageous and has been used in other 2D spectroscopies.28,38,39
Figure 3.
Demonstration of background reduction with an eight-frame phase cycling scheme. (a) Averaged spectrum without phase cycling that is dominated by a large zero-frequency feature. The inset shows the region where there should be signal multiplied by 43 000. (b) Averaged spectrum with phase cycling revealing the rephasing and nonrephasing spectra. The axis labels are shown before correction with the rotating frame frequency. (c) Zero-frequency feature, labeled with the black box in (a), that dominates without phase cycling. (d) The same frequency region as in (c) but with phase cycling multiplied by 4500. This region is now only noise.
To test the microscope, we measure polystyrene beads labeled with one of two different metal carbonyl solutions. The experimental details for preparing polystyrene beads are provided in the Methods section. Briefly, polystyrene beads were soaked in saturated solutions of either dimanganese decacarbonyl or tungsten hexacarbonyl (W(CO)6) for about 2 h. They were then spun down and washed in methanol. Beads were deposited onto a calcium fluoride window and dried under nitrogen before imaging. At the frequency of their respective transition, the 106–120 µm beads have an optical density of about 0.6, while we estimate the 25 µm beads to have an optical density of about 0.05–0.075.
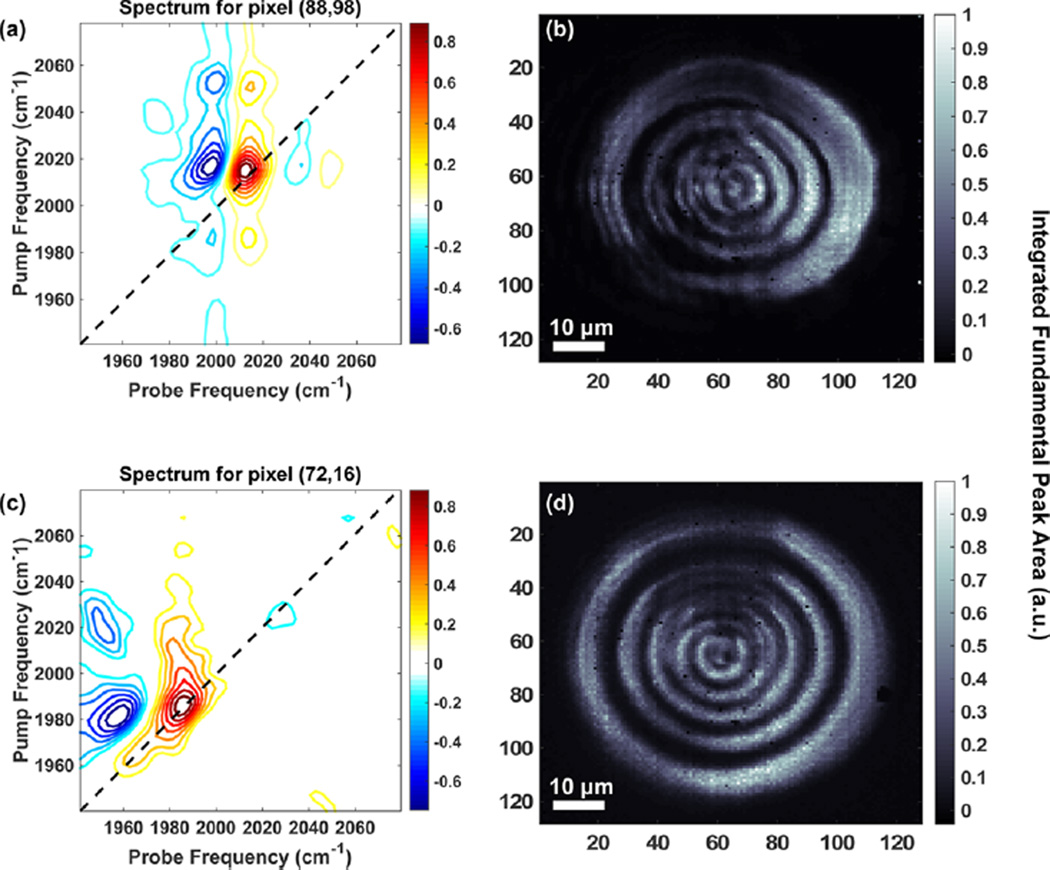
In Figure 4 we present images of ~110 µm polystyrene beads swelled in DMDC and W(CO)6. Figure 4a shows a 2D IR spectrum at pixel (x = 88, y = 98) on the FPA detector for a bead labeled with DMDC. The spectrum matches solution phase data, as expected. Figure 4b shows the corresponding image of the integrated fundamental peak area (peak A in Figure 1a). Similarly, in Figure 4c and d we plot a single-pixel 2D IR spectrum and corresponding image for a W(CO)6-labeled polystyrene bead. Interestingly, the cross-peak off the diagonal in Figure 4c does not appear in solution spectra of W(CO)6. We attribute this to an accidental degeneracy with a combination or overtone band whose oscillator strength is larger in the polystyrene environment, although we do not explore this observation further.40
Figure 4.
2D-WIRM images of ~110 µm beads. (a) Representative single-pixel 2D IR spectrum and (b) image of the fundamental integrated peak area of a bead labeled with DMDC. (c) Representative 2D IR spectrum and (d) image of the integrated fundamental peak area of a bead labeled with W(CO)6.
The concentric rings in the intensity image are created by refraction and diffraction of the spatially and temporally coherent probe pulse. While the image on the detector contains interferences, illumination at the sample is uniform because the interference effects are significant only in the far field. Most wide-field microscopes use incoherent illumination or measure fluorescence and do not contain the coherent interferences in our images. The coherent images are difficult to interpret by eye because it contains extra spatial phase information not typically present in incoherent images. In principle, the interferences can be removed by measuring the point-spread function. The point-spread function could be measured by passing a local oscillator around the sample and thereby measuring the spatial phase shift introduced by the optical path of the microscope.41,42 If the point-spread function is not measured, it could be modeled using a maximum entropy method to obtain the most likely phase distribution at the image plane.43 In the future, we plan to deconvolute the 2D IR images, but for now we experimentally scramble the spatial coherence using a rotating diffuser, as reported previously.35,44
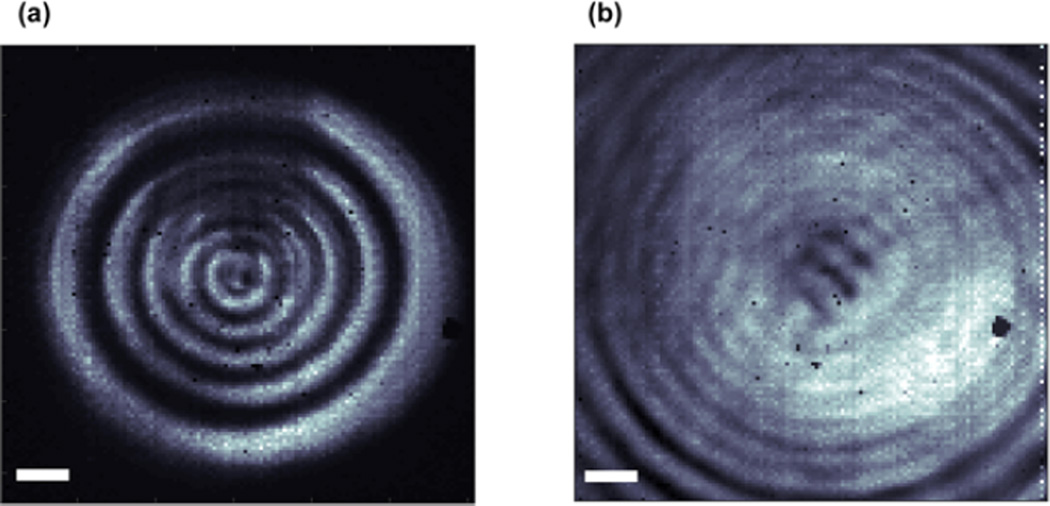
To implement this alternative approach in the 2D-WIRM microscope, we place the rotating diffuser on the probe line (see Figure 2) and rotate it at ~2 Hz. Figure 5 shows a comparison between 2D-WIRM images collected with and without the rotating diffuser, in addition to a white-light image of a representative bead. The white-light image is very uniform but has low contrast. The 2D IR images have much higher contrast because they come from the molecular absorption. The diffuser helps to alleviate coherent artifacts because it decreases the spatial coherence of the probe pulse. A diffuser is not needed in the pump line because only the probe light is used to measure the spatial distribution of the 2D IR spectra. The rotating diffuser is used to scramble the spatial phase of the incoming light. To completely eliminate the interferences, the spatial phase must average to zero for each pixel on the detector. In the limit of infinite random phase distributions, a perfectly incoherent image would be recovered. The 2D IR signal depends only on the relative phases of the laser pulses,; thus this random spatial phase will introduce only a small decrease in signal-to-noise. In this image the diffuser does not completely remove the interferences. The diffuser is most effective at lower magnifications35 because it is easier to create phase differences on the order of the pixel size. The interferences can create images that are not intuitive to interpret, but they also provide more information about the signal. For example, the interferences have been exploited to measure the 3D topography.41,42 Thus, they can be diminished or exploited to learn more about the sample. In the image with the diffuser, the bead appears slightly larger because incorporating the diffuser requires adjustments to the microscope focus to maximize throughput and minimize coherent interferences. These adjustments can slightly move the image plane, and so a strict comparison between bead sizes in Figure 5 should not be made.
Figure 5.
Comparison of 2D-WIRM images collected (a) without and (b) with a rotating diffuser and (c) a white light image of a representative bead. Scale bars are 10 µm. Colorbar for (a) and (b) is the same as that of Figure 4.
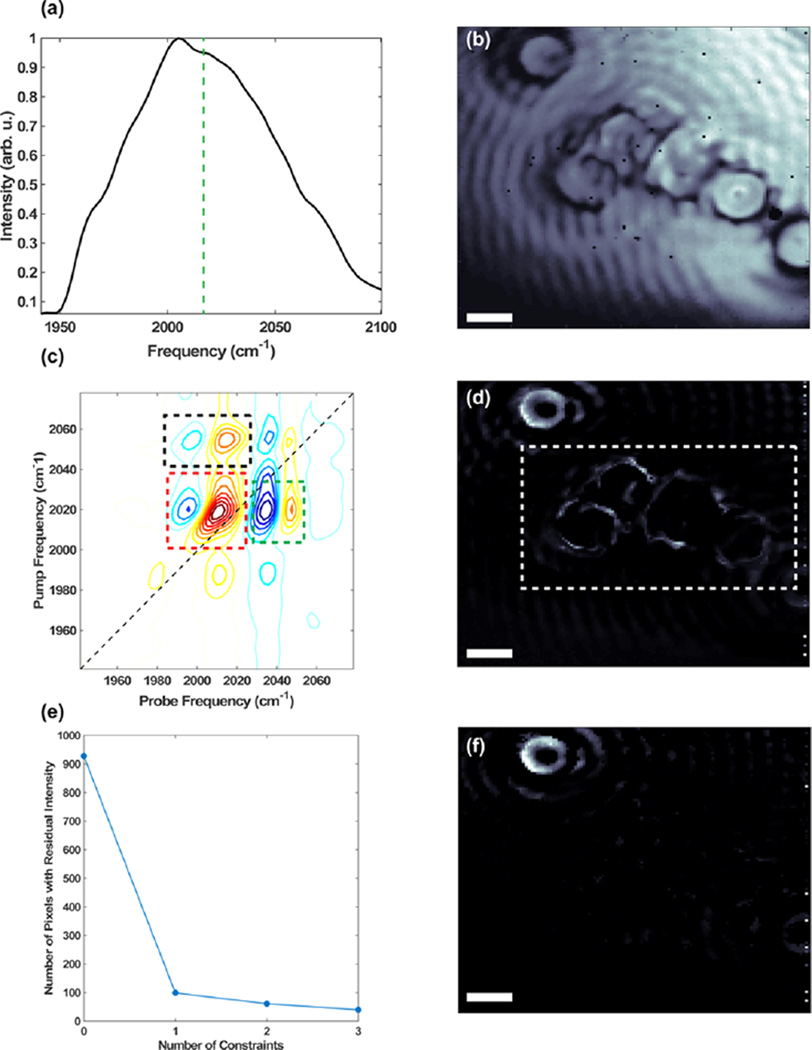
2D IR spectra contain many more observables than conventional FTIR spectra, such as off-diagonal peaks created by transitions to overtone and combination bands. In Figure 6, we show that 2D-WIRM images generated with constraints that include off-diagonal features dramatically improve image quality. To this end, we image mixtures of 25 µm diameter beads labeled with different metal carbonyl molecules. Figure 6a shows the probe spectrum with the frequency of the DMDC transition marked with the dashed line at 2015 cm−1. The resulting image reveals six beads with about equal intensities. These beads likely have different labels, but it is impossible to tell since the linear absorption is below our microscope’s signal-to-noise. We performed various background subtraction methods, in the time and frequency domain, but were unable to observe the linear spectrum.
Figure 6.
Comparison of image quality for different processing methods. (a) Spectrum of the probe pulse used to generate FTIR transmission image (b) at 2015 cm−1. Representative DMDC (c) 2D IR spectrum and (d) 2D IR amplitude image of the DMDC peak with no constraints. (e) Graph showing pixels in the dashed white box with residual intensity with the indicated constraints in (c) labeled by the dashed boxes. (f) Amplitude image generated by including only spectra with out-of-phase peaks (i.e., one constraint) in the dashed red box in (e). All scale bars are 10 µm.
Figure 6c shows a representative single-pixel 2D IR spectrum of the DMDC bead. Clearly, even though we cannot observe the linear absorption spectrum, a 2D IR spectrum is readily measured. Figure 6d shows the resulting image made by plotting the intensity of the diagonal peak of DMDC. The 2D-WIRM image clearly shows that the bead in the upper corner is labeled with DMDC, although there is some signal in other regions. This could come from (1) noise or (2) leakage of the metal carbonyls upon mixing. If there is leakage of the labels outside of the beads, these regions should show an off-diagonal peak characteristic of the 2D spectrum of DMDC. Shown in Figure 6c is a dashed red box that encompasses both the fundamental and an overtone transition of DMDC, which have opposite signs. Figure 6f is a 2D-WIRM image that plots the fundamental intensity, but only if there is a corresponding negative intensity at the frequency of the overtone. In other words, we are plotting only the intensity of pixels that show signal that is characteristic of a 2D spectrum. In this image, only the upper left bead shows any intensity, indicating that the residual intensity in Figure 6d was due to noise. Noise in a 2D IR spectra is random. Thus, the more constraints that are applied, the better the molecular discrimination. This is illustrated in Figure 6e by plotting the residual intensity in the dashed white box in Figure 6d. As more constraints are applied to the DMDC 2D IR image, the number of pixels with residual intensity in the dashed white box, the region with no DMDC beads, is dramatically decreased. This demonstrates that 2D IR microscopy can improve molecular discrimination even with weakly absorbing samples.
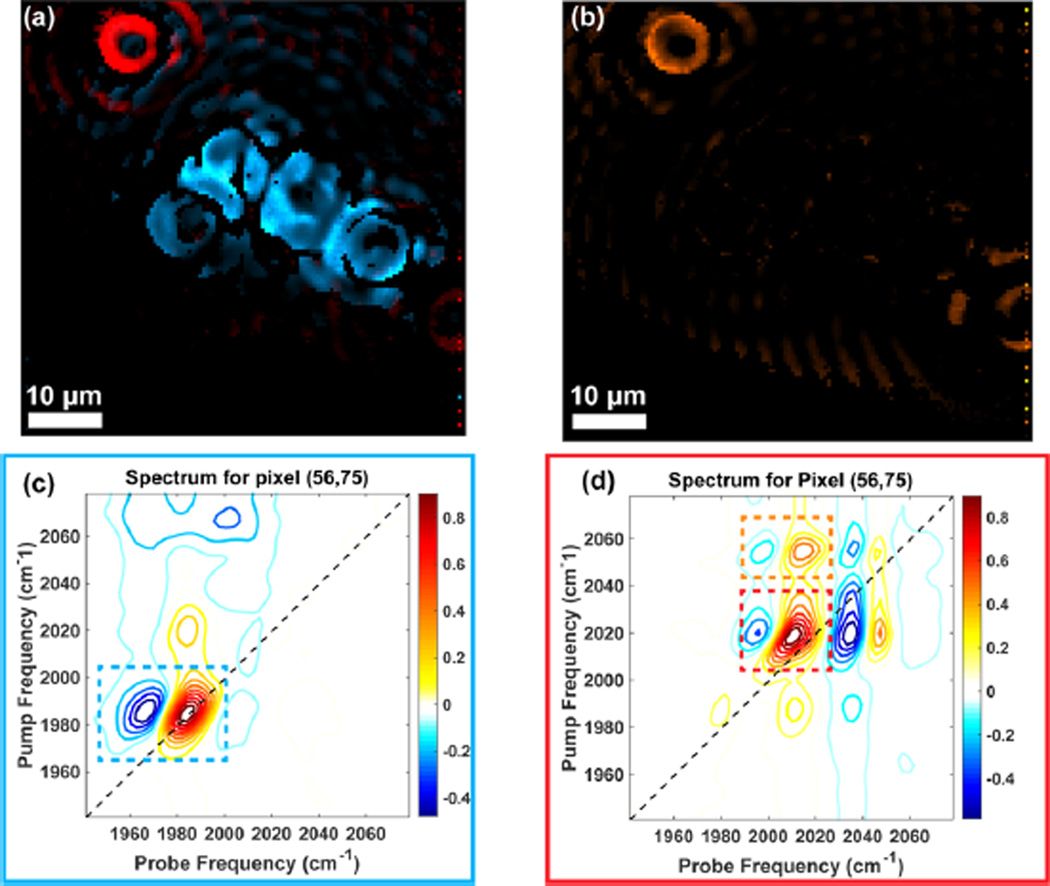
Analogous to the hyperspectral cube, as it is often called in the FTIR imaging community,12 we have two frequency and two spatial dimensions, or a hyperspectral tesseract. This multidimensional data can be used to generate false color images with different colors mapped to distinct spectral features. Figure 7a shows the fundamental intensity of W(CO)6 mapped to blue and the DMDC fundamental intensity mapped to red. Representative single-pixel 2D IR spectra are shown in Figure 7c and d, respectively. The images require a negative intensity at the frequencies of their respective excited-state absorption frequencies. It is clear that even with linear absorption that is difficult to observe with our microscope, we can still generate high-quality, single-pixel 2D IR spectra.
Figure 7.
Chemical images generated with 2D-WIRM. (a) Fundamental intensity of DMDC mapped to red and W(CO)6 mapped to blue. (b) Cross-peak image of the DMDC transition indicated by the dashed orange lines in (d). (c) 2D IR spectrum of W(CO)6 at the indicated pixel. (d) 2D IR spectrum of DMDC at the indicated pixel. Dashed boxes contain features used to generate the images.
Another advantage of 2D-WIRM is the multitude of spectral signatures that can be used as contrast mechanisms to generate images. Figure 7b shows the cross-peak amplitude of DMDC spatially mapped. In future experiments, we imagine that images like the one shown will aid in mapping vibrational coupling as a function of space, which can then be used to determine microscopic variations in molecular structure. Additionally, the waiting time dependence of cross-peaks can be used to observe energy transfer and chemical exchange in heterogeneous materials. Picosecond dynamics can improve the structural contrast in a 2D IR image to monitor hydration, for example,28,45–47 which might be interesting observables in a structurally heterogeneous system like a cell.
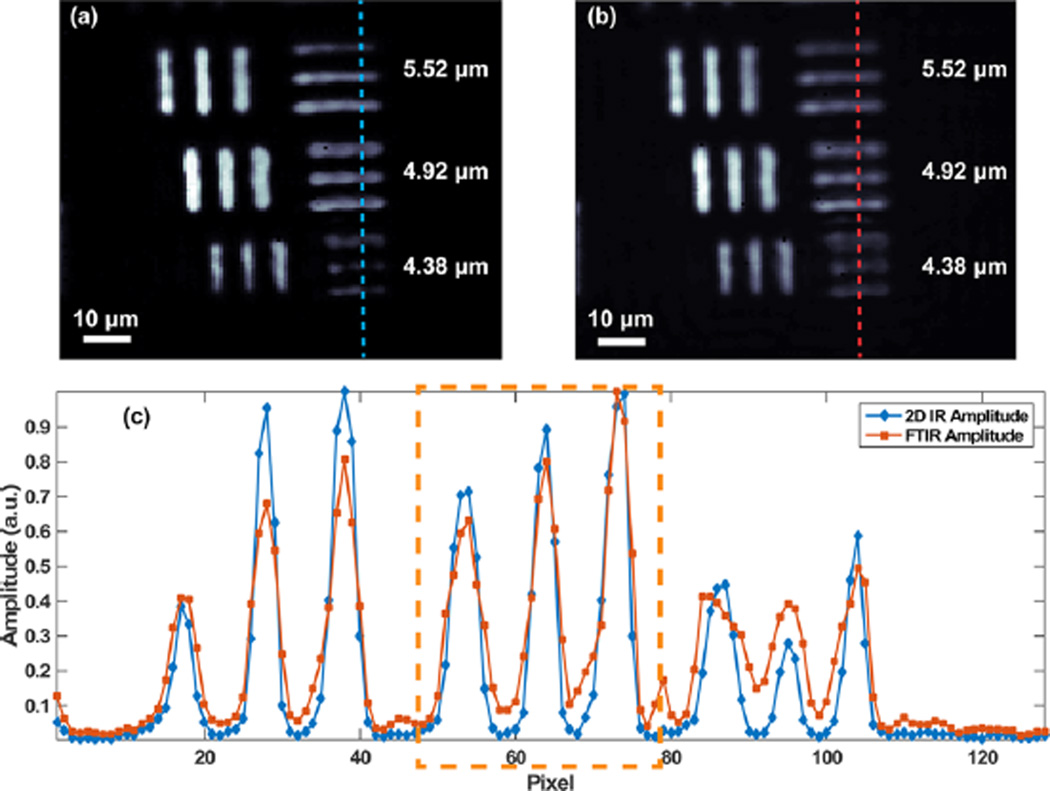
We also measured the spatial resolution of 2D-WIRM for comparison to FTIR microscopy. To do so, we used a negative USAF test target (Max Levy Autograph) patterned on calcium fluoride. A standard USAF test target consists of a series of equally spaced bars that are frequently used to test image formation in microscopes. DMDC was dissolved in methanol and placed between two calcium fluoride windows, one bare and one with the USAF test target pattern. Figure 8a shows a 2D IR amplitude image of elements four, five, and six of group 6, while Figure 8b shows the corresponding image of the test target at 2015 cm−1, the probe frequency of the DMDC fundamental peak. The element line widths and spacings are labeled in Figure 8a. Diffraction through the slits can lead to ringing features, as can been seen in the small line around pixel 80 in the FTIR scan.35,44 The interferences are less pronounced with the test target compared to the beads because it lacks the 3D topography of the large beads. To test the spatial resolution, we imaged group 7 elements, which are shown in the Supporting Information, and determined that there was no significant difference in spatial resolution between the FTIR and 2D-WIRM images.
Figure 8.
Comparison of image contrast and resolution between FTIR and 2D-WIRM imaging. (a) 2D IR amplitude image and (b) FTIR amplitude image at the probe frequency of the fundamental peak of a USAF test target with DMDC solution in the sample cell. (c). Slices through the columns indicated by the dotted lines in (a) and (b). Element line widths and spacings are labeled in (a) and (b).
From visually inspecting the slice, it seems that the 2D-WIRM image shows enhanced contrast as opposed to the conventional IR transmission image: the difference from peak to trough is exaggerated in 2D IR images compared to FTIR. To quantify the difference, we define a contrast ratio, C, as
| (4) |
where Speak is the signal at the peak of the elements and Strough is recorded at the trough. We used group 6, element 5 bar (orange box) to estimate the improvement in contrast. Using these elements, with the strongest 2D IR signal, the contrast ratio of 2D-WIRM is estimated to be about 0.96, while the FTIR is 0.77. The difference between the 2D-WIRM and FTIR contrast is even greater for the group 6, element 6 bar, separated by 4.38 µm, because these elements are even more closely spaced.48 We rationalize this observation using the dependence of linear and 2D IR measurements on the absorption cross-section. In 2D IR measurements, the signal scales with cross-section squared, while FTIR measurements scale linearly.49 The improved image contrast adds to the list of advantages that 2D IR exhibits over FTIR. The resolution is estimated to be at least 3.48 µm. We determined this number by measuring the smallest resolvable elements of the test target at the 20% contrast level (see Figure S2). The 3.11 µm features cannot be resolved; therefore, the resolution is between 3.11 and 3.48 µm (significant figures given by the manufacturer of the test target). As we observed in our previous FTIR experiments, this is better than the Rayleigh criterion of 0.61λ/NA which yields a predicted resolution of 4.3 µm.35
CONCLUSION
In summary, we have used a dual-AOM mid-IR pulse shaper in conjunction with a wide-field transmissive microscope to collect 2D IR spectroscopic images. We exhibited our ability to collect diffraction-limited 2D IR images of metal carbonyl beads and a USAF resolution test target. This is the first implementation of wide-field nonlinear microscopy in the mid-IR. Although these data use a combined AOM shaper, two separate pulse shapers could be used to generate 2D-WIRM images. Our images are diffraction limited and exhibit enhanced contrast compared to linear microscopy. Optimized pulse sequences and other technological developments could decrease acquisition time.50,51 One can also envision future experiments based on the many implementations of transient 2D IR spectroscopy.21,52 We anticipate wide-field 2D IR imaging will be complementary to point-mapping approaches; data collection on a per pixel basis is desirable, but point mapping might be better for sparsely mapping larger sample areas. With either method, the extra dimension of 2D-WIRM opens the door for new modes of chemical sensitivity and label-free biological imaging. This technique has the potential to impact researchers in the field of 2D IR spectroscopy by allowing more complicated, heterogeneous samples to be analyzed, in addition to IR microscopists, by offering new observables that could aid in cancer diagnostics and label-free characterization of tissues.
METHODS
Laser System
The output of a 4.0 W, 50 fs regenerative amplifier (Coherent Libra) with wavelength centered at 800 nm is used to pump a commercial OPA (TOPAS, Light Conversion). Signal and idler pulses are then mixed collinearly in a AgGaS2 DFG crystal to generate mid-IR with a center wavelength of 5 µm. Mid-IR pulses are about 100 fs in duration and have pulse energies around 20–22 µJ.
The mid-IR output is then sent through a 90/10 wedged CaF2 beam splitter. Immediately after, a periscope is used to generate vertically offset beams for separate shaping of the pump and probe pulses. Both pulses are shaped in the frequency domain using a dual, 4f Ge AOM (Isomet) based pulse shaper described previously.53 Two separate arbitrary waveform generators (AWGs) are used to generate RF masks to independently generate pump and probe double pulses with absolute control over their phases. Masks are updated at 1 kHz, the repetition rate of the laser, so pulses are shaped every laser shot. Pump and probe pulses are scanned in opposite directions in time, such that the waiting time, t2, is constant. The pump pulses’ polarizations are rotated 90° relative to the probe and subsequently recombined on a wire-grid polarizer. The collinear pulses are then sent to a home-built transmissive microscope. The IR light is focused using a 150 mm focal length CaF2 lens. The light is expanded over ~0.5 mm before illuminating the sample. A 0.7 numerical aperture (NA) zinc selenide aspheric lens (Edmund Optics) is used to form an image of the sample at the FPA detector, located about 450 mm away. A Teledyne Xcelera PCIe frame grabber is triggered by a 5 V square pulse that is emitted when the pump and probe AWG cards are each on the first mask of their respective sequences. For n pump masks, there are n ± 1 probe masks, with the last probe mask in the sequence being a null mask that is removed before processing. This allows for complete sampling of all n(n ± 1) combinations of phases and time delays. For the images reported here, we scanned to a max time delay of 3.48 ps with 30 fs time steps on the probe line and 60 fs time steps for the pump line. Additionally, the rotating frame of each AOM is set to be 1900 cm−1. With the eight-frame sequence used in this paper, that corresponds to 236 pump and 235 probe masks for a total of 55460 laser shots to generate a 2D spectrum.
Sample Preparation
Polystyrene beads were purchased from Polysciences and used as received. In this paper, we used 25 µm and 106–120 µm beads. The 106 µm beads were prepared by swelling them in chloroform solutions saturated with DMDC (Mn2(CO)10) or W(CO)6. After they had been soaked for 2 h, the chloroform solution was decanted and beads were washed in methanol. The beads were then dried on a CaF2 window before being placed in a sample cell for imaging. The 25 µm beads were prepared in the same manner, except that a mixture of 30% chloroform and 70% methanol, by volume, was used for swelling since pure chloroform solution was observed to overswell the beads.
Supplementary Material
Acknowledgments
Research reported in this publication was supported by the National Institute of General Medical Sciences of the National Institutes of Health under Award Number R01GM102387.
Footnotes
ASSOCIATED CONTENT
Supporting Information
- Schematic of the periscope used to generate vertically offset beams and 2D IR images of the smallest resolvable elements of the USAF test target (PDF)
The authors declare the following competing financial interest(s): M.T.Z. is a co-owner of PhaseTech Spectroscopy, which manufactures mid-IR pulse shapers and markets FPA detectors.
REFERENCES
- 1.Denk W, Strickler JH, Webb WW. Two-Photon Laser Scanning Fluorescence Microscopy. Science. 1990;248:73–76. doi: 10.1126/science.2321027. [DOI] [PubMed] [Google Scholar]
- 2.Campagnola PJ, Loew LM. Second-Harmonic Imaging Microscopy for Visualizing Biomolecular Arrays in Cells, Tissues and Organisms. Nat. Biotechnol. 2003;21:1356–1360. doi: 10.1038/nbt894. [DOI] [PubMed] [Google Scholar]
- 3.Li B, Claytor KE, Yuan H, Vo-Dinh T, Warren WS, Fischer MC. Multicontrast Nonlinear Optical Microscopy with a Compact and Rapid Pulse Shaper. Opt. Lett. 2012;37:2763–2765. doi: 10.1364/OL.37.002763. [DOI] [PubMed] [Google Scholar]
- 4.Wong CY, Cotts BL, Wu H, Ginsberg NS. Exciton Dynamics Reveal Aggregates with Intermolecular Order at Hidden Interfaces in Solution-Cast Organic Semiconducting Films. Nat. Commun. 2015;6:5946. doi: 10.1038/ncomms6946. [DOI] [PubMed] [Google Scholar]
- 5.Liu N, Kumbham M, Pita I, Guo Y, Bianchini P, Diaspro A, Tofail SAM, Peremans A, Silien C. Far-Field Subdiffraction Imaging of Semiconductors Using Nonlinear Transient Absorption Differential Microscopy. ACS Photonics. 2016;3:478–485. [Google Scholar]
- 6.Ogilvie JP, Beaurepaire E, Alexandrou A, Joffre M. Fourier-Transform Coherent Anti-Stokes Raman Scattering Microscopy. Opt. Lett. 2006;31:480–482. doi: 10.1364/ol.31.000480. [DOI] [PubMed] [Google Scholar]
- 7.Volkmer A, Cheng JX, Xie XS. Vibrational Imaging with High Sensitivity via Epidetected Coherent Anti-Stokes Raman Scattering Microscopy. Phys. Rev. Lett. 2001;87:2–5. [Google Scholar]
- 8.Silva WR, Graefe CT, Frontiera RR. Toward Label-Free Super-Resolution Microscopy. ACS Photonics. 2016;3:79–86. [Google Scholar]
- 9.Ginsberg NS, Cheng YC, Fleming GR. Two-Dimensional Electronic Spectroscopy of Molecular Aggregates. Acc. Chem. Res. 2009;42:1352–1363. doi: 10.1021/ar9001075. [DOI] [PubMed] [Google Scholar]
- 10.Fuller FD, Ogilvie JP. Experimental Implementations of Two-Dimensional Fourier Transform Electronic Spectroscopy. Annu. Rev. Phys. Chem. 2015;66:667–690. doi: 10.1146/annurev-physchem-040513-103623. [DOI] [PubMed] [Google Scholar]
- 11.Reddy RK, Walsh MJ, Schulmerich MV, Carney PS, Bhargava R. High-Definition Infrared Spectroscopic Imaging. Appl. Spectrosc. 2013;67:93–105. doi: 10.1366/11-06568. [DOI] [PMC free article] [PubMed] [Google Scholar]
- 12.Nasse MJ, Walsh MJ, Mattson EC, Reininger R, Kajdacsy-Balla A, Macias V, Bhargava R, Hirschmugl CJ. High-Resolution Fourier-Transform Infrared Chemical Imaging with Multiple Synchrotron Beams. Nat. Methods. 2011;8:413–416. doi: 10.1038/nmeth.1585. [DOI] [PMC free article] [PubMed] [Google Scholar]
- 13.Jones KC, Peng CS, Tokmakoff A. Folding of a Heterogeneous β-Hairpin Peptide from Temperature-Jump 2D IR Spectroscopy. Proc. Natl. Acad. Sci. U. S. A. 2013;110:2828–2833. doi: 10.1073/pnas.1211968110. [DOI] [PMC free article] [PubMed] [Google Scholar]
- 14.Buchanan LE, Dunkelberger EB, Tran HQ, Cheng P-N, Chiu C-C, Cao P, Raleigh DP, de Pablo JJ, Nowick JS, Zanni MT. Mechanism of IAPP Amyloid Fibril Formation Involves an Intermediate with a Transient -Sheet. Proc. Natl. Acad. Sci. U. S. A. 2013;110:19285–19290. doi: 10.1073/pnas.1314481110. [DOI] [PMC free article] [PubMed] [Google Scholar]
- 15.Moran SD, Woys AM, Buchanan LE, Bixby E, Decatur SM, Zanni MT. Two-Dimensional IR Spectroscopy and Segmental 13C Labeling Reveals the Domain Structure of Human γD-Crystallin Amyloid Fibrils. Proc. Natl. Acad. Sci. U. S. A. 2012;109:3329–3334. doi: 10.1073/pnas.1117704109. [DOI] [PMC free article] [PubMed] [Google Scholar]
- 16.Asbury JB, Steinel T, Stromberg C, Gaffney KJ, Piletic IR, Goun A, Fayer MD. Hydrogen Bond Dynamics Probed with Ultrafast Infrared Heterodyne-Detected Multidimensional Vibrational Stimulated Echoes. Phys. Rev. Lett. 2003;91:237402. doi: 10.1103/PhysRevLett.91.237402. [DOI] [PubMed] [Google Scholar]
- 17.Roberts ST, Mandal A, Tokmakoff A. Local and Collective Reaction Coordinates in the Transport of the Aqueous Hydroxide Ion. J. Phys. Chem. B. 2014;118:8062–8069. doi: 10.1021/jp501145p. [DOI] [PubMed] [Google Scholar]
- 18.Stirnemann G, Laage D. Direct Evidence of Angular Jumps During Water Reorientation Through Two-Dimensional Infrared Anisotropy. J. Phys. Chem. Lett. 2010;1:1511–1516. [Google Scholar]
- 19.Bakulin AA, Liang C, Jansen TLC, Wiersma DA, Bakker HJ, Pshenichnikov MS. Hydrophobic Solvation: A 2D IR Spectroscopic Inquest. Acc. Chem. Res. 2009;42:1229–1238. doi: 10.1021/ar9000247. [DOI] [PubMed] [Google Scholar]
- 20.Kiefer LM, Kubarych KJ. Solvent-Dependent Dynamics of a Series of Rhenium Photoactivated Catalysts Measured with Ultrafast 2DIR. J. Phys. Chem. A. 2015;119:959–965. doi: 10.1021/jp511686p. [DOI] [PubMed] [Google Scholar]
- 21.Bredenbeck J, Helbing J, Hamm P. Labeling Vibrations by Light: Ultrafast Transient 2D-IR Spectroscopy Tracks Vibrational Modes during Photoinduced Charge Transfer. J. Am. Chem. Soc. 2004;126:990–991. doi: 10.1021/ja0380190. [DOI] [PubMed] [Google Scholar]
- 22.Jones BH, Huber CJ, Spector IC, Tabet AM, Butler RL, Hang Y, Massari AM. Correlating Solvent Dynamics and Chemical Reaction Rates Using Binary Solvent Mixtures and Two-Dimensional Infrared Spectroscopy. J. Chem. Phys. 2015;142:212441. doi: 10.1063/1.4920953. [DOI] [PubMed] [Google Scholar]
- 23.Ghosh A, Hochstrasser RM. A Peptide’s Perspective of Water Dynamics. Chem. Phys. 2011;390:1–13. doi: 10.1016/j.chemphys.2011.07.018. [DOI] [PMC free article] [PubMed] [Google Scholar]
- 24.Lin Z, Rubtsov IV. Constant-Speed Vibrational Signaling along Polyethyleneglycol Chain up to 60-A Distance. Proc. Natl. Acad. Sci. U. S. A. 2012;109:1413–1418. doi: 10.1073/pnas.1116289109. [DOI] [PMC free article] [PubMed] [Google Scholar]
- 25.Anna JM, Kubarych KJ. Watching Solvent Friction Impede Ultrafast Barrier Crossings: A Direct Test of Kramers Theory. J. Chem. Phys. 2010;133:174506. doi: 10.1063/1.3492724. [DOI] [PubMed] [Google Scholar]
- 26.Zanni MT, Ge N-H, Kim YS, Hochstrasser RM. Two-Dimensional IR Spectroscopy Can Be Designed to Eliminate the Diagonal Peaks and Expose Only the Crosspeaks Needed for Structure Determination. Proc. Natl. Acad. Sci. U. S. A. 2001;98:11265–11270. doi: 10.1073/pnas.201412998. [DOI] [PMC free article] [PubMed] [Google Scholar]
- 27.Fournier F, Guo R, Gardner EM, Donaldson PM, Loeffeld C, Gould IR, Willison KR, Klug DR. Biological and Biomedical Applications of Two-Dimensional Vibrational Spectroscopy: Proteomics, Imaging, and Structural Analysis. Acc. Chem. Res. 2009;42:1322–1331. doi: 10.1021/ar900074p. [DOI] [PubMed] [Google Scholar]
- 28.Baiz CR, Schach D, Tokmakoff A. Ultrafast 2D IR Microscopy. Opt. Express. 2014;22:18724–18735. doi: 10.1364/OE.22.018724. [DOI] [PMC free article] [PubMed] [Google Scholar]
- 29.Yew EYS, Sheppard CJR, So PTC. Temporally Focused Wide-Field Two-Photon Microscopy: Paraxial to Vectorial. Opt. Express. 2013;21:12951–12963. doi: 10.1364/OE.21.012951. [DOI] [PMC free article] [PubMed] [Google Scholar]
- 30.Toytman I, Simanovskii D, Palanker D. On Illumination Schemes for Wide-Field CARS Microscopy. Opt. Express. 2009;17:7339–7347. doi: 10.1364/oe.17.007339. [DOI] [PubMed] [Google Scholar]
- 31.Hamm P, Zanni MT. Concepts and Methods of 2D Infrared Spectroscopy. 1st. Cambridge University Press; 2011. [Google Scholar]
- 32.Tekavec PF, Lott GA, Marcus AH. Fluorescence-Detected Two-Dimensional Electronic Coherence Spectroscopy by Acousto-Optic Phase Modulation. J. Chem. Phys. 2007;127:214307. doi: 10.1063/1.2800560. [DOI] [PubMed] [Google Scholar]
- 33.Karki KJ, Widom JR, Seibt J, Moody I, Lonergan MC, Pullerits T, Marcus AH. Coherent Two-Dimensional Photocurrent Spectroscopy in a PbS Quantum Dot Photocell. Nat. Commun. 2014;5:1–7. doi: 10.1038/ncomms6869. [DOI] [PubMed] [Google Scholar]
- 34.Middleton CT, Woys AM, Mukherjee SS, Zanni MT. Residue-Specific Structural Kinetics of Proteins through the Union of Isotope Labeling, Mid-IR Pulse Shaping, and Coherent 2D IR Spectroscopy. Methods. 2010;52:12–22. doi: 10.1016/j.ymeth.2010.05.002. [DOI] [PMC free article] [PubMed] [Google Scholar]
- 35.Serrano AL, Ghosh A, Ostrander JS, Zanni MT. Wide-Field FTIR Microscopy Using Mid-IR Pulse Shaping. Opt. Express. 2015;23:17815–17827. doi: 10.1364/OE.23.017815. [DOI] [PMC free article] [PubMed] [Google Scholar]
- 36.Skoff DR, Laaser JE, Mukherjee SS, Middleton CT, Zanni MT. Simplified and Economical 2D IR Spectrometer Design Using a Dual Acousto-Optic Modulator. Chem. Phys. 2013;422:8–15. doi: 10.1016/j.chemphys.2012.08.019. [DOI] [PMC free article] [PubMed] [Google Scholar]
- 37.Hamm P, Lim M, DeGrado WF, Hochstrasser RM. The Two-Dimensional IR Nonlinear Spectroscopy of a Cyclic Penta-Peptide in Relation to Its Three-Dimensional Structure. Proc. Natl. Acad. Sci. U. S. A. 1999;96:2036–2041. doi: 10.1073/pnas.96.5.2036. [DOI] [PMC free article] [PubMed] [Google Scholar]
- 38.De AK, Monahan D, Dawlaty JM, Fleming GR. Two-Dimensional Fluorescence-Detected Coherent Spectroscopy with Absolute Phasing by Confocal Imaging of a Dynamic Grating and 27-Step Phase-Cycling. J. Chem. Phys. 2014;140:1–9. doi: 10.1063/1.4874697. [DOI] [PubMed] [Google Scholar]
- 39.Tian P, Keusters D, Suzaki Y, Warren WS. Femtosecond Phase-Coherent Two-Dimensional Spectroscopy. Science. 2003;300:1553–1555. doi: 10.1126/science.1083433. [DOI] [PubMed] [Google Scholar]
- 40.Afiz MR, Clark RJH, D’Urso NR. Vapour-Phase Raman Spectra of Chromium, Molybdenum, and Tungsten Hexacarbonyls. J. Chem. Soc., Dalton Trans. 1972;33:1258–1263. [Google Scholar]
- 41.Dixon L, Cheong FC, Grier DG. Holographic Deconvolution Microscopy for High-Resolution Particle Tracking. Opt. Express. 2011;19:16410. doi: 10.1364/OE.19.016410. [DOI] [PubMed] [Google Scholar]
- 42.Martin MC, Dabat-Blondeau C, Unger M, Sedlmair J, Parkinson DY, Bechtel HA, Illman B, Castro JM, Keiluweit M, Buschke D, Ogle B, Nasse MJ, Hirschmugl CJ. 3D Spectral Imaging with Synchrotron Fourier Transform Infrared Spectro-Microtomography. Nat. Methods. 2013;10:861–864. doi: 10.1038/nmeth.2596. [DOI] [PubMed] [Google Scholar]
- 43.Gull SF, Skilling J. Maximum Entropy Method in Image Processing. IEE Proc., Part F; Communications, Radar and Signal Processing. 1984;131:646. [Google Scholar]
- 44.Kole MR, Reddy RK, Schulmerich MV, Gelber MK, Bhargava R. Discrete Frequency Infrared Microspectroscopy and Imaging with a Tunable Quantum Cascade Laser. Anal. Chem. 2012;84:10366–10372. doi: 10.1021/ac302513f. [DOI] [PMC free article] [PubMed] [Google Scholar]
- 45.Woys AM, Lin YS, Reddy AS, Xiong W, De Pablo JJ, Skinner JL, Zanni MT. 2D IR Line Shapes Probe Ovispirin Peptide Conformation and Depth in Lipid Bilayers. J. Am. Chem. Soc. 2010;132:2832–2838. doi: 10.1021/ja9101776. [DOI] [PubMed] [Google Scholar]
- 46.Middleton CT, Buchanan LE, Dunkelberger EB, Zanni MT. Utilizing Lifetimes to Suppress Random Coil Features in 2D IR Spectra of Peptides. J. Phys. Chem. Lett. 2011;2:2357–2361. doi: 10.1021/jz201024m. [DOI] [PMC free article] [PubMed] [Google Scholar]
- 47.Manor J, Mukherjee P, Lin Y-S, Leonov H, Skinner JL, Zanni MT, Arkin IT. Gating Mechanism of the Influenza A M2 Channel Revealed by 1D and 2D IR Spectroscopies. Structure. 2009;17:247–254. doi: 10.1016/j.str.2008.12.015. [DOI] [PMC free article] [PubMed] [Google Scholar]
- 48.Stelzer EHK. Contrast, Resolution, Pixelation, Dynamic Range and Signal-to-Noise Ratio: Fundamental Limits to Resolution in Fluorescence Light Microscopy. J. Microsc. 1998;189:15–24. [Google Scholar]
- 49.Grechko M, Zanni MT. Quantification of Transition Dipole Strengths Using 1D and 2D Spectroscopy for the Identification of Molecular Structures via Exciton Delocalization: Application to α-Helices. J. Chem. Phys. 2012;137:184202. doi: 10.1063/1.4764861. [DOI] [PMC free article] [PubMed] [Google Scholar]
- 50.Dunbar JA, Osborne DG, Anna JM, Kubarych KJ. Accelerated 2D-IR Using Compressed Sensing. J. Phys. Chem. Lett. 2013;4:2489–2492. [Google Scholar]
- 51.Spencer AP, Spokoyny B, Ray S, Sarvari F, Harel E. Mapping Multidimensional Electronic Structure and Ultrafast Dynamics with Single-Element Detection and Compressive Sensing. Nat. Commun. 2016;7:10434. doi: 10.1038/ncomms10434. [DOI] [PMC free article] [PubMed] [Google Scholar]
- 52.Baiz CR, Nee MJ, McCanne R, Kubarych KJ. Ultrafast Nonequilibrium Fourier-Transform Two-Dimensional Infrared Spectroscopy. Opt. Lett. 2008;33:2533–2535. doi: 10.1364/ol.33.002533. [DOI] [PubMed] [Google Scholar]
- 53.Ghosh A, Serrano AL, Oudenhoven TA, Ostrander JS, Eklund EC, Blair AF, Zanni MT. Experimental Implementations of 2D IR Spectroscopy through a Horizontal Pulse Shaper Design and a Focal Plane Array Detector. Opt. Lett. 2016;41:524–527. doi: 10.1364/OL.41.000524. [DOI] [PMC free article] [PubMed] [Google Scholar]
Associated Data
This section collects any data citations, data availability statements, or supplementary materials included in this article.


