

Abstract
Background
The p53 antisense oligonucleotide cenersen has been shown to sensitize acute myeloid leukemia (AML) stem cells to DNA damaging agents.
Methods
To determine if cenersen merits testing in larger efficacy studies, an exploratory study of cenersen in combination with idarubicin either alone or with one of two doses of cytarabine was performed in first salvage AML patients. Patients who either had failed to respond to a single induction course or had responded to induction but relapsed within 12 months were enrolled. Stopping rules based on an expected 14% complete response (CR) rate were applied to each treatment arm.
Results
Fifty-three patients were treated and none of the arms was terminated for lack of activity. Nearly all patients received a single course unless they responded. Ten of the 53 (19%) patients responded (8 CR and 2 CR with incomplete platelet recovery [CRp]). There was a positive trend for a better response rate with increasing intensity of chemotherapy in the patients refractory to frontline treatment compared to those who had previously relapsed. One-third (17/53) of the patients received cenersen inhibitors (acetaminophen and/or high dose antioxidants) during treatment and none of these responded to treatment. No unique toxicity was attributed to cenersen.
Conclusion
These results suggest that the combination of cenersen with chemotherapy may have clinical efficacy and additional studies are warranted to explore its full potential.
Keywords: acute myeloid leukemia, refractory, relapsed, p53, antisense, cenersen
Introduction
The normal function of p53 includes protection from the effects of DNA damage and/or proto-oncogene activation by directing defective cells to undergo either p53-dependent programmed cell death (both stimuli) or p53-dependent cell cycle arrest and repair (DNA damage only).1 Consequently, if a pre-malignant cell is to progress to a full malignant phenotype, it must inhibit p53-dependent programmed cell death.2–5 In contrast, p53-dependent cell cycle arrest and repair function appear to be frequently retained in cancer cells with wild-type p53.1,6,7 When p53 mutates, this protective function is lost but can be compensated for by gain-of-function mutant p53.8–11
Cenersen is an antisense oligonucleotide (oligo) that blocks the production of both wild-type and mutant p53 to produce anti-cancer effects.12–14 It has a ribonuclease H (RNase H)-dependent mechanism of action which causes the p53 mRNA to be cleaved at the site to which cenersen binds.14 In acute myeloid leukemia (AML), cenersen has preferential activity against the malignant stem cells and some of the more mature progenitor cells probably because they express high levels of RNase H.15–17 Cenersen sensitizes these AML cells, at least when they are in cycle, to atmospheric oxygen and to low levels of many different DNA-damaging agents including chemotherapeutic agents used at doses that have minimal or no effect on leukemic cells in the absence of cenersen15.
In this study, we focused on patients who were either refractory to a single intensive frontline course of induction chemotherapy or who had relapsed less than 12 months following frontline treatment. Historical data shows that the expected complete response (CR) rate for each of these groups is 14% when treated with “high-dose” (1g/m2) cytarabine-containing regimens18. The primary objective was to determine the efficacy of cenersen in combination with idarubicin and either no cyctarabine or one of two different doses (100mg/m2 or 1g/m2) of cytarabine.
Patients, materials and methods
Cenersen
Cenersen is the United States adopted name (USAN) and international nonproprietary name (INN) generic name of a 20-mer phosphorothioate oligo that is complementary to a portion of the coding sequence in the p53 mRNA. The specific nucleotide sequence is: 5′-d[P-Thio](CCCTG CTCCC CCCTG GCTCC)- 3′.
Study design
This was an open-label, phase 2a, randomized three-arm study involving treatments of increasing chemotherapy intensity in combination with cenersen in first salvage AML patients ≥18 years old. The trial was conducted using a “selection design” that uses Bayesian principles to provide good frequentist properties in order to establish a probability of selecting the truly active therapy regimens among those tested by rejecting any truly ineffective regimen. To be eligible, patients were required to be refractory to one induction chemotherapy course or to have obtained a CR lasting <12 months and to have received no other salvage therapy. Other eligibility criteria included performance status of 0–2 and adequate organ function. The study was approved by the Institutional Review Board (IRB) of participating institutions, and all patients signed an IRB approved informed consent.
The primary end point was CR rate. Historical data (M.D. Anderson Cancer Center, 1991 through 2001) indicate that the probability of CR for the subset of first salvage patients meeting the entry criteria for this study is 14%. The most intensive (Group 3) chemotherapy given in the current study is equivalent to the cytarabine regimens given to nearly 70% of the patients used to generate the historical control.
Treatment Plan
The treatment plan is summarized in Table 1. Patients received therapy with cenersen by continuous intravenous infusion (CIV) daily for four consecutive days. On the second day of cenersen administration, patients started a 3-day course of idarubicin 12 mg/m2/day while continuing therapy with cenersen. In addition, patients were randomized to receive no cytarabine, a daily dose of cytarabine of 100mg/m2 CIV for 7 consecutive days, or 1g/m2 daily CIV for 4 consecutive days (3 days for patients ≥60 years of age). These schedules were selected to investigate the optimal schedule of cytarabine to be used in combination with cenersen and idarubicin in subsequent studies.
Table 1.
Summary of Treatment Groups
| Group | Cenersen | Idarubicin | Ara-C |
|---|---|---|---|
| 1 | 2.4mg/kg days 1–4 | 12mg/m2 days 2–4 | none |
| 2 | 2.4mg/kg days 1–4 | 12mg/m2 days 2–4 | 100mg/m2 days 2–8 |
| 3 | 2.4mg/kg days 1–4 | 12mg/m2 days 2–4 | 1g/m2 days 2–5 or 1g/m2 days 2–4 if ≥60 yrs old |
Patients not achieving remission after one course were scheduled to receive a second course of induction chemotherapy with the same schedule as the first course. Patients who achieved a response after one or two courses were eligible to receive additional courses of the same regimen up to a total of 6 at a frequency determined by the treating physician. Patients received supportive care, antimicrobials and other medications as required. Concomitant administration of acetaminophen and high-dose antioxidants was prohibited by the protocol from one day prior to the start of cenersen infusion through the end of day 6 of treatment for a total of 7 days.
Patients had a physical examination, complete blood count, blood chemistry and a bone marrow aspiration and cytogenetic analysis before the start of therapy. During and after chemotherapy patients were followed with complete blood count and blood chemistry at least once weekly, and a bone marrow aspiration was scheduled on day 28 and then as clinically indicated to assess response. Cytogenetic abnormalities were classified according to the Medical Research Council criteria19 as those conferring favorable prognosis, including t(8:21)(q22;q22) and inv(16); intermediate risk, including diploid, +21, +22, +4 and +8; and adverse risk, including all others and complex karyotype was defined as ≥3 abnormalities. Response to therapy was assessed using the definitions proposed by the International Working Group20.
Statistical analysis
Following the initial sequential entry of three patients per dose group (Table 1), the remaining patients were randomly assigned to each of the 3 treatment groups. The outcome of interest was CR. Historical data from the MD Anderson Cancer Center indicated that the probability of CR among patients who failed a single induction course or whose first CR lasted <12 months is 14% (52/372). Denoting the probability of CR by θCR/H, we assumed that θCR/H follows a (0.3, 1.7) beta distribution; this distribution has a mean of 0.15. We assumed that each of the experimental treatment probabilities θCR/E1, θCR/E2, and θCR/E3 follow the same distribution, i.e., beta (0.3, 1.7). The early stopping rules were to terminate treatment within each experimental arm if, compared to the historical experience, that arm’s CR rate is unlikely to increase by a mean of 0.15. This rule was applied in each experimental arm after each cohort of five patients, up to a maximum of 15 per arm, was evaluated. The stopping bounds generated by these rules were designed to terminate accrual to an arm if the CR rate was ≤0/5, 1/10, 2/15, 3/20, 3/25, 4/30, 5/35, or 5/40. The sample sizes above 15 (3/20 etc.) refer to the possibility that at least one arm would be terminated early, with accrual continuing beyond 15 on the remaining arm(s).
All patients receiving at least one dose of cenersen constituted the intent-to-treat (ITT) population.
Ad hoc analyses and definition of per protocol subpopulation
Preclinical data suggested that use of acetaminophen or antioxidants could adversely affect the potential benefit of cenersen therapy. Although use of these agents was not allowed by the protocol during treatment, 32% (17/53) of the patients in the present study received acetaminophen (11), high-dose antioxidants (3) or both (3) during times proscribed by the protocol. In addition to the 17 patients who received prohibited substances, 4 patients failed to meet the protocol entry criteria. The reasons are as follows: two patients had multiple prior treatment failures; one patient had myelofibrosis at study entry, screening bone marrow (BM) <5% blasts, and disease that could not be monitored by BM analysis; and one patient received chemotherapy (hydroxyurea) during study days -2 and -1. Hydroxyurea can cause p53 to undergo post-translational modifications that dramatically increase its half-life. Accordingly, a per protocol population was defined for subset analysis that excluded the patients just described.
An ad hoc analysis was undertaken to determine the effect, if any, of the use of acetaminophen and/or high dose antioxidants on the ability of a cenersen containing regimen (cenersen regimen) to induce a response (CR or complete response with incomplete platelet recovery [CRp]). In order to achieve this, 11 patients of the 53 treated who were inappropriate to this particular analysis were censored (4 did not meet entry criteria and 7 could not be analyzed for response: 5 of these because of early death and 2 because of uninterpretable BM results). Of the remaining 42 patients, 14 received substances prohibited by the protocol (8 acetaminophen, 3 high-dose antioxidants, and 3 both) during proscribed times and 28 did not. Thus, 3 of the 17 patients who received prohibited substances could not be evaluated for response and were, therefore, not used in this analysis.
Results
Patient characteristics
The patient characteristics for the overall ITT population for each of the treatment groups are shown in Table 2. The ITT and per protocol populations had an identical median age of 58 years (range, 19 to 88 years). There were no significant differences among the treatment groups 1, 2 or 3 with respect to gender, age, race or cytogenetics. Nineteen of the ITT patients (36%) were previously unresponsive to a single frontline induction course and 34 (64%) had relapsed from frontline therapy in <12 months. Cytogenetic analysis was available for 49 patients and of these 57% had intermediate-, 35% adverse- and 8% favorable-risk cytogenetic abnormalities.
Table 2.
Patient Characteristics at Study Entry
| a. ITT Population | ||||||||
|---|---|---|---|---|---|---|---|---|
| Patient Cohort | Age | Response to Frontline Rx (number) |
Cytogenetics (number) |
Performance Status | WBC ×109/L |
Platelets ×109/L |
Peripheral Blood Blasts % |
BM Blasts % |
| Overall | 58 (19 – 88) | Refractory 19 Relapsed 34 |
Favorable: 4 Intermediate: 28 Adverse: 17 |
1 (0 – 3) | 3.3 (.3 – 279.6) | 43 (5 – 659) | 14.5 (0 – 97) | 38 (4 – 100) |
| Group 1 | 63 (19 – 88) | Refractory 5 Relapsed 8 |
Favorable: 1 Intermediate: 8 Adverse: 3 |
1 (0 – 2) | 3.01 (1 – 279.6) | 45 (11 – 659) | 14 (0 – 87) | 26 (12 – 92) |
| Group 2 | 58 (25 – 81) | Refractory 6 Relapsed 15 |
Favorable: 1 Intermediate: 10 Adverse: 8 |
1 (0 – 2) | 3.6 (.3 – 84.7) | 27 (5 – 642) | 13 (0 – 92) | 45 (4 – 100) |
| Group 3 | 52 (25 – 76) | Refractory 8 Relapsed 11 |
Favorable: 2 Intermediate: 10 Adverse: 6 |
0 (0 – 3) | 2.9 (1.1 – 66.6) | 43 (8 – 361) | 23 (0 – 97) | 36 (8 – 89) |
Data is reported as Median, Min., Max., unless otherwise specified.
Cytogenetics – 4 patients have no available Cytogenetics data, Group 1 (n=1), Group 2 (n=2), Group 3 (n=1)
BM, bone marrow; WBC, white blood cell count
Response to treatment
Considering the ITT population, there were 13 patients in arm 1, 21 in arm 2, and 19 in arm 3. None of the three treatment groups triggered the prospectively defined stopping rules that were established to eliminate treatments that did not at least match the historical control of a 14% CR rate. The ITT response rates by treatment group are shown in Table 3. There appeared to be a trend towards better results with increasing intensity of chemotherapy culminating in a 21% (4/19) CR rate in Group 3. Combining all three treatment groups 10 patients responded to therapy (CR rate 15% – 8/53 and CR + CRp rate 19% – 10/53). The prior therapy received by patients with response to cenersen based therapy is presented in Table 4.
Table 3.
Remission Rates by Treatment Group (ITT)
| No. (%) | |||||||
|---|---|---|---|---|---|---|---|
| Overall (n=53) | Group 1 (n=13) | Group 2 (n=21) | Group 3 (n=19) | ||||
| CR | CR+CRp | CR | CR+CRp | CR | CR+CRp | CR | CR+CRp |
| 8(15) | 10(19) | 1 (8) | 2 (15) | 3 (14) | 4 (19) | 4 (21) | 4 (21) |
CR indicates complete response
CRp indicates complete response with incomplete platelet recovery
Table 4.
Prior Treatments Given to Responders (CR + CRp) in the Current Study
| Frontline Treatment | Response to Frontline Treatment | Cenersen Treatment Group | Response to Cenersen Regimen |
|---|---|---|---|
| Daunorubicin, 60 mg/m2/d, days 1–3 Cytarabine, 200 mg/m2/d, days 1–7 PKC 412, 200 mg/d, days 8–31 |
Refractory | 1 | CRp |
| Daunorubicin, 60 mg/m2/d, days 1–3 Cytarabine, 200 mg/m2/d, days 1–7 PKC 412, 200 mg/d, days 1–31 |
Refractory | 1 | CR |
| Idarubicin, 12 mg/m2/d, days 1–3 Cytarabine, 1.5 g/m2/d, days 1–4 Then as consolidation: Cytarabine, 100 mg/m2/d × 5 days Idarubicin, 8 mg/m2/d + Cytarabine, 1.5 g/m2/d × 2 days Cytarabine, 100 mg/m2/d × 5 days |
Relapse | 2 | CR |
| Daunorubicin (20mg/m2/d × 4d) ×2 Cytarabine (200mg/m2/d × 4d) ×2 Etoposide (100mg/m2/d ×4d) ×2 Thioguanine (100mg/m2/d ×4d) ×2 Dexamethasone (6mg/m2/d ×4d) ×2 Cytarabine intrathecal (70mg) ×2 |
Relapse | 2 | CRp |
| Idarubicin, 12 mg/m2/d, days 4–6 Cytarabine, 1.5 g/m2/d, days 4–7 |
Refractory | 3 | CR |
| Daunorubicin, 45 mg/m2/d, days 1–3 Cytarabine, 100 mg/m2/d, days 1–8 Zosuquidar, 700 mg/d, days 1–3 |
Refractory | 3 | CR |
| Daunorubicin* × 3 days Cytarabine* × 7days |
Refractory | 3 | CR |
| Idarubicin, 12 mg/m2/d × 3 days Cytarabine, 100 mg/m2/d, × 7 days |
Refractory | 2 | CR |
| Daunorubicin, 90 mg/m2/d, days 1–3 Cytarabine, 100 mg/m2/d, days 1–7 Etoposide, 100 mg/m2/d, days 1–3 Then as consolidation: HIDAC × 3 courses |
Relapsed | 2 | CR |
| Idarubicin* Cytarabine* Etoposide* Then as consolidation: HIDAC* |
Relapsed | 3 | CR |
Dose unknown
HIDAC = high dose Ara-C
CR indicates complete response
CRp indicates complete response with incomplete platelet recovery
Table 5 shows the response rates by treatment group for the per protocol population. The response rates of each corresponding group appear to be better than those seen in the ITT analysis (Table 3). The number of responders either within or between groups, however, is too small to meaningfully test differences by cytarabine intensity. The best outcome was seen in Group 3 in which the per protocol CR rate was 36% while there was 1 CR (13%) and 1 CRp in the 8 evaluable patients in Group 1 (25%) and 3 CR (23%) and 1 CRp in the 13 evaluable patients in Group 2 (31%).
Table 5.
Remission Rates by Treatment Group (Per Protocol)
| No. (%) | |||||||
|---|---|---|---|---|---|---|---|
| Overall (n=32) | Group 1 (N=8) | Group 2 (n=13) | Group 3 (n=11) | ||||
| CR | CR+CRp | CR | CR+CRp | CR | CR+CRp | CR | CR+CRp |
| 8(25) | 10(31) | 1 (13) | 2 (25) | 3 (23) | 4 (31) | 4 (36) | 4 (36) |
CR indicates complete response
CRp indicates complete response with incomplete platelet recovery
The results of the ad hoc analysis to determine what effect the use of acetaminophen and/or high dose antioxidants had, if any, on response to a cenersen regimen is shown in Table 6. All 10 responders in this study were found to be in the group of 28 evaluable patients who did not receive these substances during treatment while none of the 14 patients who received these substances during treatment responded (p=0.0174; 95% confidence interval, 7.5% to 62.6%).
Table 6.
Lack of Use of Cenersen Inhibitors is Associated with Obtaining a Response in Patients with an Evaluable BM and Meeting Entry Criteria
| Administration of Prohibited Substances (number of patients) |
Responses | ||
|---|---|---|---|
| CR + CRp | NR | P-value | |
| Yes (14) | 0 | 14 | 0.0174 |
| No (28) | 10 | 18 | |
CR indicates complete response
CRp indicates complete response with incomplete platelet recovery
NR indicates no response
The ratio of patients in this study who were non-responsive to a single induction course vs. those relapsing in <12 months after induction treatment was in the expected range. A disproportionate number of the group refractory to frontline treatment (60%) responded to therapy with cenersen (Table 7). This trend is seen in both the ITT (CR 26% vs. 9%; CR + CRp 32% vs. 12%) and the per protocol populations (CR 38% vs. 16%; CR + CRp 46% vs. 21%). Two of the responses to cenersen-based therapy among the patients unresponsive to frontline induction therapy occurred in Group 1, one occurred in Group 2 and three in Group 3 (Table 4).
Table 7.
Cenersen Regimen Remission Rates by Response to Frontline Treatment
| Response to Frontline Treatment | No. with Response/No. Evaluable (%) by Analysis Population | |||
|---|---|---|---|---|
| Intent-to-Treat | Per Protocol | |||
| CR | CR + CRp | CR | CR + CRp | |
| Refractory | 5/19 (26) | 6/19 (32) | 5/13 (38) | 6/13 (46) |
| Relapsed | 3/34 (9) | 4/34 (12) | 3/19 (16) | 4/19 (21) |
CR indicates complete response
CRp indicates complete response with incomplete platelet recovery
Duration of remissions and survival
After a median follow-up of 18.5 months from start of therapy, 2 patients remain alive and in CR. Median duration of response for all 10 responding patients was 7.9 months (range, 2 to 24). Patients received a median of 1 course of therapy with 12 patients receiving two or more courses of therapy (7 of these were responders). After achieving remission, 7 patients underwent a stem cell transplant. The median duration of the response to a cenersen regimen for non-transplanted patients (n=3) was 11.2 vs. 6.6 months for those who were transplanted (n=7).
The median survival for the total patient population was 5.3 months (range, 0.3 to 26.8) and 6.3 months (range 0.3 to 26.8) for the per protocol population (Figure 1). Survival estimates for the three treatment groups are shown in Figure 2. Seven patients (13%) died during induction (i.e., during the 30 days immediately following the start of chemotherapy), with the cause of death reported as respiratory failure (n=3), cardiopulmonary arrest (n=2), sepsis (n=1) and intracranial hemorrhage (n=1).
Figure 1.
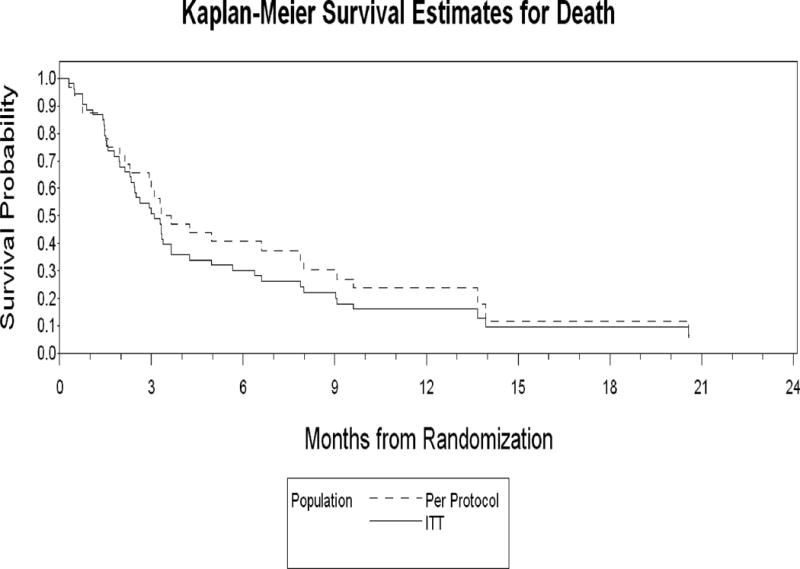
Comparison of the Kaplan-Meier survival estimates for the ITT and Per Protocol Populations
Figure 2.
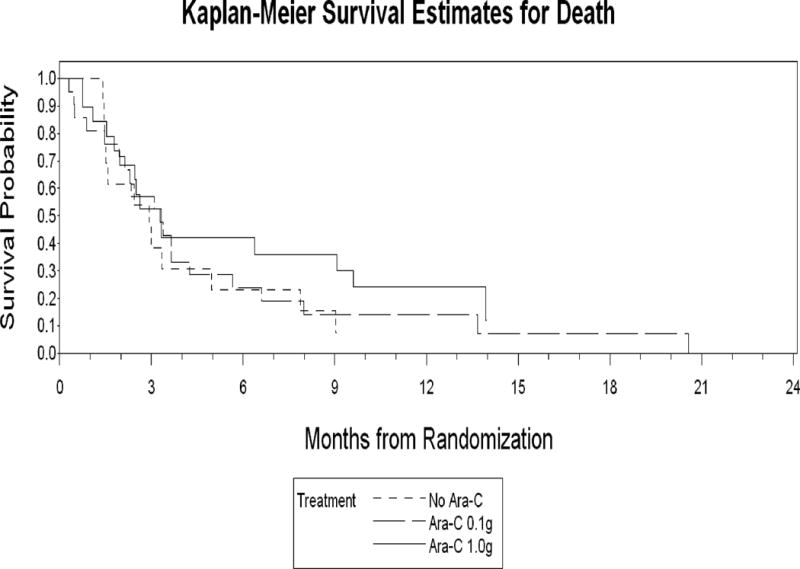
Comparison of the Kaplan-Meier survival estimates for all three treatment arms
Six of the 10 responding patients had been refractory to their front line treatment. Of these the average duration of response following a cenersen regimen was 7.6 months (range 2.3 – 24.5 months). The average response duration for the patients responding to frontline treatment was 9.7 months (range 5.9 – 12.2 months) compared to 8.4 months (range 5.4 – 11.6 months) following treatment with a cenersen regimen. The two relapsed patients who had a shorter response duration following a cenersen regimen (220 and 163 days) compared to that following frontline treatment (366 and 343 days) died shortly following transplant.
Safety results
The frequency of adverse events in this trial appears to be similar across the treatment groups with the exception of diarrhea, constipation, abdominal pain, febrile neutropenia, rash, headache, dizziness and vomiting, which showed a dose response relationship with increasing cytarabine doses.
The most common treatment-emergent adverse events, regardless of causality, are presented in Table 8. A total of 13 patients (35%) died during study (i.e., within 30 days of the last dose of cenersen). The causes of death included respiratory failure/arrest (n=3); cardiopulmonary arrest (n=3); progressive disease (n=2); septic shock, multi-organ failure, sepsis, intracranial hemorrhage, and unknown cause (n=1) each.
Table 8.
Most Common Treatment-Emergent Adverse Events
| Cenersen ELP1001 data (N=53) | |
|---|---|
| Adverse Experiences ≥ 20% | |
| Preferred Term | % of Subjects |
| Nausea | 68 |
| Diarrhea | 66 |
| Hypokalemia | 66 |
| Febrile neutropenia | 60 |
| Fatigue | 53 |
| Hypomagnesaemia | 49 |
| Constipation | 42 |
| Cough | 42 |
| Rash | 40 |
| Pyrexia | 38 |
| Dyspnoea | 36 |
| Chills | 34 |
| Headache | 34 |
| Abdominal pain | 32 |
| Vomiting | 32 |
| Edema peripheral | 28 |
| Hypocalcaemia | 25 |
| Insomnia | 25 |
| Anxiety | 23 |
| Epistaxis | 23 |
| Petechiae | 23 |
| Anorexia | 21 |
| Hyperbilirubinemia | 21 |
| Hypotension | 21 |
Since idarubicin was included in all arms of therapy in this study, the frequency of adverse events (AEs) seen in the current study was compared to the frequency of AEs described in the Idamycin™ package insert. Several differences were observed in the most common toxicities between those observed in this study and those reported in the package insert for idarubicin used in combination with the Cytarabine regimen used for Group 2: mucositis (34% vs. 50%), hemorrhage (30% vs. 63%), hair loss (13% vs. 77%), and nausea and vomiting (68% vs. 82%).
Discussion
In phase I testing, cenersen was used as a single agent over five dose levels to treat 16 patients with AML or advanced myelodysplasia.21. Cenersen demonstrated similar pharmacokinetics to other phosphorothioates and no specific toxicities were attributed to its administration. There were no clinical responses. It was expected at the time that cenersen would have activity as a single agent based on in vitro studies. It was subsequently found, however, that atmospheric oxygen was supplying sufficient genomic damage to allow for the anti-leukemic effect of cenersen in vitro. Further, it was shown that low-dose anthracyclines could replace the elevated oxygen level as a source of genomic damage15.
The current phase IIa study was undertaken to clinically test the demonstrated need to combine a p53 inhibitor with a genome damaging agent in order to enhance the killing of cancer cells with wild-type p53.13,14,22–25 The statistical design of the study provided for the elimination of any of the three treatment arms that did not meet a predetermined response rate. A total of 53 patients were treated in this study and none of the treatment arms was terminated. In two of the treatment arms the intensity of the chemotherapy was less than that used to generate the historical control data. The CR rate in the intent to treat (ITT) population was 15% with a trend towards an improving CR rate with increasing dose of cytarabine (8%, 14% and 21%). Thus, the primary end point for the ITT population was not different than the 14% historical control. However, we have insufficient information to determine whether there is a true difference in response by cytarabine dose, particularly when considering only patients treated per protocol.
Given the frequent use of prohibited substances in this study an ad hoc per protocol population was defined for the purpose of a subset analysis. This per protocol population primarily excluded patients who received the substances prohibited by the protocol for use during treatment but also excluded patients who could not be evaluated for response or who did not meet the entry criteria.
The protocol precluded the use of acetaminophen and high-dose antioxidants during treatment because these agents had been shown in vitro to block the anti-leukemia effect of cenersen. Human AML cell lines and peripheral blood mononuclear cells express cytochrome P450 that converts acetaminophen to the highly reactive metabolite n-acetyl-p-benzoquinoneimine (NAPQI).27,28 NAPQI also has been shown to covalently bind to endogenous DNA in vivo but at low frequency.29 NAPQI alkylates cenersen and other phosphorothioates at multiple sites but not oligonucleotides with a phosphodiester linkage.30 Thus, this alkylation mostly likely occurs on the non-bridging sulfur in the phosphorothioate linkage.
Antioxidants scavenge free radicals that exhibit anti-leukemia effects on freshly obtained AML blasts when combined with cenersen. In addition, a wide variety of antioxidants can induce p21 independently of p53 and thereby cause cell cycle arrest.31–35 A key component of cenersen’s potential to sensitize cancers with wild-type p53 to conventional cancer therapeutics is its ability to prevent p53-dependent cell cycle arrest and repair activated by DNA-damaging agents.32–35 Failure to arrest proliferation allows the cancer cells to replicate their damaged DNA and, in turn, activate p53-independent programmed cell death. High dose antioxidants could stop this process by causing cell cycle arrest and inhibiting the therapeutic effect of cenersen.
Three lines of evidence based on comparisons between subgroups of the treated patients suggest possible positive trends supportive of the notion that cenersen might be active in AML. First, the analysis showed that the use of prohibited cenersen inhibitors during treatment was associated with no responses in the 14 patients who received one or both of these substances and who could be evaluated for response. In contrast, all 10 of the responders were in the group of 28 per protocol patients who could be evaluated for response and who did not receive these prohibited substances. Thus, there was a positive trend for a correlation between treatment failure and the administration of cenersen inhibitors (P = 0.0174).
Second, the response rate in the ITT group was highest among patients refractory to a single course of induction chemotherapy (CR 26%; CR + CRp 32%) compared to the response rate (CR 9%; CR + CRp 12%) for relapsed patients. In the per protocol group the respective CR rates for these two groups were refractory CR 38% (46% CR + CRp) vs. relapsed CR 16% (21% CR + CRp). Based on historical controls these two groups were expected to have the same CR rate for a subsequent course of treatment.18,36 It is possible, however, that the remissions achieved could have been achieved with the same chemotherapy without cenersen. Randomized studies would be required to further evaluate the possible contribution of cenersen to the responses observed in this patient population.
Third, eight of the 10 patients achieving a CR or CRp in this study either had been unresponsive to frontline treatment or had responses that lasted longer than the responses they had to prior frontline treatment suggesting adding cenersen to chemotherapy may contribute to achieving or obtaining an increased duration of response. There were responders in all three treatment groups. The 7 responders who underwent transplantation had a shorter median duration of response than the 3 responders who were not transplanted. This suggests the improvement in response duration following administration of a cenersen regimen was not due to transplant. The two patients who had a shorter response duration compared to that following frontline treatment died following transplant. Thus, the brevity of their response duration may not be attributable to the cenersen regimen.
Numerous studies have established that blocking p53 function by various means protects a wide variety of normal cells from the toxic effects of chemotherapy or radiation.37–40 In this study, there was no evidence that the addition of cenersen increased the toxicity expected from chemotherapy alone and no unique toxicity could be attributed to cenersen. Subsequent controlled trials involving cenersen should seek to more precisely define any role cenersen may have in protecting patients from adverse events resulting from cytotoxic therapies.
The adverse event profiles in this study were both qualitatively and quantitatively within the expected ranges for these chemotherapeutic regimens in first salvage patients.26 This small study failed to signal attribution of specific or unique toxicities to cenersen.
In conclusion, the combination of cenersen with idarubicin, with or without cytarabine, is well tolerated. The preclinical data and the results presented here suggest that this combination could potentially have a role in the management of AML. In order to achieve the optimal potential benefit of cenersen in this context, avoidance of anti-oxidants and acetaminophen are required. A placebo-controlled randomized trial is required to determine the clinical contribution of cenersen in this setting.
Acknowledgments
We thank Dr. Eli Estey for providing the statistical design and analysis of the MD Anderson database, Dr. Robert Hills for his analysis of the United Kingdom MRC database to determine the expected CR rates for a subsequent course of treatment for patients refractory to a single induction course vs. those relapsing in 12 months or less, and Dr. Birgitte Roland, University of Calgary and Calgary Laboratory Services, Calgary, Alberta Canada, for carrying out the karyotype classification.
Financial Disclosures: Clinical study supported by Eleos Inc
Footnotes
P30 CA016672, Ronald DePinho.
References
- 1.Janicke RU, Sohn D, Schulze-Osthoff K. The dark side of a tumor suppressor: anti-apoptotic p53. Cell Death Differ. 2008;15:959–976. doi: 10.1038/cdd.2008.33. [DOI] [PubMed] [Google Scholar]
- 2.Asker C, Wiman KG, Selivanova G. p53-induced apoptosis as a safeguard against cancer. Biochem Biophys Res Commun. 1999;265:1–6. doi: 10.1006/bbrc.1999.1446. [DOI] [PubMed] [Google Scholar]
- 3.Igney FH, Krammer PH. Death and anti-death: tumour resistance to apoptosis. Nat Rev Cancer. 2002;2:277–88. doi: 10.1038/nrc776. [DOI] [PubMed] [Google Scholar]
- 4.Schmitt CA, Fridman JS, Yang M, Baranov E, Hoffman RM, Lowe SW. Dissecting p53 tumor suppressor functions in vivo. Cancer Cell. 2002;1:289–298. doi: 10.1016/s1535-6108(02)00047-8. [DOI] [PubMed] [Google Scholar]
- 5.Schmitt CA. Senescence, apoptosis and therapy – cutting the lifelines of cancer. Nat Rev Cancer. 2003;3:286–295. doi: 10.1038/nrc1044. [DOI] [PubMed] [Google Scholar]
- 6.O’Connor PM, Jackman J, Bae I, et al. Characterization of the p53 tumor suppressor pathway in cell lines of the National Cancer Institute anticancer drug screen and correlations with the growth-inhibitory potency of 123 anticancer agents. Cancer Res. 1997;57:4285–4300. [PubMed] [Google Scholar]
- 7.Tovar C, Rosinski J, Filipovic Z, et al. Small-molecule MDM2 antagonists reveal aberrant p53 signaling in cancer: implications for therapy. Proc Natl Acad Sci U S A. 2006;103:1888–1893. doi: 10.1073/pnas.0507493103. [DOI] [PMC free article] [PubMed] [Google Scholar]
- 8.Kim E, Deppert W. Interactions of mutant p53 with DNA: guilt by association. Oncogene. 2007;26:2185–2190. doi: 10.1038/sj.onc.1210312. [DOI] [PubMed] [Google Scholar]
- 9.Li Y, Guessous F, Kwon S, et al. PTEN has tumor-promoting properties in the setting of gain-of-function p53 mutations. Cancer Res. 2008;68:1723–1731. doi: 10.1158/0008-5472.CAN-07-1963. [DOI] [PMC free article] [PubMed] [Google Scholar]
- 10.Mizuarai S, Yamanaka K, Kotani H. Mutant p53 induces the GEF-H1 oncogene, a guanine nucleotide exchange factor-H1 for RhoA, resulting in accelerated cell proliferation in tumor cells. Cancer Res. 2006;66:6319–6326. doi: 10.1158/0008-5472.CAN-05-4629. [DOI] [PubMed] [Google Scholar]
- 11.Yang X, Pater A, Tang S-C. Cloning and characterization of the human BAG-1 gene promoter: upregulation by tumor-derived p53 mutants. Oncogene. 1999;18:4546–4553. doi: 10.1038/sj.onc.1202843. [DOI] [PubMed] [Google Scholar]
- 12.Girnita L, Girnita A, Brodin B, et al. Increased expression of insulin-like growth factor I receptor in malignant cells expressing aberrant p53: functional impact. Cancer Res. 2000;60:5278–5283. [PubMed] [Google Scholar]
- 13.Tanaka H, Arakawa H, Yamaguchi T, et al. A ribonucleotide reductase gene involved in a p53-dependent cell-cycle checkpoint for DNA damage. Nature. 2000;404:42–49. doi: 10.1038/35003506. [DOI] [PubMed] [Google Scholar]
- 14.Sharp JG, Bishop MR, Copple B, et al. Oligonucleotide enhanced cytotoxicity of idarubicin for lymphoma cells. Leuk Lymphoma. 2001;42:417–427. doi: 10.3109/10428190109064599. [DOI] [PubMed] [Google Scholar]
- 15.Bayever E, Haines KM, Iversen PL, et al. Selective cytotoxicity to human leukemic myeloblasts produced by oligodeoxyribonucleotide phosphorothioates complementary to p53 nucleotide sequences. Leuk Lymphoma. 1994;12:223–231. doi: 10.3109/10428199409059593. [DOI] [PubMed] [Google Scholar]
- 16.Papaphilis AD, Kamper EF, Grammenou S, Kattamis C, Pangalis GA. RNase H of human leukemic cells: a new biological parameter in the study of human leukemias. Anticancer Res. 1990;10:1201–1212. [PubMed] [Google Scholar]
- 17.Papaphilis AD, Kamper EF, Grammenou S, Kattamis C, Pangalis GA. A new mononuclear cell (MNC) RNase H activity-based parameter (f) with possible prognostic value in assessing progression in acute myeloid leukaemia. Leuk Lymphoma. 1990;1:209–220. doi: 10.3109/10428199009042482. [DOI] [PubMed] [Google Scholar]
- 18.Estey E, Kornblau S, Pierce S, Kantarjian H, Beran M, Keating M. A stratification system for evaluating and selecting therapies in patients with relapsed or primary refractory acute myelogenous leukemia. Blood. 1996;88:756. [PubMed] [Google Scholar]
- 19.Grimwade D, Walker H, Oliver F, et al. The importance of diagnostic cytogenetics on outcome in aml: analysis of 1,612 patients entered into the MRC aml 10 trial. Blood. 1998;92:2322–2333. [PubMed] [Google Scholar]
- 20.Cheson BD, Bennett JM, Kopecky KJ, et al. Revised recommendations of the international working group for diagnosis, standardization of response criteria, treatment outcomes, and reporting standards for therapeutic trials in acute myeloid leukemia. J Clin Oncol. 2003;21:4642–4649. doi: 10.1200/JCO.2003.04.036. [DOI] [PubMed] [Google Scholar]
- 21.Bishop MR, Iversen PL, Bayever E, et al. Phase I trial of an antisense oligonucleotide OL(1)p53 in hematologic malignancies. J Clin Oncol. 1996;14:1320–1326. doi: 10.1200/JCO.1996.14.4.1320. [DOI] [PubMed] [Google Scholar]
- 22.Fan S, Smith ML, Rivet DJ, et al. Disruption of p53 function sensitizes breast cancer MCF-7 cells to cisplatin and pentoxifylline. Cancer Res. 1995;55:1649–1654. [PubMed] [Google Scholar]
- 23.Waldman T, Lengauer C, Kinzler KW, Vogelstein B. Uncoupling of S phase and mitosis induced by anticancer agents in cells lacking p2l. Nature. 1996;381:713–716. doi: 10.1038/381713a0. [DOI] [PubMed] [Google Scholar]
- 24.Wang Q, Fan S, Eastman A, Worland PJ, Sausville EA, O’Connor PM. UCN-01: a potent abrogator of G2 checkpoint function in cancer cells with disrupted p53. J Natl Cancer Inst. 1996;88:956–965. doi: 10.1093/jnci/88.14.956. [DOI] [PubMed] [Google Scholar]
- 25.Sak A, Wurm R, Elo B, et al. Increased radiation-induced apoptosis and altered cell cycle progression of human lung cancer cell lines by antisense oligodeoxynucleotides targeting p53 and p21WAF1/CIP1. Cancer Gene Ther. 2003;10:926–934. doi: 10.1038/sj.cgt.7700649. [DOI] [PubMed] [Google Scholar]
- 26.Atallah E, Cortes J, O’Brien S, et al. Establishment of baseline toxicity expectations with standard frontline chemotherapy in acute myelogenous leukemia. Blood. 2007;110:3547–3551. doi: 10.1182/blood-2007-06-095844. [DOI] [PubMed] [Google Scholar]
- 27.Nagai F, Hiyoshi Y, Sugimachi K, Tamura H-O. Cytochrome P450 (CYP) expression in human myeloblastic and lymphoid cell lines. Biol Pharm Bull. 2002;25:383–385. doi: 10.1248/bpb.25.383. [DOI] [PubMed] [Google Scholar]
- 28.Krovat BC, Tracy JH, Omiecinski CJ. Fingerprinting of cytochrome P450 and microsomal epoxide hydrolase gene expression in human blood cells. Toxicol Sci. 2000;55:352–360. doi: 10.1093/toxsci/55.2.352. [DOI] [PubMed] [Google Scholar]
- 29.Rogers LK, Smith CV. Acetaminophen (AP) at therapeutic doses (for humans) convalently binds to DNA in mice. The Toxicologist. 1996;30:282. Abstract 1446. [Google Scholar]
- 30.ELR1025b Eleos Internal Report: MALDI-TOF investigation of drug-drug covalent reaction between cenersen phosphorothioate DNA and the phosphodiester congener with NAPQI in both pH 3 phosphate buffer and pH 7 phosphate buffer containing 0.1 mM cysteine. 2007 [Google Scholar]
- 31.Zi X, Feyes DK, Agarwal R. Anticarcinogenic effect of a flavonoid antioxidant, silymarin, in human breast cancer cells MDA-MB-468: induction of G1 arrest through an increase in Cip1/p21 concomitant with a decrease in kinase activity of cyclin-dependent kinases and associated cyclins. Clin Cancer Res. 1998;4:1055–1064. [PubMed] [Google Scholar]
- 32.Nargi JL, Ratan RR, Griffin DE. p53-independent inhibition of proliferation and p21Waf1/Cip1- modulated induction of cell death by the antioxidants N-acetylcysteine and vitamin E. Neoplasia. 1999;1:544–556. doi: 10.1038/sj.neo.7900068. [DOI] [PMC free article] [PubMed] [Google Scholar]
- 33.Stivala LA, Savio M, Quarta S, et al. The antiproliferative effect of β-carotene requires p21/waf1/cip1 in normal human fibroblasts. Eur J Biochem. 2000;267:2290–2296. doi: 10.1046/j.1432-1327.2000.01236.x. [DOI] [PubMed] [Google Scholar]
- 34.Hsu S, Farrey K, Wataha J, et al. Role of p21Waf1 in green tea polyphenol-induced growth arrest and apoptosis of oral carcinoma cells. Anticancer Res. 2005;25:63–67. [PubMed] [Google Scholar]
- 35.Weng M-S, Ho Y-S, Lin J-K. Chrysin induces G1 phase cell cycle arrest in C6 glioma cells through inducing p21Waf1/Cip1 expression: involvement of p38 mitogen-activated protein kinase. Biochem Pharmacol. 2005;69:1815–1827. doi: 10.1016/j.bcp.2005.03.011. [DOI] [PubMed] [Google Scholar]
- 36.Hills R. ELP1020 study: historical investigation of response rate. Eleos Internal Report. 2009 Unpublished. [Google Scholar]
- 37.Pritchard DM, Potten CS, Hickman JA. The relationship between p53-dependent apoptosis, inhibition of proliferation, and 5-fluorouracil-induced histopathology in murine intestinal epithelia. Cancer Res. 1998;58:5453–5465. [PubMed] [Google Scholar]
- 38.Wlodarski P, Wasik M, Ratajczak MZ, et al. Role of p53 in hematopoietic recovery after cytotoxic treatment. Blood. 1998;91:2998–3006. [PubMed] [Google Scholar]
- 39.Komarov PG, Komarova EA, Kondratov RV, Christov-Tselkov K, Coon JS, Chernov MV, et al. A chemical inhibitor of p53 that protects mice from the side effects of cancer therapy. Science. 1999;285:1733–1737. doi: 10.1126/science.285.5434.1733. [DOI] [PubMed] [Google Scholar]
- 40.Botchkarev VA, Komarova EA, Siebenhaar F, et al. p53 is essential for chemotherapy-induced hair loss. Cancer Res. 2000;60:5002–5006. [PubMed] [Google Scholar]