

Abstract
Background:
Failure to detect depression in patients with Parkinson disease (PD) can lead to worsened outcomes for patients and caregivers. Accurate identification of depression would enable practitioners to provide comprehensive care for their patients with PD.
Methods:
Our objective was to examine the diagnostic accuracy of tools for detecting depression in adult outpatients with PD. We searched MEDLINE, PsycINFO, and EMBASE (inception to December 1, 2015), gray literature, and bibliographies of included studies. The pooled prevalence of depression across studies and diagnostic accuracy estimates were calculated using random-effects models. Diagnostic accuracy estimates were calculated across the best-reported cutoffs from each study and across specific cutoffs, when feasible.
Results:
Out of 8,184 citations, 21 studies were included, evaluating 24 tools, with 4 amenable to meta-analysis. The pooled prevalence of major depression was 22.9% (95% confidence interval [CI] 18.1–27.7). The 15-item Geriatric Depression Scale (GDS-15) had a pooled sensitivity of 0.81 (95% CI 0.64–0.91) and specificity of 0.91 (95% CI 0.87–0.94). The most sensitive cutoff for the GDS-15 was 5 at 0.91 (95% CI 0.83–1.00). The Beck Depression Inventory I/Ia had a pooled sensitivity of 0.79 (95% CI 0.61–0.90) and specificity of 0.85 (95% CI 0.79–0.90). The Montgomery-Åsberg Depression Rating Scale yielded a pooled sensitivity of 0.77 (95% CI 0.69–0.83) and specificity of 0.92 (95% CI 0.79–0.97). The Unified Parkinson's Disease Rating Scale had a pooled sensitivity of 0.72 (95% CI 0.64–0.79) and specificity of 0.80 (95% CI 0.70–0.87). All estimates had heterogeneity.
Conclusions:
There are several valid tools for detecting depression in patients with PD. Practitioners should choose one that fits their clinical practice.
Parkinson disease (PD) is a neurodegenerative disorder affecting 315 per 100,000 people in North America.1 The prevalence of major depressive disorder is approximately 17% in those with PD, which represents a substantial proportion vs the estimated 7% in the general population in the United States2 or 3.9% in Canada.3 Depression is frequently underdiagnosed and undertreated in PD, with approximately 20% of those diagnosed actually receiving treatment.4–6
Comorbid depression in PD worsens cognition, function, and quality of life, and increases caregiver burden and mortality.4,7,8 There are several known barriers to depression therapy that impact appropriate detection and treatment. One major barrier is the symptomatic overlap between PD and depression that may mask the timely detection and appropriate treatment of depression.4,6,8,9
An accurate way of detecting those patients with PD at risk for depression is highly desirable for clinicians, and would help appropriately target scarce front-line mental health resources.10,11 The current diagnostic gold standard for depression is the criterion-based clinical interview. However, in nonresearch settings this method is impractical for detecting depression.8,10 Consequently, depression screening tools are used to identify patients requiring further assessment and are a key first step to diagnosis. There are many tools available for depression screening in PD; however, it is unclear which of these tools is most accurate.9–12 Narrative reviews exist on this topic but a systematic review for examining tools for detecting depression in PD was not identified.11,13
The objective of this study was to review the diagnostic accuracy of screening tools for the detection of depression in adult outpatients with PD. We also sought to determine whether there were any reported differences in the administration of depression screening tools.
METHODS
Our study methods were determined a priori and registered with PROSPERO (CRD42014014503).14 The study protocol follows the recommendations provided in the Cochrane Handbook for Diagnostic Test Accuracy15,16 and the Preferred Reporting Items for Systematic Reviews and Meta-Analyses Protocols Statement and guidelines.17,18
Search strategy and literature sources.
We searched MEDLINE, EMBASE, and PsycINFO from database inception to December 1, 2015, without restrictions on year or language. Controlled vocabulary was used for the 3 main clusters of PD, depression, and detection. Related keywords, MeSH, EMTREE, and PsycINFO terms were combined with “or” to create search themes which were then combined with “and” (box e-1 on the Neurology® Web site at Neurology.org). Gray literature sources were reviewed (search date: November 24–28, 2014), including conference abstracts, society, and guideline Web sites (figure 1).
Figure 1. Preferred Reporting Items for Systematic Reviews and Meta-Analyses flow diagram.

Study screening and selection.
All citations and full-text articles were independently reviewed by 2 authors (Z.G., K.J.M.). If disagreement occurred, it was resolved by discussion. Eligibility criteria for the abstract review stage included the following: adults with PD and administration of a depression screening tool. Full-text eligibility criteria included diagnostic accuracy studies involving adults with PD in an outpatient setting (i.e., long-term care, assisted, or community living), the use of a depression screening tool as an index test to identify depression cases, and a gold standard. The gold standards accepted were the DSM19 or ICD. Studies were excluded if they lacked sufficient data for extraction or analysis, were unavailable in full text, or were nonhuman or not original research. We also consulted with field experts (N.J., T.P., J. Quickfall) to identify additional works. The kappa statistic was used to determine agreement between reviewers on study selection at the abstract review stage.
Data extraction.
A data extraction sheet was used to record study and patient demographic variables, PD severity, dementia status, study-specific prevalence of depression, index screening test, gold or referent standard, sensitivity, specificity, predictive values, and likelihood ratios. Data were extracted and verified between 2 authors (Z.G., K.J.M.). When multiple publications were based on the same population, the study with the largest sample was chosen. Investigators contacted authors to clarify potential overlap in cases where uncertainty existed. We only included unique, nonoverlapping samples to avoid multiple publication bias.5,20
Risk of bias and methodologic quality assessment.
The Quality Assessment of Diagnostic Accuracy Studies– (QUADAS-2) tool21 was used to assess methodologic quality and risk of bias. The tool was completed in duplicate for each included study (Z.G., K.J.M.). All items within the QUADAS-2 tool were reported in 22 items after investigators collapsed 4 self-evident items together.
Data synthesis, extraction, and analyses.
Two main outcomes were assessed: an estimate of pooled prevalence and the pooled diagnostic accuracy measures for depression screening tools.
Pooled prevalence.
An estimate of pooled prevalence for major or major and minor depression in patients with PD was calculated from study-specific point estimates using Mantel-Haenszel-weighted DerSimonian and Laird models.22 Heterogeneity in pooled estimates was assessed using I2 statistic and assessment of the p value associated with the Cochran Q statistic. Inspection of forest plots and the I2 statistic were used to assess for heterogeneity. A p value of <0.05 was used to determine significance. Heterogeneity was stratified as low, moderate, substantial, or considerable (0%–40%, 30%–60%, 50%–90%, or >75%, respectively).20 Where heterogeneity was detected, subgroup analysis and univariate metaregression were attempted. Covariates were identified as dementia status, disease severity, clinical setting, and interview type.5
Pooled estimates.
Individual 2 × 2 contingency tables were extracted and calculated from reported study-specific sensitivity, specificity, positive and negative predictive values, positive likelihood ratio (PLR) and negative likelihood ratio (NLR), and sample sizes. Zero cells were continuity corrected by adding 1.0 to each cell. Where necessary, values were back calculated from original reports and rounded to the nearest whole number for analysis. All available cutoff points were extracted for each depression screening tool. We first pooled across the optimal cutoffs reported in each study. These cutoffs may not have been the same between studies. Where possible, data were pooled across the same cutoff for a tool. When data discrepancies arose within a manuscript, authors were contacted. If data verification was not possible, those studies were excluded. This occurred in 2 studies involving 2 different tools (5-item WHO Well-Being Index and Depression Screening in Parkinson's disease questionnaire) where data inconsistencies existed between the text and tables.23,24
Pooled sensitivity, specificity, and likelihood ratios were calculated using bivariate random-effects models.25 The bivariate random-effects model was chosen to account for the frequent negative bivariate correlation between sensitivity and specificity. For analysis, these models require >4 studies to compute meta-analyses (midas, metandi). These bivariate models also examine the proportion of heterogeneity attributable to threshold effects. This indicates how much of the variation between studies is accounted for by differences in cutoff points. For the cutoff analyses, if only 3 studies were present, we combined estimates using DerSimonian and Laird random-effects models.
Summary receiver operating characteristic (SROC) plots were generated for all tools that were pooled to examine the changes in sensitivity and specificity values as the thresholds varied between studies.16 These plots examine test accuracy taking into account the different thresholds or cutoffs used across studies.16 More discriminatory tests generate SROC plots that are centered at the top left of the plane or with a higher area under the curve (AUC).16 To examine the posttest probabilities, a Fagan plot was created for each of the meta-analyzed tools. The calculated prevalence from included studies was used for pretest probability. Analyses were conducted using STATA 13.1 (Stata Corp., College Station, TX).
RESULTS
The electronic database search strategy yielded 7,177 citations. Most studies were excluded at the screening stage because they did not examine the diagnostic accuracy of depression screening tools in patients with PD. A total of 21 studies were retained for qualitative synthesis and 15 for meta-analysis (figure 1). Screening concordance between investigators for study inclusion was good (κ = 0.68; 95% confidence interval [CI] 0.61–0.76).26 The gray literature search generated 1,007 citations (figure 1).
Risk of bias assessment.
While quality scores did not lead to the removal of any studies from the review, there were concerns related to the reporting of blinding (table e-1). Blinding was generally not clearly stated; and investigators were unclear about index-referent and referent-index. The lack of clarity around blinding appeared likely attributable to unclear reporting vs design-related factors.
Summary of included studies.
Overall, 21 studies including 15 unique study populations and 2,028 patients with PD were included (table 1). The mean age of participants was 67.2 years (95% CI 65.1–69.4). All included studies were in English, published between 2000 and 2014, with broad geographic representation across 10 countries (Argentina, Australia, Brazil, Ecuador, Germany, Netherlands, Sri Lanka, Turkey, United Kingdom, United States). Included diagnostic accuracy studies comprised consecutive series, direct comparison, and cross-sectional diagnostic test accuracy designs,27 with the exception of 2 cohort studies.28,29 There were a total of 5 multicenter and 10 single-center studies (one study was unclear), and the study settings were movement disorder (n = 11) or neurology clinics (n = 4).
Table 1.
Summary data of depression screening tools in outpatients with Parkinson disease (PD)

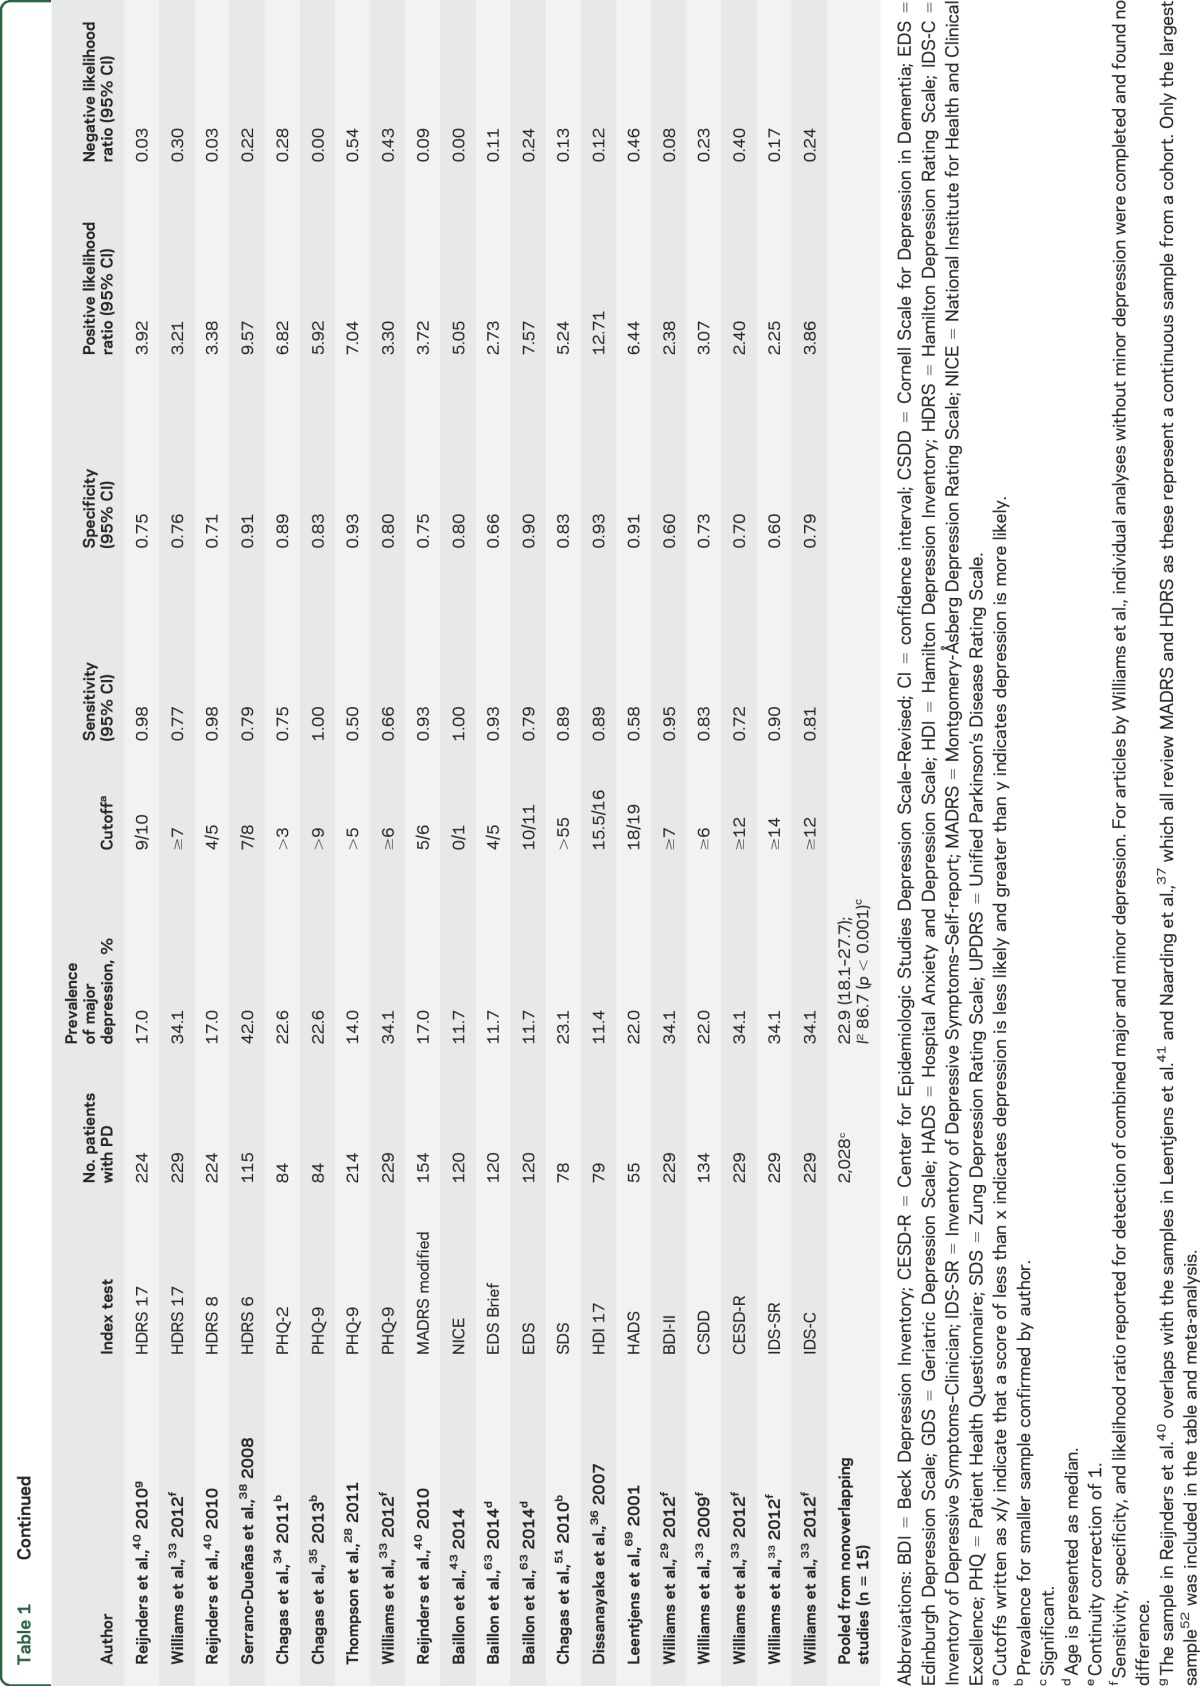
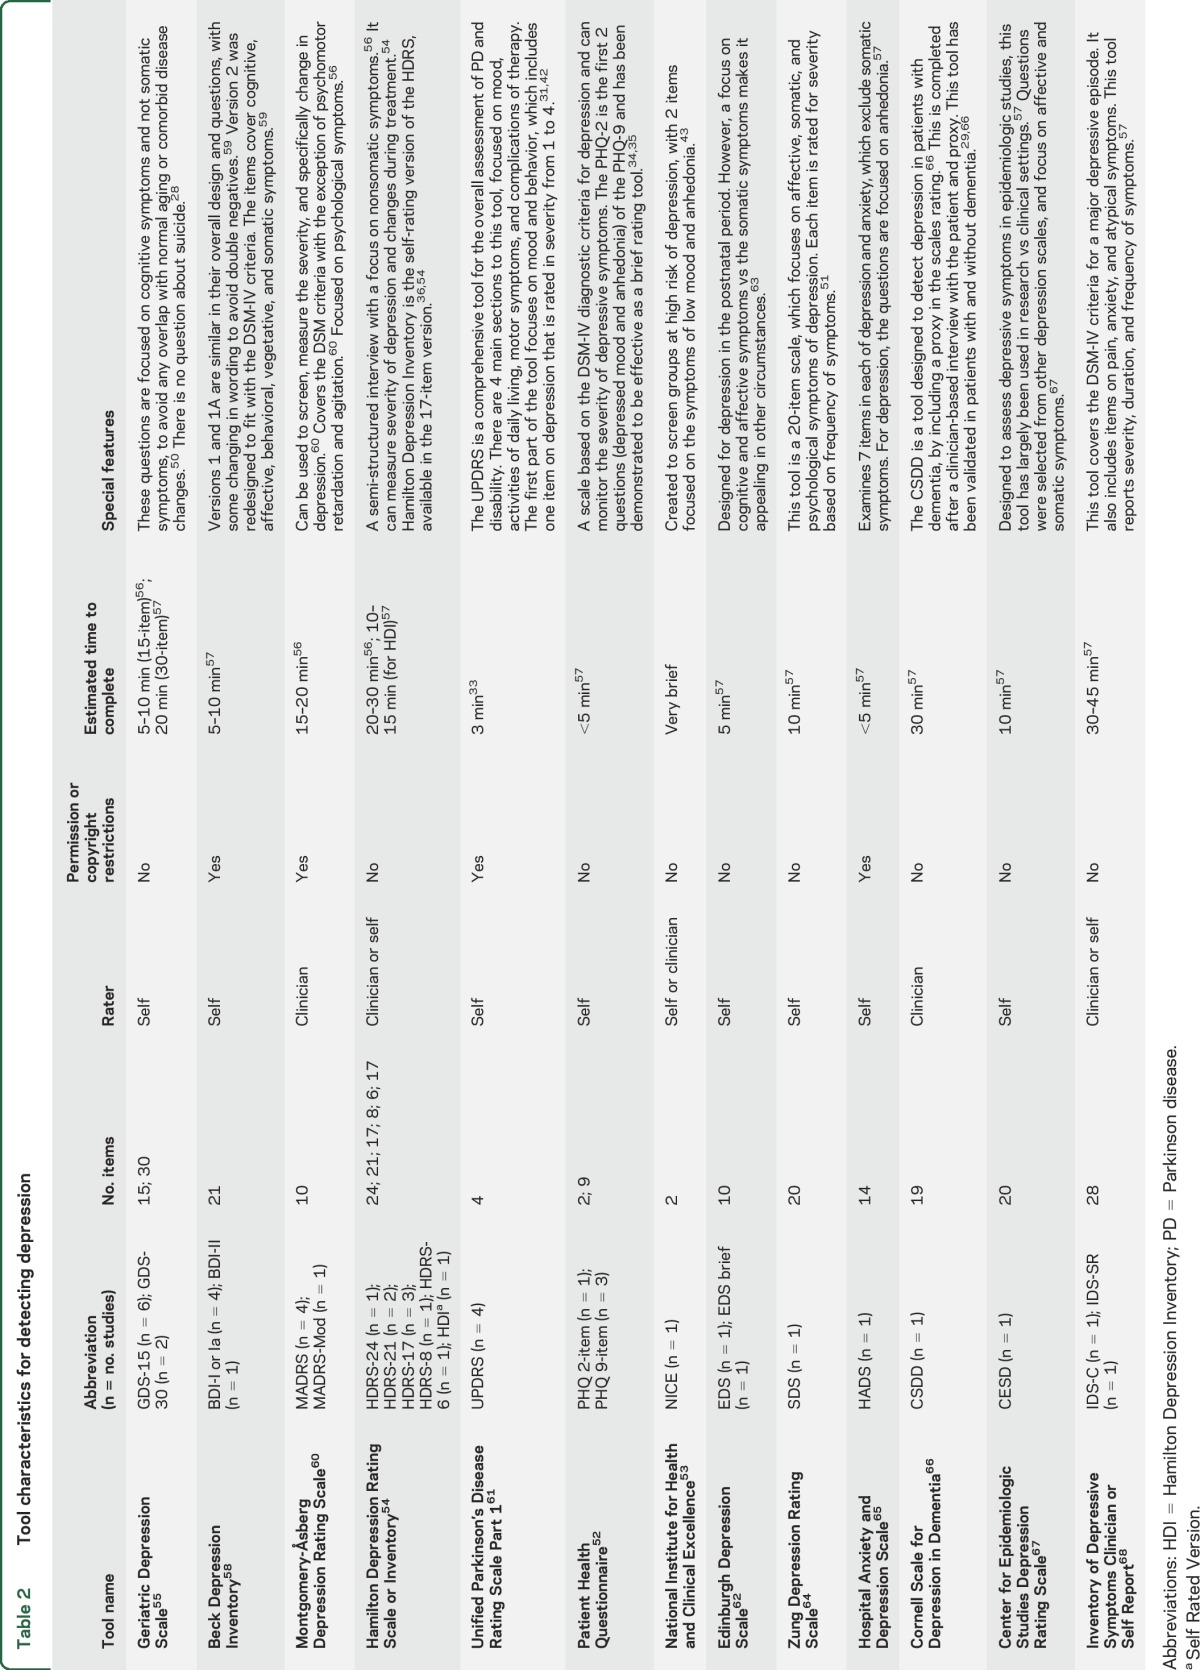
There were 24 validated depression screening tools assessed, including abbreviated and modified versions (table 2). Index tests were self-administered or administered by trained staff, depending on the nature of the tool. The gold standard was always administered in person by a trained professional. The most frequently used gold standard was the DSM. While data were extracted for all tools, only the 15-item Geriatric Depression Scale (GDS-15), Beck Depression Inventory (BDI) I/Ia, Unified Parkinson's Disease Rating Scale (UPDRS), and Montgomery-Åsberg Depression Rating Scale (MADRS) provided sufficient data for meta-analysis (table 1). The BDI-I and BDI-Ia were pooled, given they have similar questions and scoring. The only difference between them is the BDI-Ia collapsed multiple optional answers, each with the same score to one single answer.30 Prior studies have identified it is reasonable to collapse the 2 versions.30 Most studies excluded patients with dementia on the basis of a Mini-Mental State Examination (MMSE) score <23–24 or DSM diagnosis of dementia. There were only 3 studies that did not exclude patients with dementia29,31,32; in those that did not exclude dementia, the mean or median MMSE was >24 and no studies included persons with MMSE scores below 7.
Table 2.
Tool characteristics for detecting depression
Pooled prevalence.
The pooled prevalence of major depression across 15 unique populations (n = 2,028) was 22.9% (95% CI 18.1–27.7) (table 1). There was considerable heterogeneity between studies (I2 = 86.7%; p < 0.001). The prevalence estimate did not change when recalculated excluding the one study that included patients with PD with dementia.29 The prevalence of major and minor depression was 31.3% (95% CI 21.1–41.6) across 8 studies and 1,201 patients. This estimate also had heterogeneity (I2 = 94.1%; p < 0.001). We were unable to use several demographic covariates in the final analysis due to inconsistent reporting (e.g., dementia or disease severity) or if the variable was homogeneous (e.g., clinic location). Stratified and univariate meta-regression analyses were performed on prevalence for the variables interview type and continent. These analyses were underpowered (n < 10, per subgroup) to detect any difference27 and are thus not reported.
Tools.
The estimates reported for diagnostic accuracy are for major depression, as this was consistently reported (table 2). Data from 21 studies were included in the qualitative synthesis (table 1). One of the largest studies33 (n = 229) examined 9 depression screening tools and determined the GDS-30 was the most accurate and convenient tool for use (sensitivity 72% and specificity 82%). The Patient Health Questionnaire (PHQ) is a commonly used tool, which has been validated among patients with PD within 3 separate studies (sensitivities ranging from 50% to 100%; specificities 80%–93%).28,33–35 Another tool was the Hamilton Depression Rating Scale (HDRS), including 24-, 21-, 17-, and 6-item versions across 6 studies.33,36–40 This is a commonly used clinician rating tool with reported sensitivities of 75%–100% and specificities ranging from 71% to 99%. There were 5 studies that reported accuracy estimates for the HDRS-17; however, 3 of these studies had overlapping populations,37,40,41 thus estimates could not be pooled. Only the largest cohort from these 340 is reported in the summary table. Other tools reported in single studies include National Institute for Health and Clinical Excellence, Edinburgh Depression Scale (EDS)/EDS brief, Zung Depression Rating Scale, Hospital Anxiety and Depression Scale, Beck Depression Inventory–II, Cornell Scale for Depression in Dementia (CSDD), Center for Epidemiologic Studies Depression Rating Scale–Revised, and Inventory of Depressive Symptoms (IDS)–Self-report and IDS-Clinician. The reported sensitivities for these tools vary from 58% to 100% and specificities from 60% to 93% (table 1).
The GDS-15.
Six studies used the GDS-15, a self-rating tool for major depression. This tool had a pooled sensitivity of 0.81 (95% CI 0.64–0.91; I2 = 75.86; p < 0.0001) and specificity of 0.91 (95% CI 0.87–0.94; I2 = 60.87; p = 0.03) (figure 2A). The PLR was 9.05 (95% CI 6.46–12.67; I2 = 0; p = 0.41) and the NLR was 0.21 (95% CI 0.10–0.42; I2 = 79.59; p = 0.01). An SROC curve was generated to visualize the relationship between sensitivity and specificity across the 6 pooled studies with an AUC of 0.94 (95% CI 0.91–0.96). The Fagan plot for this tool found a posttest probability for confirming depression of 73% and a posttest probability of ruling out depression of 6% (figure e-1A). Only 3 studies reported estimates for use of the GDS-15 to detect major and minor depression; hence there were insufficient studies to pool.28,35,36,39,42,43
Figure 2. Forest plots.

(A–D) Forest plots of sensitivity and specificity for the Geriatric Depression Scale, Beck Depression Inventory, Montgomery-Åsberg Depression Rating Scale, and Unified Parkinson's Disease Rating Scale.
For the GDS-15, cutoff points 5–9 were amenable to meta-analysis for major depression (table e-2). The cutoff of 5 had the highest sensitivity at 0.91 (95% CI 0.83–1.00; I2 = 0; p = 0.94; n = 3), but the lowest specificity at 0.71 (95% CI 0.66–0.77; I2 = 0; p = 0.61; n = 3). The cutoff of 6 represented a balance of sensitivity and specificity–sensitivity 0.87 (95% CI 0.78–0.95; I2 = 0; p = 0.79) and specificity 0.88 (95% CI 0.85–0.92; I2 = 76.9; p = 0.005). The highest specificity was at a cutoff of 9 with a specificity of 0.93% (95% CI 0.90–0.96; I2 = 36.9; p = 0.21). Overall heterogeneity was low in the cutoff analysis.
The BDI-I/Ia.
Four studies used the BDI-I/Ia, a self-rating tool. The pooled sensitivity was 0.79 (95% CI 0.61–0.90; I2 = 44.65; p = 0.14) and specificity was 0.85 (95% CI 0.79–0.90; I2 = 22.67; p = 0.27) (figure 2B). The pooled PLR was 5.41 (95% CI 3.83–7.63; I2 = 0; p = 0.66) and NLR was 0.25 (95% CI 0.13–0.48; I2 = 0; p = 0.41).23,42,44,45 An SROC curve of sensitivity and specificity demonstrated an AUC of 0.89 (95% CI 0.86–0.92). A Fagan plot showed a posttest probability for confirming disease of 62% and the reported posttest probability of ruling out disease of 7% (figure e-1B).
The MADRS.
Four studies used the MADRS, a clinician-rated tool, yielding a pooled sensitivity of 0.77 (95% CI 0.69–0.83; I2 = 62.42; p = 0.05) and specificity of 0.92 (95% CI 0.79–0.97; I2 = 86.99; p < 0.0001) (figure 2C). Pooled PLR and NLR were 9.93 (95% CI 3.36–29.38; I2 = 65.91; p < 0.0001) and 0.25 (95% CI 0.17–0.35; I2 = 65.08; p = 0.04), respectively.32,33,40,45 An SROC curve demonstrated an AUC of 0.84 (95% CI 0.80–0.87). The Fagan plot showed a high posttest probability for confirming disease of 75% and the reported posttest probability of ruling out disease was 7% (figure e-1C).
The UPDRS.
Four studies used the UPDRS, a self-rating tool, which has a pooled sensitivity of 0.72 (95% CI 0.64–0.79; I2 = 0; p = 0.65) and a specificity of 0.80 (95% CI 0.70–0.87; I2 = 76.20; p = 0.01) (figure 2D). Pooled PLR and NLR were 3.60 (95% CI 2.35–5.50; I2 = 26.47; p = 0.04) and 0.35 (95% CI 0.27–0.45; I2 = 0; p = 0.69), respectively. An SROC curve demonstrated an AUC of 0.89 (95% CI 0.86–0.92).31,33,34,42 The Fagan plot showed a posttest probability for confirming disease of 52% and the reported posttest probability of ruling out disease was 9% (figure e-1D).
Heterogeneity.
Statistically significant heterogeneity was observed in the pooled estimates for the GDS and MADRS tool, and could be categorized as substantial. The proportion of heterogeneity likely due to threshold effect was 1.0, indicating the observed heterogeneity was related to different cutoffs used between studies. There were not enough data to pool within the same cutoffs for the UPDRS, MADRS, or BDI. Given the high proportion of heterogeneity due to threshold effect, tools that included only 3 studies were not pooled to avoid potentially biased estimates in the setting of the different cutoffs.
DISCUSSION
This systematic review identified several valid tools for detecting depression in those experiencing PD. Three tools were sensitive and specific for identifying depression in PD: the GDS-15, BDI-I/1a, and MADRS. This enables clinics to examine patients in a valid and accurate manner, and to determine which patients need further assessment. The identification of several valid depression detection tools is ideal for providers, as this allows providers to tailor their choice of tool to specific clinical circumstances.
The pooled prevalence of major depression was 22.9%, which approximates the findings from a 2008 meta-analysis that reported a prevalence of 24% for major depression in PD outpatient clinic settings (n = 11).5 It is notable that the prevalence of depression in PD varies with setting. The prevalence across all settings is 17%, and only 8% in population studies.5 Therefore, the use of depression detection tools is likely best targeted to outpatient clinics, given that the pretest probability for depression is higher.
Findings suggest the GDS-15 would be an appropriate screening tool for depression in this population given its higher sensitivity. Also, the GDS has the highest AUC at 0.94 on the SROC analysis, indicating better global performance. The GDS also has the advantage of being available in the public domain (copyright free) and is a well-known brief self-rating tool that requires few resources to implement in a clinic. The GDS has also been translated into many different languages and has a collateral source version.
However, there is heterogeneity in the estimate across the best-reported cutoffs, attributable to the different thresholds compared. This variation is addressed by the meta-analysis of each cutoff, which revealed a cutoff of 5 as the most robust screening cutoff with the highest sensitivity (at 91%) and nonsignificant heterogeneity. Also, one study28 in the GDS meta-analysis has a much lower reported sensitivity at 43% than the other studies, which contributed to the heterogeneity of the estimate pooled across the best cutoffs.
These findings coincide with those from a large study33 that identified the clinical utility of the GDS. The GDS also addresses the concern of symptom overlap between depression and PD, given that the tool seeks to determine psychological and social dimensions rather than somatic dimensions, thereby reducing the potential influence of comorbid medical concerns on the outcome of the screening tool.13
The BDI-I/Ia and MADRS are also valid tools. The BDI has a slightly lower sensitivity and PLR, making it less clinically discriminative. The main difficulty with the use of the BDI-I/Ia is that it is based on the older DSM-III criteria.46 The MADRS tool has a higher PLR, but lower sensitivity, meaning it is less able to rule out disease. Additionally, the MADRS is clinician-rated rather than self-rated, which may limit its use in certain clinical settings due to time and resource constraints. The BDI and MADRS tools are variably controlled by copyright, making these less accessible tools for use clinically.11
The UPDRS is a comprehensive PD assessment tool34,42; however, when the single item is isolated for depression screening, it appears to have lower discriminatory value. This is likely because a single question will not capture the varied features of depression.33
The PHQ-9 is a commonly used depression rating tool that is based on the DSM-IV criteria, includes a question addressing suicidality, and is a self-rating tool that is in the public domain.33,35 However, across 3 studies, it demonstrated a wide range of sensitivity between 50% and 100%. One study reported a group of patients specifically with dementia, using the clinician CSDD.29 Almost all other studies either excluded patients with dementia or included them in the total final estimate without reporting a subgroup.
Study limitations.
Although we included studies from any outpatient location, the bulk of the included studies focused on movement disorders or neurology clinics. This is a potential source of bias in that patients presenting to these specialty clinics may have more severe illness, be older, be on more therapies, and potentially have a higher prevalence of comorbidities than their counterparts managed elsewhere. Additionally, there is an older age range within the included studies. It is possible that certain tools designed for an elderly population, such as the GDS,47 may perform differently in a younger population of patients with PD. However, this was examined in 2007, and the GDS-15 demonstrated validity in nonelderly and elderly patients with PD.48
There was a lack of reporting consistency or absence of important underlying population characteristics; for example, factors such as disease severity, patient assessment in “on” or “off” state, treatment for depression, or history of depression in the dataset.11,49 This meant that further subgroup analysis of the estimates based on these factors was not possible. Low study numbers for subgroup analysis precluded meaningful analysis based on factors such as interview type, location, and country.5
Clinical utility.
The use of a tool for detecting depression would assist clinicians in identifying those patients with PD who may be at risk and require further assessment. This review demonstrates the availability of 15 validated tools for the detection of depression. Tools are potentially more practical for ease of use in the clinic if they are self-rating, without copyright, and are short, such as the GDS. However, it is important that the tool chosen provides accurate and meaningful results to the specific context to base further clinical decisions.
Supplementary Material
ACKNOWLEDGMENT
The authors thank Diane Lorenzetti, MLS, Research Librarian, for her input into the search strategy, and William Ghali, MD, FRCPC, and Jeremy Quickfall, FRCPC, for advice and suggestions.
GLOSSARY
- AUC
area under the curve
- BDI
Beck Depression Inventory
- CI
confidence interval
- CSDD
Cornell Scale for Depression in Dementia
- DSM
Diagnostic and Statistical Manual of Mental Disorders
- EDS
Edinburgh Depression Scale
- GDS-15
15-item Geriatric Depression Scale
- HDRS
Hamilton Depression Rating Scale
- ICD
International Classification of Diseases
- IDS
Inventory of Depressive Symptoms
- MADRS
Montgomery-Åsberg Depression Rating Scale
- MMSE
Mini-Mental State Examination
- NLR
negative likelihood ratio
- PD
Parkinson disease
- PHQ
Patient Health Questionnaire
- PLR
positive likelihood ratio
- QUADAS-2
Quality Assessment of Diagnostic Accuracy Studies–2
- SROC
summary receiver operating characteristic
- UPDRS
Unified Parkinson’s Disease Rating Scale
Footnotes
Supplemental data at Neurology.org
AUTHOR CONTRIBUTIONS
There was no direct funding for this project. Z.G. and K.J.M. performed all citation/full text screening, quality assessments, data extraction, and analysis and drafted the manuscript. K.J.M., Z.G., J.H.-L., N.J., T.P., and D.J.R. provided input and suggestions into the protocol and manuscript. Z.G. registered the protocol with PROSPERO.14 All authors reviewed and approved the final manuscript. Z.G. had full access to the data in the study and takes responsibility for the integrity of the data and accuracy of the data analysis.
STUDY FUNDING
No targeted funding reported.
DISCLOSURE
Z. Goodarzi is employed as a PGY-6 Geriatric Medicine Fellow at the University of Calgary, while concurrently enrolled as a Masters' student in the Department of Community Health Sciences and cross-appointed to the Clinical Investigator Program; and has received funding from Canadian Institutes for Health Research–Canadian Graduate Student Scholarship, Alberta Innovates Health Solutions Clinician Fellowship Award, and Western Regional Training Centre affiliate award. K. Mrklas is a Doctoral student in the Department of Community Health Sciences at the University of Calgary and employed as a KT Implementation Scientist with Alberta Health Services; and is supported by an Alberta Health Services Post Secondary Education Tuition Award. D. Roberts is supported by an Alberta Innovates–Health Solutions Clinician Fellowship Award, a Knowledge Translation Canada Strategic Training in Health Research Fellowship, and funding from the Canadian Institutes of Health Research. N. Jette holds a Canada Research Chair Tier 2 in Health Services Research, is on the editorial board of Neurology®, and holds research grants from the Canadian Institutes of Health Research, Alberta Innovates Health Solutions, the Alberta Spine Foundation, the University of Calgary Cumming School of Medicine, Department of Clinical Neurosciences, and Hotchkiss Brain Institute (HBI), and a grant cofunded by the University of Calgary HBI and Pfizer Canada. There is no financial support for this review. T. Pringsheim has an unrestricted educational grant from Shire Canada and research grant support from Sick Kids Foundation, Alberta Health Services Mental Health Strategic Clinical Network, Hotchkiss Brain Institute, and Canadian Institutes for Health Research. J. Holroyd-Leduc received funding from Alberta Health Services as the Scientific Director of the Seniors Health Strategic Clinical Network. Go to Neurology.org for full disclosures.
REFERENCES
- 1.Pringsheim T, Jette N, Frolkis A, Steeves TD. The prevalence of Parkinson's disease: a systematic review and meta-analysis. Mov Disord 2014;29:1583–1590. [DOI] [PubMed] [Google Scholar]
- 2.Kessler RC, Chiu WT, Demler O, Merikangas KR, Walters EE. Prevalence, severity, and comorbidity of 12-month DSM-IV disorders in the National Comorbidity Survey Replication. Arch Gen Psychiatry 2005;62:617–627. [DOI] [PMC free article] [PubMed] [Google Scholar]
- 3.Patten SB, Williams JV, Lavorato DH, Wang JL, McDonald K, Bulloch AG. Descriptive epidemiology of major depressive disorder in Canada in 2012. Can J Psychiatry 2015;60:23–30. [DOI] [PMC free article] [PubMed] [Google Scholar]
- 4.Pachana NA, Egan SJ, Laidlaw K, et al. Clinical issues in the treatment of anxiety and depression in older adults with Parkinson's disease. Mov Disord 2013;28:1930–1934. [DOI] [PubMed] [Google Scholar]
- 5.Reijnders JS, Ehrt U, Weber WE, Aarsland D, Leentjens AF. A systematic review of prevalence studies of depression in Parkinson's disease. Mov Disord 2008;23:183–189; quiz 313. [DOI] [PubMed] [Google Scholar]
- 6.Frisina PG, Borod JC, Foldi NS, Tenenbaum HR. Depression in Parkinson's disease: health risks, etiology, and treatment options. Neuropsychiatr Dis Treat 2008;4:81–91. [DOI] [PMC free article] [PubMed] [Google Scholar]
- 7.Rocha FL, Murad MG, Stumpf BP, Hara C, Fuzikawa C. Antidepressants for depression in Parkinson's disease: systematic review and meta-analysis. J Psychopharmacol 2013;27:417–423. [DOI] [PubMed] [Google Scholar]
- 8.Marsh L. Depression and Parkinson's disease: current knowledge. Curr Neurol Neurosci Rep 2013;13:409. [DOI] [PMC free article] [PubMed] [Google Scholar]
- 9.Schrag A. Apathy and depression scales in Parkinson's disease: are they good enough? J Neurol Sci 2011;310:216–219. [DOI] [PubMed] [Google Scholar]
- 10.Schrag A, Leentjens AF. Parkinson disease: scales to detect depression in Parkinson disease. Nat Rev Neurol 2012;8:359–360. [DOI] [PubMed] [Google Scholar]
- 11.Schrag A, Barone P, Brown RG, et al. Depression rating scales in Parkinson's disease: critique and recommendations. Mov Disord 2007;22:1077–1092. [DOI] [PMC free article] [PubMed] [Google Scholar]
- 12.Costa FH, Rosso AL, Maultasch H, Nicaretta DH, Vincent MB. Depression in Parkinson's disease: diagnosis and treatment. Arq Neuropsiquiatr 2012;70:617–620. [DOI] [PubMed] [Google Scholar]
- 13.Torbey E, Pachana NA, Dissanayaka NN. Depression rating scales in Parkinson's disease: a critical review updating recent literature. J Affect Disord 2015;184:216–224. [DOI] [PubMed] [Google Scholar]
- 14.PROSPERO: International Prospective Register of Systematic Reviews Centre for Reviews and Dissemination. Guidance Notes for Registering a Systematic Review Protocol With PROSPERO. London: National Institute for Health Research; 2013. [Google Scholar]
- 15.Bossuyt PM, Leeflang MM. Developing criteria including studies. In: Cochrane Handbook for Systematic Reviews of Diagnostic Test Accuracy, version 0.4, ch 6 [updated September 2008]. London: The Cochrane Collaboration; 2008. [Google Scholar]
- 16.Deeks JJBP, Gatsonis C. Cochrane Handbook for Systematic Reviews of Diagnostic Test Accuracy. London: The Cochrane Collaboration; 2013. [Google Scholar]
- 17.Moher D, Shamseer L, Clarke M, et al. Preferred Reporting Items for Systematic Review and Meta-analysis Protocols (PRISMA-P) 2015 statement. Syst Rev 2015;4:1. [DOI] [PMC free article] [PubMed] [Google Scholar]
- 18.Moher D, Liberati A, Tetzlaff J, Altman DG; The PRISMA Group. Preferred reporting items for systematic reviews and meta-analyses: the PRISMA statement. BMJ 2009;339:b2535. [DOI] [PMC free article] [PubMed] [Google Scholar]
- 19.American Psychiatric Association. Diagnostic and Statistical Manual of Mental Disorders, 5th ed. Arlington: American Psychiatric Association Publishing; 2013. [Google Scholar]
- 20.Higgins J, Green S. Cochrane Handbook for Systematic Reviews of Interventions, version 5.1.0 [updated 2011]. London: The Cochrane Collaboration; 2011. [Google Scholar]
- 21.Whiting PF, Rutjes AW, Westwood ME, et al. QUADAS-2: a revised tool for the quality assessment of diagnostic accuracy studies. Ann Intern Med 2011;155:529–536. [DOI] [PubMed] [Google Scholar]
- 22.DerSimonian R. Meta-analysis in the design and monitoring of clinical trials. Stat Med 1996;15:1237–1252. [DOI] [PubMed] [Google Scholar]
- 23.Schneider CB, Pilhatsch M, Rifati M, et al. Utility of the WHO-Five Well-being Index as a screening tool for depression in Parkinson's disease. Mov Disord 2010;25:777–783. [DOI] [PubMed] [Google Scholar]
- 24.Storch A, Paelecke-Habermann Y, Schneider CB, et al. Validity of the DESPAR questionnaire as a new screening tool for depression in Parkinson's disease. Basal Ganglia 2011;1:97–103. [Google Scholar]
- 25.Egger M. Systematic Reviews in Health Care: Meta-analysis in Context. New York: John Wiley & Sons; 2008. [Google Scholar]
- 26.Orwin R. Evaluating coding decisions. In: Cooper H, Hedges LV, editors. The Handbook of Research Synthesis. New York: Russell Sage Foundation; 1994. [Google Scholar]
- 27.Centre for Reviews and Dissemination. Systematic Reviews: CRD's Guidance for Undertaking Reviews in Health Care. Layerthorpe: Centre for Reviews and Dissemination, University of York; 2008. [Google Scholar]
- 28.Thompson AW, Liu H, Hays RD, et al. Diagnostic accuracy and agreement across three depression assessment measures for Parkinson's disease. Parkinsonism Relat Disord 2011;17:40–45. [DOI] [PMC free article] [PubMed] [Google Scholar]
- 29.Williams JR, Marsh L. Validity of the Cornell scale for depression in dementia in Parkinson's disease with and without cognitive impairment. Mov Disord 2009;24:433–437. [DOI] [PMC free article] [PubMed] [Google Scholar]
- 30.Beck AT, Steer RA, Garbin MG. Psychometric properties of the Beck Depression Inventory: twenty-five years of evaluation. Clin Psychol Rev 1988;8:77–100. [Google Scholar]
- 31.Starkstein SE, Merello M. The Unified Parkinson's Disease Rating Scale: validation study of the mentation, behavior, and mood section. Mov Disord 2007;22:2156–2161. [DOI] [PubMed] [Google Scholar]
- 32.Ketharanathan T, Hanwella R, Weerasundera R, De Silva VA. Major depressive disorder in Parkinson's disease: a cross-sectional study from Sri Lanka. BMC Psychiatry 2014;14:2014. [DOI] [PMC free article] [PubMed] [Google Scholar]
- 33.Williams JR, Hirsch ES, Anderson K, et al. A comparison of nine scales to detect depression in Parkinson disease: which scale to use? Neurology 2012;78:998–1006. [DOI] [PMC free article] [PubMed] [Google Scholar]
- 34.Chagas MH, Crippa JA, Loureiro SR, et al. Validity of the PHQ-2 for the screening of major depression in Parkinson's disease: two questions and one important answer. Aging Ment Health 2011;15:838–843. [DOI] [PubMed] [Google Scholar]
- 35.Chagas MH, Tumas V, Rodrigues GR, et al. Validation and internal consistency of Patient Health Questionnaire-9 for major depression in Parkinson's disease. Age Ageing 2013;42:645–649. [DOI] [PubMed] [Google Scholar]
- 36.Dissanayaka NN, Sellbach A, Matheson S, et al. Validity of Hamilton Depression Inventory in Parkinson's disease. Mov Disord 2007;22:399–403. [DOI] [PubMed] [Google Scholar]
- 37.Naarding P, Leentjens AF, van Kooten F, Verhey FR. Disease-specific properties of the Rating Scale for Depression in patients with stroke, Alzheimer's dementia, and Parkinson's disease. J Neuropsychiatry Clin Neurosci 2002;14:329–334. [DOI] [PubMed] [Google Scholar]
- 38.Serrano-Duenas M, Soledad Serrano M. Concurrent validation of the 21-item and 6-item Hamilton Depression Rating Scale versus the DSM-IV diagnostic criteria to assess depression in patients with Parkinson's disease: an exploratory analysis. Parkinsonism Relat Disord 2008;14:233–238. [DOI] [PubMed] [Google Scholar]
- 39.Weintraub D, Oehlberg KA, Katz IR, Stern MB. Test characteristics of the 15-item Geriatric Depression Scale and Hamilton Depression Rating Scale in Parkinson disease. Am J Geriatr Psychiatry 2006;14:169–175. [DOI] [PMC free article] [PubMed] [Google Scholar]
- 40.Reijnders JS, Lousberg R, Leentjens AF. Assessment of depression in Parkinson's disease: the contribution of somatic symptoms to the clinimetric performance of the Hamilton and Montgomery-Åsberg rating scales. J Psychosom Res 2010;68:561–565. [DOI] [PubMed] [Google Scholar]
- 41.Leentjens AF, Verhey FR, Lousberg R, Spitsbergen H, Wilmink FW. The validity of the Hamilton and Montgomery-Åsberg depression rating scales as screening and diagnostic tools for depression in Parkinson's disease. Int J Geriatr Psychiatry 2000;15:644–649. [DOI] [PubMed] [Google Scholar]
- 42.Tumas V, Rodrigues GG, Farias TL, Crippa JA. The accuracy of diagnosis of major depression in patients with Parkinson's disease: a comparative study among the UPDRS, the geriatric depression scale and the Beck depression inventory. Arq Neuropsiquiatr 2008;66:152–156. [DOI] [PubMed] [Google Scholar]
- 43.Baillon S, Dennis M, Lo N, Lindesay J. Screening for depression in Parkinson's disease: the performance of two screening questions. Age Ageing 2014;43:200–205. [DOI] [PubMed] [Google Scholar]
- 44.Leentjens AF, Verhey FR, Luijckx GJ, Troost J. The validity of the Beck Depression Inventory as a screening and diagnostic instrument for depression in patients with Parkinson's disease. Mov Disord 2000;15:1221–1224. [DOI] [PubMed] [Google Scholar]
- 45.Silberman CD, Laks J, Capitao CF, Rodrigues CS, Moreira I, Engelhardt E. Recognizing depression in patients with Parkinson's disease: accuracy and specificity of two depression rating scale. Arq Neuropsiquiatr 2006;64:407–411. [DOI] [PubMed] [Google Scholar]
- 46.Beck AT, Steer RA, Ball R, Ranieri W. Comparison of Beck Depression Inventories -IA and -II in psychiatric outpatients. J Pers Assess 1996;67:588–597. [DOI] [PubMed] [Google Scholar]
- 47.Sheikh JI, Yesavage JA, Brooks JO III, et al. Proposed factor structure of the Geriatric Depression Scale. Int Psychogeriatr 1991;3:23–28. [DOI] [PubMed] [Google Scholar]
- 48.Weintraub D, Saboe K, Stern MB. Effect of age on Geriatric Depression Scale performance in Parkinson's disease. Mov Disord 2007;22:1331–1335. [DOI] [PMC free article] [PubMed] [Google Scholar]
- 49.Marsh L, McDonald WM, Cummings J, Ravina B; NINDS/NIMH Work Group on Depression and Parkinson’s Disease. Provisional diagnostic criteria for depression in Parkinson's disease: report of an NINDS/NIMH Work Group. Mov Disord 2006;21:148–158. [DOI] [PubMed] [Google Scholar]
- 50.Ertan FS, Ertan T, Kiziltan G, Uygucgil H. Reliability and validity of the Geriatric Depression Scale in depression in Parkinson's disease. J Neurol Neurosurg Psychiatry 2005;76:1445–1447. [DOI] [PMC free article] [PubMed] [Google Scholar]
- 51.Chagas MH, Tumas V, Loureiro SR, et al. Validity of a Brazilian version of the Zung self-rating depression scale for screening of depression in patients with Parkinson's disease. Parkinsonism Relat Disord 2010;16:42–45. [DOI] [PubMed] [Google Scholar]
- 52.Kroenke K, Spitzer RL, Williams JB. The PHQ-9: validity of a brief depression severity measure. J Gen Intern Med 2001;16:606–613. [DOI] [PMC free article] [PubMed] [Google Scholar]
- 53.National Institute for Health and Care Excellence. Depression in Adults with a Chronic Physical Health Problem: Recognition and Management. London: National Institute for Health and Care Excellence; 2009. [Google Scholar]
- 54.Hamilton M. A rating scale for depression. J Neurol Neurosurg Psychiatry 1960;23:56–62. [DOI] [PMC free article] [PubMed] [Google Scholar]
- 55.Yesavage JA, Brink TL, Rose TL, et al. Development and validation of a geriatric depression screening scale: a preliminary report. J Psychiatr Res 1982;17:37–49. [DOI] [PubMed] [Google Scholar]
- 56.Sheehan B. Assessment scales in dementia. Ther Adv Neurol Disord 2012;5:349–358. [DOI] [PMC free article] [PubMed] [Google Scholar]
- 57.Lam R, Michalak E, Swinson R. Assessment Scales in Depression, Mania, and Anxiety. Abingdon: Taylor Francis Group; 2005. [Google Scholar]
- 58.Beck AT, Ward CH, Mendelson M, Mock J, Erbaugh J. An inventory for measuring depression. Arch Gen Psychiatry 1961;4:561–571. [DOI] [PubMed] [Google Scholar]
- 59.Smarr KL, Keefer AL. Measures of depression and depressive symptoms: Beck Depression Inventory–II (BDI-II), Center for Epidemiologic Studies Depression Scale (CES-D), Geriatric Depression Scale (GDS), Hospital Anxiety and Depression Scale (HADS), and Patient Health Questionnaire–9 (PHQ-9). Arthritis Care Res 2011;63(suppl 11):S454–S466. [DOI] [PubMed] [Google Scholar]
- 60.Montgomery SA, Åsberg M. A new depression scale designed to be sensitive to change. Br J Psychiatry 1979;134:382–389. [DOI] [PubMed] [Google Scholar]
- 61.Fahn S, Elton R. Unified Parkinson's disease rating scale. In: Fahn S, Marsden CD, Calne DB, Goldstein M, editors. Recent Developments in Parkinson's Disease II. Florham Park: Macmillan Health Centre Information; 1987. [Google Scholar]
- 62.Cox JL, Holden JM, Sagovsky R. Detection of postnatal depression: development of the 10-item Edinburgh Postnatal Depression Scale. Br J Psychiatry 1987;150:782–786. [DOI] [PubMed] [Google Scholar]
- 63.Baillon S, Lindesay J, Prabhakaran P, et al. The utility of the Edinburgh Depression Scale as a screening tool for depression in Parkinson's disease. Int J Geriatr Psychiatry 2014;29:1286–1293. [DOI] [PubMed] [Google Scholar]
- 64.Zung WW, Richards CB, Short MJ. Self-rating depression scale in an outpatient clinic: further validation of the SDS. Arch Gen Psychiatry 1965;13:508–515. [DOI] [PubMed] [Google Scholar]
- 65.Zigmond AS, Snaith RP. The Hospital Anxiety and Depression Scale. Acta Psychiatr Scand 1983;67:361–370. [DOI] [PubMed] [Google Scholar]
- 66.Alexopoulos GS, Abrams RC, Young RC, Shamoian CA. Cornell Scale for Depression in Dementia. Biol Psychiatry 1988;23:271–284. [DOI] [PubMed] [Google Scholar]
- 67.Radloff LS. The Center for Epidemiological Studies–Depression Scale: a self-report depression scale for research in the general population. Appl Psychol Meas 1977;3:385–401. [Google Scholar]
- 68.Rush AJ, Giles DE, Schlesser MA, Fulton CL, Weissenburger J, Burns C. The Inventory for Depressive Symptomatology (IDS): preliminary findings. Psychiatry Res 1986;18:65–87. [DOI] [PubMed] [Google Scholar]
- 69.Leentjens AFG, Lousberg R, Verhey FRJ. The psychometric properties of the Hospital Anxiety and Depression Scale in patients with Parkinson's disease. Acta Neuropsychiatr 2001;13:83–85. [Google Scholar]
Associated Data
This section collects any data citations, data availability statements, or supplementary materials included in this article.