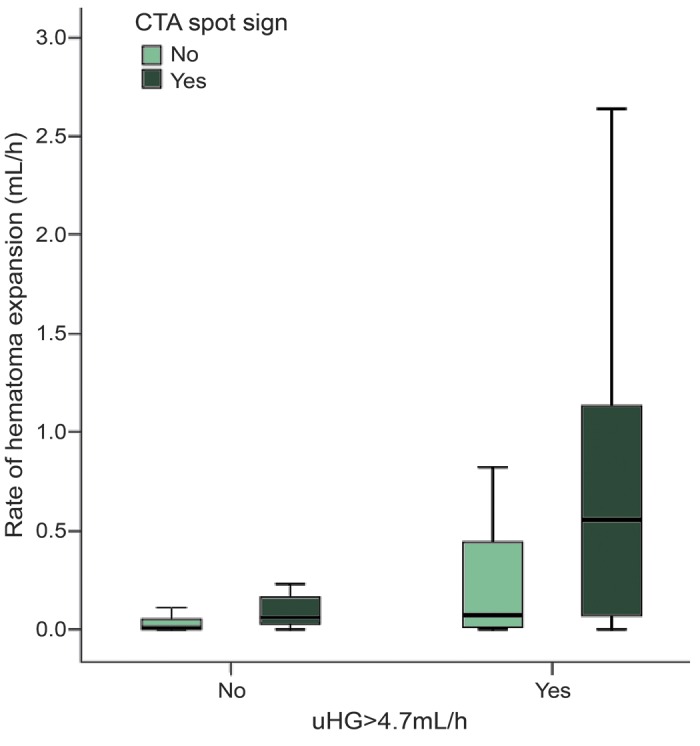
Figure. Relationship between ultraearly hematoma growth (uHG), CT angiography (CTA) spot sign, and rate of hematoma expansion.

Boxplot graphs of rate of hematoma expansion categorized by uHG >4.7 mL/h and clustered by the presence of the CTA spot sign. Higher rate of hematoma expansion was observed in patients with uHG >4.7 mL/h, particularly in those with a CTA spot sign. No interaction was found between uHG >4.7 mL/h and the CTA spot sign (2-way analysis of variance, p = 0.477), indicating that the effect of uHG and the spot sign on the rate of hematoma expansion does not depend on each other, and therefore its combination increases the effect.
