
Figure 3. Wiz binding consensus shows a high degree of overlap with that for CTCF.
(A) The six most enriched motifs in Wiz ChIP-seq peaks (n = 39,781) and their distribution inside peaks are shown. (B) The most significant of these matches the CTCF-binding site consensus sequence (JASPAR CORE database - MA0139.1). (C) Read density for Wiz and the Encode CTCF and H3K4me3 ChIP-seq datasets were calculated across a 4 kb region centred on the ~40,000 Wiz ChIP-seq peaks. Input sequencing from the Wiz ChIP-seq experiment is also shown. Loci are clustered by the similarity of read density and datasets were normalized to the smallest sized library. (D) Venn diagram showing the overlap for Wiz, CTCF and H3K4me3 ChIP-seq peaks. An overlap was defined as at least one base of sequence occupied by a significantly enriched peak (p≤1 × 10⁻²⁰) from two datasets.
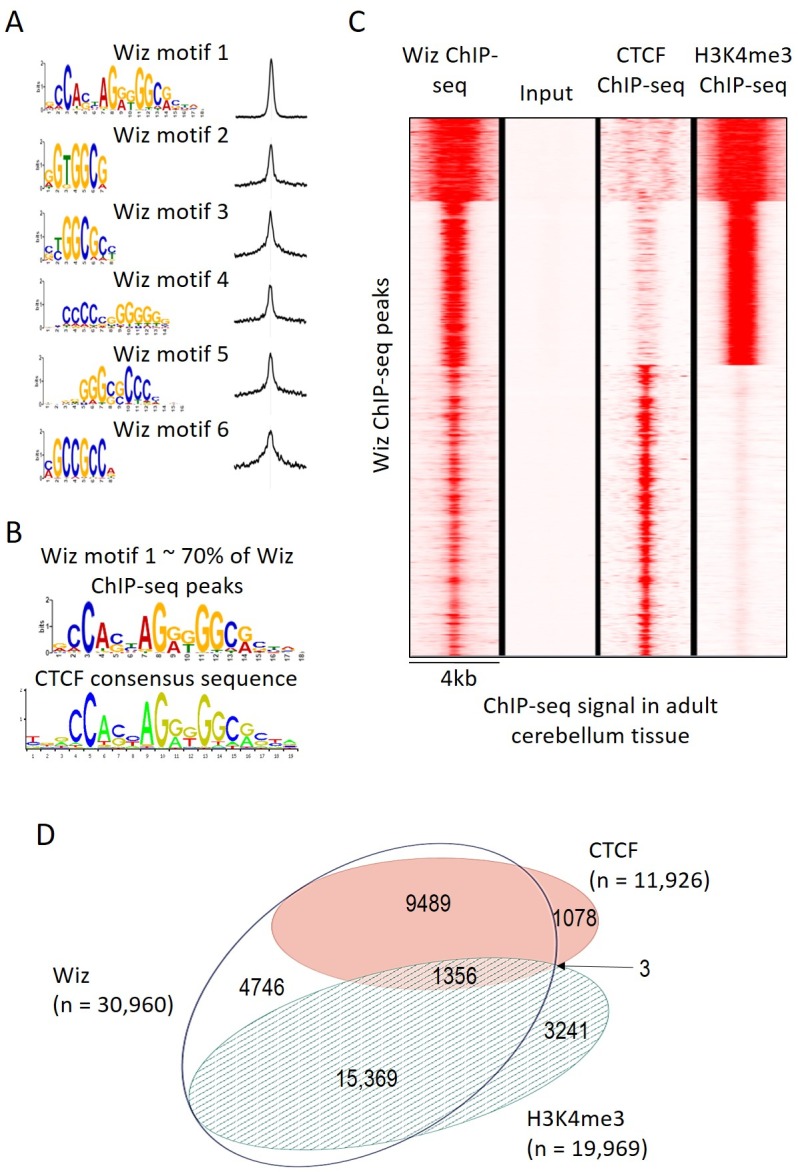
Figure 3—figure supplement 1. Remapping publically available Wiz ChIP-seq data.
