Fig. 1.

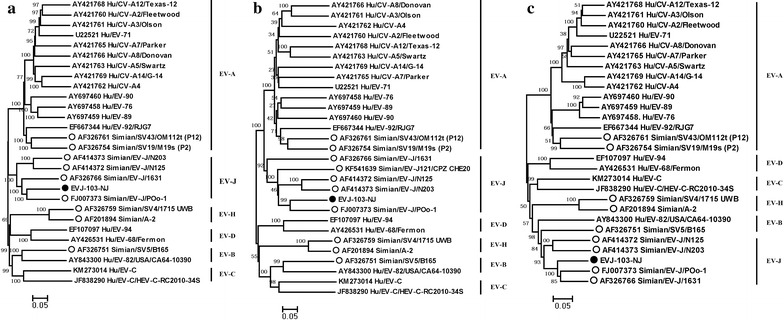
Phylogenetic analysis based on the complete genome (a), VP1 region (b) and 3D region (c). Empty dots indicate the simian EV and black dots indicate the strain from our study

Phylogenetic analysis based on the complete genome (a), VP1 region (b) and 3D region (c). Empty dots indicate the simian EV and black dots indicate the strain from our study