

Patients with newly diagnosed, non-M3 acute myeloid leukaemia (AML) treated between 1993 and 2012 with available cytogenetic data were analysed based on the European Leukaemia Net (ELN-C) and UK Medical Research Council classification (MRC-C) systems (Dohner, et al 2010, Grimwade, et al 2010). Patients < 60 years were treated with idarubicin-based protocols (typically 12 mg/m2/day × 3) combined with high-dose cytarabine (1000 – 2000 mg/m2/day for 3-5 days); patients > 60 years with non-favourable cytogenetics were treated with lower- intensity programmes utilizing azacitidine, decitabine and novel agents. All protocols were approved by the Institutional Review Board and patients signed informed consents in accordance with the Declaration of Helsinki.
Patients with available cytogenetic data were classified according to the MRC-C (Grimwade, et al 2010). Patients with cytogenetic data and mutational status for the FLT3 and NPM1 genes were also grouped according to a modified ELN-C (Dohner, et al 2010). Biallelic CEBPA mutational analysis was not available for the majority of patients, and was not included in the current analysis. Although an important limitation, given the low incidence of biallelic CEBPA mutations (8-14%) in prior studies, the current analysis remains informative.
We examined the categorization and outcomes of patients according to the MRC-C and the ELN-C and compared the incidence of cytogenetic subgroups by age using the Wilcoxon-Mann-Whitney test and survival using the Kaplan Meier method. Log-rank test was used to compare overall survival (OS) among subgroups of patients categorized by MRC-C or ELN-C. The C-index was computed to assess the discriminative ability of MRC-C and ELN-C for OS within age groups.
A total of 2070 patients, with a median age of 60 years (range, 12-89) were included. (Supplemental Table 1) The median follow-up was 37 months (0.6 – 135) and 1196 (55%) were male. Among all patients, 766 (37%) had a normal karyotype (copy number, CN), including 330 (34%) patients < 60 years. Of the remainder, 27%, 10%, 5%, 3% and 17% of patients had 1, 2, 3, 4 or 5+ cytogenetic abnormalities, respectively. Patients (N=1920, non-acute promyelocytic leukaemia) were classified according to the MRC-C. As the MRC-C only included patients < 60 years, those aged < 60 years (N=857) and ≥ 60 years (N=1063) were analysed separately. The incidence of cytogenetic abnormalities overall and in those < 60 years, along with the incidence reported by the MRC (Grimwade, et al 2010) are summarized in supplemental Table 2. In comparison to the MRC data, our cohort of patients (<60 years) had a significantly lower incidence of CN-AML (34% vs. 41%, p< 0.001) and a significantly higher incidence of del(5q), del(7q), t(9;11) and monosomies 5, 7, 12 and 17 (all p< 0.001).
A subset of patients with available molecular data (N=1026, 50%) were analysed. These patients had a median follow-up of 25 months and a median age of 62 years (17- 88), with 539 patients (53%) ≥ 60 years old. Of these, 199 (19%) were FLT3-ITD (+) and 114 (11%) were NPM1mut (+). Significantly more patients < 60 years were classified as favourable (FAV) and significantly more patients ≥ 60 years were classified as adverse (ADV, p<0.001) (Figure 1A-D).
Figure 1.

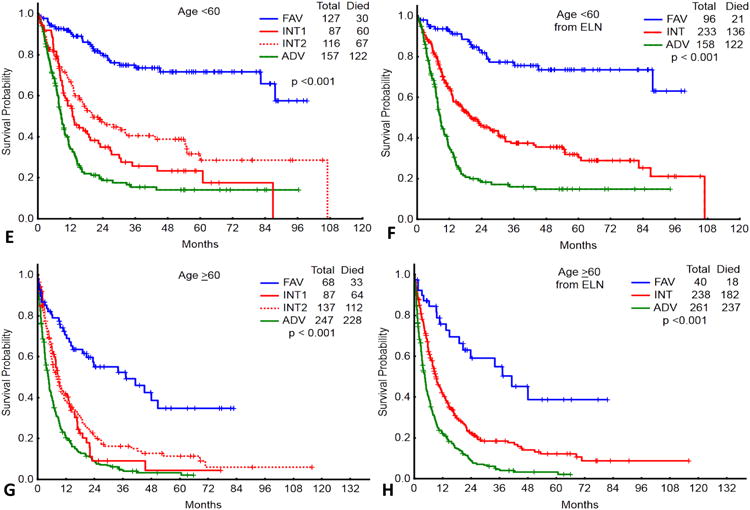
Distribution of patients < 60 years (N=487) by the European Leukaemia Net (ELN) (A) and UK Medical Research Council (MRC) (C) classification systems. Distribution of the patients ≥ 60 years (N=539) by the ELN (B) and MRC (D) classification systems. Bottom panel: Overall survival of patients < 60 years (N=487) classified by the ELN (E) and MRC (F) classifications systems. Overall survival of patients ≥ 60 years (N=539) classified by the ELN (G) and MRC (H) classification systems.
FAV, favourable; INT, intermediate; ADV, adverse
The outcomes of patients < 60 and ≥ 60 years grouped by the ELN-C and MRC-C are shown in figures 1E-H. The median OS, 5-year OS, and complete response rates are summarized in supplemental Tables 3 and 4.
To assess the discriminative ability of each classification system for OS, we computed the C-index for the younger and older patients within each system. For patients ≥ 60 years, the C-index was 0.610 and 0.613 for the MRC-C and ELN-C, respectively. In contrast, for patients < 60 years, the C-index was 0.659 and 0.674, for the MRC-C and ELN-C, respectively. This suggests that the two systems were similar in their discriminative ability for patients ≥ 60 years, but the ELN-C was more discriminative in patients < 60 years.
We analysed how many patients changed prognostic categories upon reclassification by the ELN-C. Of the 419 patients classified as ADV by the MRC-C, 35 (8%) were reclassified as intermediate (INT)-2 by ELN-C. Of the 471 patients classified as INT by the MRC-C, 20 (4%) were reclassified as ADV, 59 (13%) reclassified as FAV, and the rest, as INT-1 (36%) and INT-2 (46%) (Table I). All patients in the MRC-C FAV category remained FAV in the ELN-C (Table I). Although we examined the outcomes, by age, of those that were reclassified to a new ELN group, the subgroups were too small to make meaningful conclusions. The median OS was either similar to the original MRC estimation, or intermediate between the two. However, in the larger group of patients (in both age groups) reclassified from MRC-INT to ELN-FAV, the median OS was significantly higher than their original classification and more in line with the expected outcome for ELN-FAV.
Table I. Reclassification of Patients from the UK Medical Research Council classification (MRC-C) to the European Leukaemia Net classification (ELN-C).
| ELN-C | ||||||
|---|---|---|---|---|---|---|
| Prognostic Category | Adverse | Intermediate-1 | Intermediate-2 | Favourable | Total | |
| MRC-C | Adverse | 384 | 0 | 35 | 0 | 419 |
| Intermediate | 20 | 174 | 218 | 59 | 471 | |
| Favourable | 0 | 0 | 0 | 136 | 136 | |
| Total | 404 | 174 | 253 | 195 | 1026 | |
| Age ≥ 60 years | Adverse | Intermediate-1 | Intermediate-2 | Favourable | Total | |
| MRC-C | Adverse | 239 | 0 | 22 | 0 | 261 |
| Intermediate | 8 | 87 | 115 | 28 | 238 | |
| Favourable | 0 | 0 | 0 | 40 | 40 | |
| Total | 247 | 87 | 137 | 68 | 539 | |
| Age < 60 years | Adverse | Intermediate-1 | Intermediate-2 | Favourable | Total | |
| MRC-C | Adverse | 145 | 0 | 13 | 0 | 158 |
| Intermediate | 12 | 87 | 103 | 31 | 233 | |
| Favourable | 0 | 0 | 0 | 96 | 96 | |
| Total | 157 | 87 | 116 | 127 | 487 | |
Bold, underlined figures indicate the number of patients that were re-classified.
To our knowledge, this is the first study that applied both the MRC-C and ELN-C to the same large cohort of AML patients and analysed their outcomes by each. We found that the ELN-C provided similar discriminatory ability as the MRC-C in patients ≥60 years, but was better able to discriminate prognostic subgroups in patients < 60 years. However, in the subgroup of patients who were reclassified from MRC-INT to ELN-FAV (in both age groups), the availability of the FLT3 and NPM1 mutation data was able to identify a cohort (NPM1mut+/FLT3wt) with a favourable prognosis, with implications for treatment strategy.(Schlenk, et al 2008)
The outcomes of our patients in each subgroup classified by the ELN-C are comparable to published reports of large validation studies. (Mrozek, et al 2012, Rollig, et al 2011) Although the correlation was stronger for patients < 60 years, this was also the case in patients ≥ 60 years, despite the heterogeneity of therapy in our cohort. The relative consistency of the ELN-C across 3 different cohorts of patients treated by 3 separate groups further validates its utility as an important prognostic tool.
Further determination of the prognostic significance of newly discovered genetic abnormalities in AML (Ley et al 2013) will allow further refinement of classification systems for better risk-adapted treatment approaches and individualized therapy.
Supplementary Material
Acknowledgments
This research is supported in part by the National Institutes of Health through MD Anderson's Cancer Center Support Grant CA016672.
Footnotes
Contribution: TMK, HK, and FR designed the study and performed the research. TMK, FR, XW, MB, and SP collected, analysed, and interpreted the data. TMK, HK, GGM, GB, EJ, ND, NP, JC, and FR contributed patients for the study. KP helped with hemato-pathologic and molecular analysis. TMK and FR wrote the manuscript with input from HK, JC, GGM, GB, KP, EJ, ND, and NP. All authors approved the final manuscript.
Conflict of Interest Disclosure: The authors have no relevant conflicts of interest to disclose.
References
- Dohner H, Estey EH, Amadori S, Appelbaum FR, Buchner T, Burnett AK, Dombret H, Fenaux P, Grimwade D, Larson RA, Lo-Coco F, Naoe T, Niederwieser D, Ossenkoppele GJ, Sanz MA, Sierra J, Tallman MS, Lowenberg B, Bloomfield CD. Diagnosis and management of acute myeloid leukemia in adults: recommendations from an international expert panel, on behalf of the European LeukemiaNet. Blood. 2010;115:453–474. doi: 10.1182/blood-2009-07-235358. [DOI] [PubMed] [Google Scholar]
- Grimwade D, Hills RK, Moorman AV, Walker H, Chatters S, Goldstone AH, Wheatley K, Harrison CJ, Burnett AK. Refinement of cytogenetic classification in acute myeloid leukemia: determination of prognostic significance of rare recurring chromosomal abnormalities among 5876 younger adult patients treated in the United Kingdom Medical Research Council trials. Blood. 2010;116:354–365. doi: 10.1182/blood-2009-11-254441. [DOI] [PubMed] [Google Scholar]
- Ley TJ, Miller C, Ding L, Raphael BJ, Mungall AJ, Robertson A, Hoadley K, Triche TJ, Jr, Laird PW, Baty JD, Fulton LL, Fulton R, Heath SE, KalickiVeizer J, Kandoth C, Klco JM, Koboldt DC, Kanchi KL, Kulkarni S, Lamprecht TL, Larson DE, Lin L, Lu C, McLellan MD, McMichael JF, Payton J, Schmidt H, Spencer DH, Tomasson MH, Wallis JW, Wartman LD, Watson MA, Welch J, Wendl MC, Ally A, Balasundaram M, Birol I, Butterfield Y, Chiu R, Chu A, Chuah E, Chun HJ, Corbett R, Dhalla N, Guin R, He A, Hirst C, Hirst M, Holt RA, Jones S, Karsan A, Lee D, Li HI, Marra MA, Mayo M, Moore RA, Mungall K, Parker J, Pleasance E, Plettner P, Schein J, Stoll D, Swanson L, Tam A, Thiessen N, Varhol R, Wye N, Zhao Y, Gabriel S, Getz G, Sougnez C, Zou L, Leiserson MD, Vandin F, Wu HT, Applebaum F, Baylin SB, Akbani R, Broom BM, Chen K, Motter TC, Nguyen K, Weinstein JN, Zhang N, Ferguson ML, Adams C, Black A, Bowen J, Gastier-Foster J, Grossman T, Lichtenberg T, Wise L, Davidsen T, Demchok JA, Shaw KR, Sheth M, Sofia HJ, Yang L, Downing JR, Eley G, Alonso S, Ayala B, Baboud J, Backus M, Barletta SP, Berton DL, Chu AL, Girshik S, Jensen MA, Kahn A, Kothiyal P, Nicholls MC, Pihl TD, Pot DA, Raman R, Sanbhadti RN, Snyder EE, Srinivasan D, Walton J, Wan Y, Wang Z, Issa JP, Le Beau M, Carroll M, Kantarjian H, Kornblau S, Bootwalla MS, Lai PH, Shen H, Van Den Berg DJ, Weisenberger DJ, Link DC, Walter MJ, Ozenberger BA, Mardis ER, Westervelt P, Graubert TA, DiPersio JF, Wilson RK for the Cancer Genome Atlas Research Network. Genomic and epigenomic landscapes of adult de novo acute myeloid leukemia. N Engl J Med. 2013;368:2059–2074. doi: 10.1056/NEJMoa1301689. [DOI] [PMC free article] [PubMed] [Google Scholar]
- Mrozek K, Marcucci G, Nicolet D, Maharry KS, Becker H, Whitman SP, Metzeler KH, Schwind S, Wu YZ, Kohlschmidt J, Pettenati MJ, Heerema NA, Block AW, Patil SR, Baer MR, Kolitz JE, Moore JO, Carroll AJ, Stone RM, Larson RA, Bloomfield CD. Prognostic significance of the European LeukemiaNet standardized system for reporting cytogenetic and molecular alterations in adults with acute myeloid leukemia. J Clin Oncol. 2012;30:4515–4523. doi: 10.1200/JCO.2012.43.4738. [DOI] [PMC free article] [PubMed] [Google Scholar]
- Rollig C, Bornhauser M, Thiede C, Taube F, Kramer M, Mohr B, Aulitzky W, Bodenstein H, Tischler HJ, Stuhlmann R, Schuler U, Stolzel F, von Bonin M, Wandt H, Schafer-Eckart K, Schaich M, Ehninger G. Long-term prognosis of acute myeloid leukemia according to the new genetic risk classification of the European LeukemiaNet recommendations: evaluation of the proposed reporting system. J Clin Oncol. 2011;29:2758–2765. doi: 10.1200/JCO.2010.32.8500. [DOI] [PubMed] [Google Scholar]
- Schlenk RF, Dohner K, Krauter J, Frohling S, Corbacioglu A, Bullinger L, Habdank M, Spath D, Morgan M, Benner A, Schlegelberger B, Heil G, Ganser A, Dohner H. Mutations and treatment outcome in cytogenetically normal acute myeloid leukemia. N Engl J Med. 2008;358:1909–1918. doi: 10.1056/NEJMoa074306. [DOI] [PubMed] [Google Scholar]
Associated Data
This section collects any data citations, data availability statements, or supplementary materials included in this article.