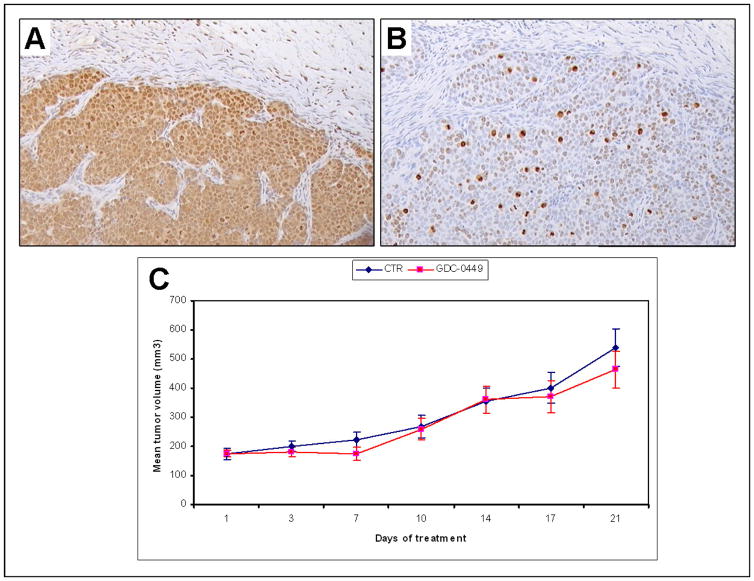
Figure 4. A. Gli2 and B. Ki67 expression, C. Mean tumor volume of MDA PCa 118b xenograft.
A. High expression of Gli2 in a tumor treated with GDC-0449 (original magnification ×100). B. High expression of ki67 in the same tumor as A (original magnification ×100). C. Mean tumor volume of MDA PCa 118b prostate cancer xenograft during 21 days of treatment with small molecule Smo inhibitor GCD-0449. Control group with blue and GDC-0449 treated group with red color.

