Journal of Pathology Informatics logoLink to Journal of Pathology Informatics
. 2016 Jul 28;7:33.

Abstract

PMCID: PMC4977978
J Pathol Inform. 2016 Jul 28;7:33.

Development of a Digital Pathology Database for Annotation and Quality Management of a Brain Tumor Biorepository


Jeremy Molligan1, Robert Stapp1, Miraj Patel1, Jack London1, Chirayu Goswami1, James Evans1, Stephen Peiper1

1Department of Pathology, Thomas Jefferson University, Philadelphia, Pennsylvania, US. E-mail: jeremy.molligan@jefferson.edu

CONTENT

Biorepositories play a crucial role in biomedical research on human disease. A richly annotated biorepository was designed and implemented at Thomas Jefferson University through the integration of clinical data, pathologic data, whole-slide imaging, and CAP-modelled quality control procedures. Specimens with corresponding clinical and genomic data are accessible via a single web portal.

TECHNOLOGY

Open-source software was utilized, including: Open Specimen v1.2 (database application for specimen inventory, tracking, and annotation), i2b2 (a patient data analytics platform), NeuroDB (custom clinical data acquisition web application), the Aperio whole-slide imaging system, Cerner CoPath Plus v2012 (A/P LIS) [Kansas City, MO, United States], and inventory management utilizing BioTillion [Skillman, NJ, United States] RFID enabled specimen vials.

DESIGN

After consenting the patient, clinicians enter clinical data into NeuroDB. Blood and tissue samples are collected directly from the OR, processed, and annotated within Open Specimen. Specimens are aliquoted for FFPE and routine histology (1), nucleic acid extraction (2), and cryopreservation in LN2 (6). The QC slide is examined by a pathologist, electronically documented for quality control, and scanned utilizing the Aperio imaging system. The pathology files are accessible for quality management and to investigators via an i2b2 query tool link and a web-based image viewer. Pathology reports are transferred from Cerner CoPath Plus to i2b2 via an HL7 interface, where the information is parsed, de-identified, and uploaded into the i2b2 research data mart.

RESULTS

Researchers are able to search for banked tissue samples via the i2b2 query tool. These specimens have been managed utilizing strict quality control standards, are annotated with relevant clinical history, morphologic diagnoses, molecular diagnoses, and digital images.

CONCLUSIONS

Current medical research requires access to large numbers of tissue samples consented for broad research use, that have extensive annotation, and whose collection and preservation conserves the integrity of macromolecules. Past archived specimens obtained rarely meet all of these requirements making it necessary to establish a state-of-the-art biorepository to for current and future research. The development of a complementary database of digital images will enhance quality management and provide scientists with knowledge of the composition of banked tissue.

J Pathol Inform. 2016 Jul 28;7:33.

Standardization of Electronic Templates for Cancer and Biomarker Reporting


Keren I. Hulkower1, Thomas P. Baker2, Michael A. Berman3, James Dvorak1, Jaleh Mirza1, Richard L. Moldwin1, Samantha Spencer1

1Structured Data Team, College of American Pathologists, Northfield, IL, 2The Joint Pathology Center, Silver Spring, MD, 3Jefferson Regional Medical Center, Jefferson Hills, PA, USA. E-mail: khulkow@cap.org

CONTENT

The Cancer Committee and Pathology Electronic Reporting Committee of the College of American Pathologists (CAP) have developed data capture forms for cancer and biomarker reporting. The Pathology Electronic Reporting Template Standardization Project workgroup made suggestions for standardizing sections of the CAP electronic Cancer Checklists (eCC).

TECHNOLOGY

Issues regarding template standardization were captured from eCC end users using custom Project Tracker software. The eCC Template Editor was used for visual content modeling of question and answer sets, with models and metadata stored in a SQL Server database. A custom .NET tool was used with code generation software to generate an eCC schema-compatible C# object model to serialize the database records into the eCC XML format. Additional XSLT programs were used to transform the XML files into eCC HTML files suitable for Template Standardization Project review.

DESIGN

The Template Standardization Project team worked with Cancer Committee authors to arrange questions and sections to fit common pathologist workflows for data entry and reporting. The workgroup reviewed eCC HTML output of many modeling options and reached consensus on template standards.

RESULTS

A standardized eCC base template was created for consistent modeling. Tumor site, histological type, grade, size, extent and accessory tumor findings were consolidated in nested sections under a single “TUMOR” header to improve workflow and combine data elements related to pT classification. The “MARGINS” section was modified to improve workflow when reporting tumor distance from closest margins and non-invasive histologic types present at margins. The “LYMPH NODES” section was standardized for reporting laterality, nodal stations and sentinel nodes. Immunohistochemical and biomarker data elements were moved into separate biomarker templates. Finally, new metadata attributes were added to the eCC database and XML templates to facilitate known problem areas such as textual changes needed for synoptic reporting and reporting rules.

CONCLUSIONS

The Template Standardization Project has improved modeling of electronic cancer and biomarker data entry forms to better fit the pathologist workflow and reporting needs.

J Pathol Inform. 2016 Jul 28;7:33.

Selection of a Laboratory Information System for the Molecular Pathology Laboratory: Unique Aspects and Key Decision Factors


Roy E. Lee1, Walter H. Henricks1

1Cleveland Clinic Foundation, Pathology and Laboratory Medicine Institute, Cleveland, OH, USA. E-mail: leer3@ccf.org

CONTENT

Many molecular laboratories rely on paper forms and spreadsheets for information management, instead of information systems such as for anatomic/clinical pathology. Functional requirements for a molecular laboratory's information system (LIS) are not adequately addressed by information systems designed for the clinical laboratory or anatomic pathology. This is due to unique aspects of molecular diagnostics such as data models specific to molecular testing, varied testing workflows involving multi-step method protocols, and complexities of molecular reporting. This study reports a structured approach for evaluating and selecting a molecular LIS solution, and identifying key decision factors.

TECHNOLOGY

Word processor and spreadsheet programs (Word and Excel, Redmond, WA).

DESIGN

A multi-step approach was designed, including 1) complete inventory of current information management practices in the molecular laboratory, 2) definition of key functional requirements and priorities for a laboratory information system, 3) development and distribution of RFP, and 4) evaluation of vendor responses and system demonstration visits.

RESULTS

A comprehensive document was generated that catalogued all information practices in the laboratory, compiling examples of paper forms, spreadsheets, and other laboratory information practices. This document laid the foundation for further system evaluation, including gap analysis, RFP development, and demonstration playscripts. In addition to assessing best fit for workflow/operations support, this approach yielded several key decision factors crucial to selection:

  • Clear definition of scope – for example, initial de-emphasis on next generation sequencing tests

  • Compatibility with preanalytic processes such as specimen identification/tracking

  • Interoperability with other IT systems

  • Testing procedures defined in system by laboratory users, not LIS managers or vendor

  • Commitment by vendor to develop novel interfaces between LIS and molecular instrumentation.

Input and buy-in from laboratory technologists and technicians in a discipline where paper and spreadsheets are the standard methods.

CONCLUSIONS

Initial creation of a comprehensive inventory of information management practices was a key success factor in laying down the foundation for molecular LIS selection. The most significant considerations identified were compatibility with existing preanalytic processes in the laboratory and interoperability with other systems. Understanding the unique considerations and needs in selecting a molecular LIS can be facilitated through this structured approach.

J Pathol Inform. 2016 Jul 28;7:33.

Computational Models of Oncogenic Networks: A Potential Tool for Computational Pathology


Edward C. Stites1

1Department of Pathology and Immunology, Washington University in St. Louis, St. Louis, MO, USA. E-mail: estites@path.wustl.edu

CONTENT

Although cancer genomics has identified the commonly mutated cancer driver genes, clinical cancer genomics struggles to deal with all of the different mutants that can be found within a given gene. Few have been sufficiently well studied to be more than a VUS – variant of uncertain significance. There is evidence that all hotspot mutations are not equivalent, which suggests that the set of “VNS” –variants of known significance – may be even smaller than has been assumed. Informatics approaches are needed that can better explain and predict mutant specific behaviors. This abstract focuses on a computational model of oncogene signaling with demonstrated an ability to make mutant-specific predictions.

TECHNOLOGY

A computational model of Ras signaling was developed that is based upon mass-action kinetics, ordinary differential equations, and existing knowledge of the Ras pathway. The model makes mutant-specific predictions by incorporating biochemical rate constants for specific oncogenic Ras mutants and their interactions with regulatory proteins. The model has been developed, simulated, and analyzed in MATLAB. The model includes twelve oncogenic mutants and ten Ras mutants found in Noonan syndrome.

DESIGN

The model was then applied to problems where different mutants to the same KRAS gene have been observed to have different biological and clinical phenotypes. The model was then used to investigate whether the model could predict these differences and to investigate what the key parameters were that could explain the different behaviors.

RESULTS

The model successfully distinguishes between oncogenic and non-oncogenic mutants. The model suggests that mutant strength is relative, which suggests that knowledge learned about specific Ras mutants in one type of cancer may not apply to other cancers. The model also reveals that an unexplained KRAS response to targeted therapies is actually consistent with known information about Ras signaling; this logical conclusion was not apparent without our computational model.

CONCLUSION

Mass-action based models of disease promoting variants have the ability to relate biochemical data that describe distinct mutants to phenotypes important to clinical medicine. Models like that that incorporate a mechanistic understanding of biological processes should play an increasing role in Computational Pathology.

J Pathol Inform. 2016 Jul 28;7:33.

Comparison of Applied Machine Learning Tools for the Prediction of Myelodysplastic Syndromes Using Complete Blood Count Parameters


Amrom E. Obstfeld1, Philipp W. Raess2, Stephen R. Master3, Adam Bagg1

1Department Pathology and Laboratory Medicine, School of Medicine, University of Pennsylvania, Philadelphia, PA, 2Department of Pathology, Oregon Health and Science University, Portland, OR, 3Department Pathology and Laboratory Medicine, Weill Cornell Medical College, New York, USA. E-mail: obstfelda@email.chop.edu

CONTENT

Patients with myelodysplastic syndromes (MDS) frequently present with cytopenias of uncertain etiology. A gap in their care may reside in the decision as to when the suspicion for MDS is sufficient to warrant a bone marrow biopsy. The aim of this study was to compare the performance of several machine learning tools in the prediction of the presence of MDS using cell population data parameters from an automated complete blood count (CBC) analyzer as predictors.

TECHNOLOGY

Cell population data was collected from a Beckman Coulter LH780 analyzer. The randomForest, rpart, ada, nnet, kernlab, and bartmachine packages were used to generate 7 different models within the R statistical program. Using the ROSE package, an additional 6 models were generated using these packages after compensating for imbalance in the dataset.

DESIGN

CBC data from outpatients were collected and patients with MDS were identified by screening the electronic medical record for patients with an ICD-9 code corresponding to MDS; MDS was confirmed by review of clinical data. CBCs were randomized into independent, training and test sets. The training set consisted of 39 CBCs from patients with MDS and 3,294 CBCs from controls, and the test set consisted of 20 CBCs from patients with MDS and 1,686 CBCs from controls.

RESULTS

Classifiers were compared on the basis of routine assay performance criteria; results are presented in Figure 1. As would be expected given the heavily imbalanced training set, several of the models failed to predict any cases of MDS in the test set, resulting in sensitivities of 0% and specificities of 100%. Much of these shortcomings were overcome by random over-sampling the cases of MDS in the training set, however this came at the expense of a decrease in specificity. The best performing classifiers for the purpose of screening a general outpatient population for MDS were the generalized linear model, random forest classifier, and the neural network after random over-sampling.

Figure 1.

Figure 1

Performance characteristics for seven model without (top) and with (bottom) random over-sampling

CONCLUSION

Our data highlight the differences in accuracy of commonly used machine learning techniques in a specific use case. Future work will investigate the utility of these techniques in other populations at risk for MDS.

J Pathol Inform. 2016 Jul 28;7:33.

Computational Pathology Framework for Segmenting and Classifying Clinically Relevant Regions of Interest in Whole Slide Images of Breast Tissues


Luong Nguyen1, Akif Burak Tosun1, Adrian V. Lee1, D. Lansing Taylor1, Jeffrey L. Fine1, Chakra Chennubhotla1

1Computational and Systems Biology, University of Pittsburgh, Pittsburgh, PA, USA. E-mail: lun5@pitt.edu

CONTENT

The current manual practice of pathology is time consuming, error-prone, and subjective. Computational pathology with advanced image analysis is crucial to increasing the productivity of pathologists and improving the accuracy of cancer diagnoses. We propose a comprehensive computational framework for identifying and characterizing various regions of interest (ROIs) in breast biopsies, to help pathologists quickly navigate whole slide images (WSIs). We parse WSIs of H&E stained breast tissues into ROIs, characterize the ROIs with spatial image statistics, then rank them based on their clinical relevance into distinctive phenotypes: invasive cancer, carcinoma in situ, atypia, and normal.

TECHNOLOGY

Breast tissue slides were scanned into WSIs at 0.5um/pixel resolution, then viewed with provided software (Aperio XT, Leica, Vista CA USA). Ground truth data for ROIs was collected with Prospector (PMC4466790).

DESIGN

Our dataset includes 30 WSIs of breast tissues from TCGA. First, color normalization is done on WSIs to alleviate effects of stain variability on tissue appearance. Second, superpixels in purple (nuclei), pink (stroma), and white (lumen, fat, tissue tears) channels are generated on the color normalized images. Third, coarse-grained ROIs are proposed using context and distance distributions of superpixels in all three channels. Fourth, the ROIs’ boundaries are further refined using a state of the art spatial statistics based segmentation algorithm. Finally, spatial statistics from each ROI are used to rank them from the most suspicious (invasive cancer) to the least (normal tissue).

RESULTS

Figure 1 top row shows the computational framework proposed here, while the bottom row provides more details on the specific modules within our framework. The framework is highly accurate in segmenting and classifying ROIs in breast tissue images with segmentation scores on par with state of the art algorithms and a classification accuracy averaging at 77%.

Figure 1.

Figure 1

Computational pathology framework for navigating whole slide images of breast tissue with clinically relevant regions of interest

CONCLUSION

Our paper shows an end-to-end framework for navigating whole slide breast tissue landscapes using ROIs as tissue landmarks. In the future, we will incorporate an active learning strategy that seeks feedback from pathologists to further customize and improve the accuracy of the computational pathology pipeline. Not only will such work lead to computer-assisted pathology signout, it will continually improve based on prior experience.

J Pathol Inform. 2016 Jul 28;7:33.

Extracting Context-aware Diagnostically Relevant Patterns from H&E Stained Lung Tissue Images


Akif Burak Tosun1, Chakra Chennubhotla1

1Department of Computational and Systems Biology, University of Pittsburgh, Pittsburgh, PA, USA. E-mail: tosun@pitt.edu

CONTENT

With digital pathology rapidly evolving, image analysis tools have become inevitable for facilitating the needs of current pathology workflow; e.g. decreasing the workload from normal gestalt, easy handling of huge image repositories like TCGA, assisting on diagnostic decisions. In this study, we present an image analysis algorithm to detect structural patterns in whole slide images (WSIs) using context-aware features extracted from representative tissue components. Specifically, we worked on tissue images of Lung Adenocarcinoma (LUAD) and Lung Squamous Cell Carcinoma (LUSC), which are the most common types of lung cancers. Since these two cancer subtypes have different prognosis and treatment directions, it's crucial to differentiate between them.

TECHNOLOGY

Phenotypical structural patterns were extracted from H&E stained WSIs of 156 LUAD and 188 LUSC patient cohorts from TCGA. The Pittsburgh Supercomputing resources have been extensively used to process WSIs. The average processing time for a single WSI image, roughly of size 15 K × 15 K, is about 15 minutes.

DESIGN

We first generate structural elements that roughly correspond to tissue components, nuclei, stroma and lumen regions, of the WSI [Figure 1a]. Next, we encode spatial context of the tissue image by building co-occurrence matrices around each tissue component. Finally, we cluster the co-occurrence matrices into a small number of phenotypical spatial patterns (~10). We report the total tissue area occupied by each of the structural pattern as a feature vector for any given WSI.

Figure 1.

Figure 1

Extracting context-aware diagnostically relevant patterns from H&E stained lung tissue images (a) tissue components in the form of nuclei, stroma and lumen are spatially connected as nodes in a graph over the WSI. (b) Relative distribution of context-aware phenotypical spatial patterns, (c) two examples of which are shown outlined in black and yellow boxes. Their spatial distribution on the WSI can discriminate LUAD from LUSC

RESULTS

Figure 1b shows how encoding for spatial context enhances the differences between LUAD and LUSC. The spatial spread of the phenotypical structural patterns changes dramatically between LUAD and LUSC, as seen in the example prototypes of Figure 1c.

CONCLUSIONS

Our experiments prove the existence of context-aware diagnostically relevant image phenotypes that can discriminate the two types of lung cancers, LUAD and LUSC. For future work, we will build a more discriminative framework for associating tissue phenotypes to genomic signatures that are readily available in TCGA. In parallel, we will also expand our algorithm to encode global or long-range spatial dependencies by building hierarchical Markov random fields.

J Pathol Inform. 2016 Jul 28;7:33.

Morphologic Profiling Of Erythrocytes Using Deep Convolutional Neural Networks


Thomas J. S. Durant1, Eben M. Olson1, Richard Torres1

1Department of Laboratory Medicine, Yale School of Medicine, New Haven, CT 06520, USA. E-mail: thomas.durant@yale.edu

CONTENT

Morphologic examination of peripheral blood smears remains a vital component of diagnosis in a large percentage of patients. Advancements in the field of automated object recognition have motivated the development of automated morphologic profiling of erythrocytes using machine learning-driven image classification. Most recently, convolutional neural networks (CNNs) has emerged as a superior machine learning technique for complex image recognition. Thus, we sought to evaluate the performance of this powerful approach when applied to classification of erythrocyte morphology profiles from peripheral blood smear images.

TECHNOLOGY

Unlabeled images used for our training dataset were obtained using the CellaVision® DM96 platform slide scanner. Erythrocytes were assigned labels using an in-house developed web-application, with functionality dedicated to individual cell label assignment. The machine learning algorithm was based on a deep CNN architecture, which was implemented in Python 2.7. Computation was performed on a Linux environment using a standard high performance computer with programmable graphics card.

DESIGN

A limited label set was used for this initial study which included normal, echinocyte, and schistocyte. Classification of individual erythrocytes was done by a lab medicine resident and a hematopathologist. During the labeling process, cells which had already been shown to the user were randomly re-shown to capture intra-rater reliability. A subset of classified cells were then utilized as a training set for the CNN. A second ‘naïve’ test set of manually classified cells was also evaluated by the CNN and discrimination accuracy was calculated relative to manual classification.

RESULTS

The final training database was comprised of 2407 labeled erythrocyte images. The naïve dataset used to test accuracy was comprised of 495 cells. Inter-rater agreement demonstrated simple concordance of 95%, and a kappa concordance of 79% (71% to 87%; CI 95%) [Table 1]. Sensitivity for automated detection of schistocytes and echinocytes was 83% and 91% respectively, while specificity was 99% and 96% respectively.

Table 1.

Confusion matrix-manual analysis and automatic analysis erythrocyte morphologic classification

graphic file with name JPI-7-33-g004.jpg

CONCLUSION

Findings on this limited analysis suggest CNN performance for erythrocyte classification compares favorably to intra-human classification accuracy and demonstrate potential for improved specificity relative other machine learning algorithms based on available published data. Future work using CNNs on expanded datasets with diversified erythrocyte classifications is warranted.

J Pathol Inform. 2016 Jul 28;7:33.

The Putative Role of MALDI-MSI in the Study of Membranous Glomerulonephritis


Vincenzo L’Imperio1, Fulvio Magni1, Andrew Smith1, Franco Ferrario1, Elena Ajello1, Fabio Pagni1

1Center of Nephropathology, San Gerardo Hospital, Monza, Italy. E-mail: v.limperio@campus.unimib.it

CONTENT

Membranous Nephropathy (MN) can be idiopathic (iMN) or manifests as a result of systemic underlying conditions as a secondary epiphenomenon. For the prognostic and predictive consequences of this discrimination is crucial the discovery and development of reliable markers useful to assess these cases. The employment of proteomics and bioinformatics techniques directly on affected renal tissue can be helpful for these purposes, allowing the identification of new candidate biomarker for this disease.

TECHNOLOGY

MALDI-MSI, ScanScope CS digital scanner and various bioinformatics tools (SCiLS Lab 2014, FlexAnalysis 3.4, FlexImaging 3.0) will be employed in an integrative fashion to extract morpho-proteomic informations directly from formalin fixed paraffin embedded (FFPE) tissue of the renal biopsies of patients affected by MN.

DESIGN

For each patient, two 4 μm thick sections will be cut from a MN renal biopsy and thaw-mounted on the same conductive Indium Tin Oxide (ITO) glass slide (Bruker Daltonik GmbH, Germany). After the preparation of sample, slides will be analysed in linear positive mode in the mass range of 3000 to 20000 m/z using an UltrafleXtreme (Bruker Daltonik GmbH) MALDI-TOF/TOF MS equipped with a Smartbeam laser operating at 2 kHz frequency. Resulting spectra information will be compared and localized on the virtual slide obtained after staining each biopsy with Trichrome and scanning them through ScanScope CS digital scanner (Aperio, Park Center Dr., Vista, CA, USA). Then, FlexImaging 3.0 (Bruker Daltonics, Bremen, Germany) data, containing spectra of each entire measurement region, will be imported into SCiLS Lab 2014 software (http://scils.de/; Bremen, Germany) after the acquisition. SCiLS will be used to perform a series of pre-processing steps on the loaded spectra: baseline subtraction (TopHat algorithm) and normalisation (total ion current algorithm). A series of further steps will be performed in order to generate an average (avg.) spectrum representative of the whole measurement region and of the primary GN sub-classes: peak picking (orthogonal matching pursuit algorithm), peak alignment (to align the detected ions with peak maxima) and spatial denoising (http://scils.de/; SCiLS Lab; 8.8 Spatial Denoising). Principal Component Analysis (PCA) will be also performed to reduce the high complexity of the data. Finally, Receiver Operative Characteristic (ROC) analysis will be performed, with an AUC of >0.8 being required, as an additional criteria to the p < 0.05, for a peak to be considered as statistically significant. For MALDI-MS/MS spectra, baseline subtraction and smoothing will be performed using FlexAnalysis3.4 (Bruker Daltonics, Bremen, Germany). All MS/MS spectra will be searched against the Swiss-Prot database (Release 2015_05 of 29-Apr-15) with the Mascot 2.4 search engine (Matrix Science, London, UK).

RESULTS

Applying the described study design, that already allowed us the identification of alpha-1-antitrypsin as a candidate biomarker responsible for the sclerosis deposition in many glomerulopathies (Smith et al, Proteomics. 2016 Jan 7), we will analyze 30 cases of MN (15 idiopathic and 15 secondary forms) with the aim of determine differences among primary and secondary forms in terms of type and distribution of protein expression spectra and, eventually, identify a candidate biomarker able to distinguish these two forms.

CONCLUSION

The employment of MALDI imaging technique directly on FFPE tissue specimens (a reliable substrate in a clinical setting) combined with the application of particular bioinformatics tools (SCiLS Lab 2014, FlexAnalysis3.4, FlexImaging 3.0) can allow the identification of candidate biomarkers for diagnostic and prognostic purposes in patients affected by MN.

J Pathol Inform. 2016 Jul 28;7:33.

Benchmarking Utilization with Population Prevalence Data: A Novel Use of National Census Data


Joseph Rudolf1,2, Kristi Smock3,4, Brian Jackson3,4, Robert Schmidt3,4

1Departments of Pathology, Massachusetts General Hospital, 2Harvard Medical School, Boston, MA, 3Department of Pathology, School of Medicine, University of Utah, 4ARUP Laboratories, Salt Lake City, UT, USA.

E-mail: jrudolf1@partners.org

CONTENT

Benchmarking is a useful tool for comparing provider or institution variation to that of a peer group, and can aid in identifying targets for laboratory utilization management. Some underlying level of variation is expected based on site or practice intrinsic factors including the population prevalence of a disease, and may require normalization for the interpretation of benchmarking results. This may be especially true for molecular assays where gene prevalence may be a significant driver of the positivity rate, and thus influence the yield of a given test. We sought to incorporate tailored population prevalence data to aid in a molecular test benchmarking initiative.

TECHNOLOGY

Millenium LIS (Cerner, North Kansas City, MO, US). Anaconda 3.5.1 (Continuum Analytics, Austin, TX, US). Microsoft Excel 2007 (Microsoft, Redmond, WA, US).

DESIGN

De-identified results were obtained for two common molecular tests, Factor V Leiden (FVL) and Prothrombin gene mutation (PTGM), performed at a national reference laboratory. Test positivity rates were calculated for a selection of clients ordering more than 50 of the test of interest during the study period. Predictions for FVL and PTGM client prevalence rates were made by incorporating 2010 national census ethnicity data, based on the location (county level) of the client, using published gene prevalence observations by ethnicity. Prevalence predictions were merged with client positivity rates and other client level information including facility type and size.

RESULTS

The final data set included data from over 100 different institutions with more than 25,000 results spanning 22 months for FVL and more than 40,000 results spanning 48 months for PTGM. The overall positivity rate was 11% for FVL and 5% for PTGM. Significant variation was observed between client positivity rates following normalization for client location predicted population prevalence as seen in Figure 1.

Figure 1.

Figure 1

Factor V leiden positivity rates normalized for predicted population prevalence

CONCLUSION

Normalization for intrinsic site or practice factors is necessary for the interpretation of a benchmarking analysis. Incorporation of national population data can aid in laboratory ordering pattern normalization and helps to highlight underlying utilization variation. We plan to incorporate other client factors in our model to further explain residual sources of variation and identify targets for utilization management.

J Pathol Inform. 2016 Jul 28;7:33.

Enhancing Lupus Anticoagulant Reporting Workflow using Python


Ernest Chan1, Charles Van Slambrouck1, Jonathan L. Miller1, David S. McClintock1

1Department of Pathology, University of Chicago, Chicago, IL, USA.

E-mail: ernest.chan@uchospitals.edu

CONTENT

Comprehensive lupus anticoagulant testing involves multiple test platforms, phases and outcomes, with diagnosis of a lupus anticoagulant requiring interpretation of laboratory results in the context of the patient's clinical history and recent medications. This complexity makes reporting standardization a challenge. Our objective was to create an automation tool that analyzes test data and makes logical deductions to suggest appropriate interpretive statements, thus aiding the pathologist in final interpretation and reporting.

TECHNOLOGY

Python 2.7.10 with packages xlrd 0.9.3, unidecode 0.4.18, python-docx 0.8.5.

DESIGN

In our clinical coagulation laboratory, technologists input each patient's test results into an excel spreadsheet. A series of python scripts were developed to read the data in the excel spreadsheet and generate a preliminary text report as a word file. The clinical pathologist then reviews and modifies this report as appropriate based on the both the laboratory data and clinical information for each case.

RESULTS

This program was well-received and rapidly adopted by clinical pathologists due to its ease of use, increased time-efficiency, and error reduction. Feedback showed the program was easy to use (average 4.6 of 5, with 5 being very easy to use), with all users noting either no change (40%) or an improvement (60%) in the quality of the reports. Further, users reported time savings ranging from 4 minutes (14.3%) to 10 minutes or more (57.1%) per report. Finally, this program enabled a successful transition to a paperless workflow in the coagulation laboratory for all lupus anticoagulant testing.

CONCLUSION

The development of automation tools to assist pathologists in their routine clinical work can result in more standardized reporting and significant time savings. These improvements allow pathologists to focus attention on the interpretation and correlation with clinical findings. Given this project's success, similar design concepts based in Excel and Python could be applied to other areas of the clinical laboratory.

J Pathol Inform. 2016 Jul 28;7:33.

Laboratory Websites Portals as Pathology Educational Resources: The Concept of Combining Apples and Oranges with other Fruits


Izak Dimenstein1

1Department of Pathology, Loyola University Chicago Medical Center (Ret.), Chicago, IL, USA. E-mail: idimenstein@hotmail.com

CONTENT

The apparent solution for utilization dispersed on the internet laboratory pathology websites would be to combine them in specialized portals. Their development depends on three essential conditions: an appropriate institution to handle the design and maintenance, a coordinating organization such as a professional society, and reliable financial support.

TECHNOLOGY

Software platforms, like Word Press, make the site dynamic and manageable by nonprofessionals in computer science. However, aggregating the websites in a portal requires professional approach. The main challenges are the differences between composition and software platforms of the aggregated websites.

DESIGN

The goal of design is that on entering the laboratory website portal's forest, the user would find a particular mushroom under a specific tree. Providing connections between the different websites would thus enable the user to access the technical details of procedures. Resembling portal vein and portacaval anastomoses systems, the “portal hypertension” allows the user to obtain in “anastomoses” specific information without surfing through archives. While following the hierarchical organization of the website's pages, the portal building framework includes reasonable content fragmentation in the presentation of the material (“nested doll principle”).

RESULTS

A laboratory portal predominately aggregates authority websites with a certain “niche of knowledge.” Apart from the informative content, which is paramount, the authority site follows a certain set of specific search engine work rules for maximal visibility and sustainability on the Internet. The daily statistic chart provides important information about the topics in which the visitors are interested. Our educational “Grossing Technology in Surgical Pathology” (grossing-technology. com) website, which is more than decade old with an average of 100K views per year, is an example of maintaining an authority website. The website's composition, which contains basic contents, a blog, and an ancillary part, has proven optimal. The ancillary part includes also a mutually beneficial presence of the manufacturers. The website can serve as a framework for an aggregated educational pathology laboratory portal.

CONCLUSION

Laboratory specialized portals are an untapped resources for pathology informatics. An educational methodological pathology laboratory portal can be one of these resources. A sustainable authority website is the cornerstone of the portal's development.

J Pathol Inform. 2016 Jul 28;7:33.

Straddling the Clinical and Anatomic Pathology Divide, The UCLA Molecular Diagnostic Laboratory's Experience Transitioning to the AP and CP Epic 2014 Beaker Module


Valerie A. Arboleda1, Cora Au1, Ameer Helmi2, Samuel Strom1, Kingshuk Das1

1Department of Pathology and Laboratory Medicine, David Geffen School of Medicine, UCLA, Los Angeles, CA, 2Boost Services, EPIC Systems, Verona, WI, USA. E-mail: varboleda@mednet.ucla.edu

CONTENT

We will describe the experiences of the UCLA Molecular Diagnostics Laboratories (MDL) in transitioning to Epic's modules of AP and CP Beaker.

TECHNOLOGY

In March 2016, the UCLA Pathology will transition from PowerPath in anatomic pathology and MEDITECH in the lab, to the AP and CP Beaker Modules from Epic, respectively.

DESIGN

This is a descriptive study, systematically assessing our approach towards the Epic AP and CP beaker build that took place between August 2015 and March 2016. We will assess the effect of AP and CP Beaker in build decisions, workflow and reporting within MDL.

RESULTS

In our experience, molecular diagnostic tests with a limited set of reportable analytes (e.g., Factor V and cystic fibrosis genotyping panels) can be readily reported using CP Beaker. We built this subset of high-volume and “simple” tests within CP Beaker to take advantage of batch reporting. AP Beaker is used for the remaining higher complexity tests, including all tissue-based tests. In-depth integration of test orders and reports is performed through electronic linking by specimen. Tissue-based workflows in MDL will change significantly. Ordering cancer sequencing tests in Beaker is a two-step process, as Beaker 2014 is unable to reliably auto-link physician orders with histology notification for slide recuts. First, the order must be placed electronically by a pathologist/treating physician. MDL receives this order in a shared inbox and must then add notifications for histology to cut slides manually. Once slides are received MDL will create a case for tracking. MDL is thus notified for every tissue-based test upon ordering, allowing us to screen for ordering errors. For reporting, we have divided complicated reports into discrete fields. This provides a significant upgrade from purely unstructured text and will enable future automated disease-specific snapshots for the treating physician.

CONCLUSIONS

The full extent of the consequences of our decisions will become evident after go-live. While the 2014 Beaker modules do not address the full range of needs of a molecular pathology laboratory, we anticipate improvements to specimen tracking, workflow, and aspects of reporting.

J Pathol Inform. 2016 Jul 28;7:33.

Implementation of User-tailored Data Analytics in a Complex Laboratory Setting


Walter H. Henricks1, Kim Asamoto1, Thomas Shirk1, Kavous Roumina1

1Cleveland Clinic, Pathology and Laboratory Medicine Institute, Cleveland, OH, USA. E-mail: henricw@ccf.org

CONTENT

Laboratories have needs for data analysis for activities like quality management, tracking key performance indicators, monitoring operations, and strategic planning. Laboratory information systems (LISs) may not provide analytical capabilities that meet such needs. Also, being able to combine data from multiple sources can be valuable. This project implemented a system that provides “analytics”, or business intelligence, to meet data analysis needs in a complex laboratory environment.

TECHNOLOGY

Kofax Insight business intelligence system (Irvine, CA), CoPath LIS (Cerner, Kansas City, MO), Sunquest Laboratory LIS (Tucson, AZ), MS SQL Server 2008 and Excel 2010 (Microsoft, Redmond, WA).

DESIGN

Functional requirements were determined, with input from departmental end-users. Required data elements were identified in LISs and other sources. Insight tools were used to establish content and timing of data extracts from source systems, with organization into a secondary database. Configurable data displays including dashboards, charts, tables, and calculations were created in Insight based on this database. End-users with domain expertise validated each new data report and dashboard for accuracy prior to its deployment.

RESULTS

Currently 103 dashboards have been deployed. Throughout the laboratories, there are 177 active dashboard users. Eight dashboards combined data from more than one source. Frequency of scheduled data pulls from source systems ranges from minutes to weeks. Applications of dashboards have included data visualization and presentation for daily team huddles, clinical and business metric reviews, critical value report monitoring, dynamic pending logs, and utilization reviews. Data from Insight have replaced the LIS for 58% (34/59) of ad hoc data search requests (July-December 2015). Laboratory end-users are empowered to perform their own analyses. User acceptance was initially slow but escalated as the usefulness of the system has been realized. Because the system is highly configurable, the learning curve was significant, including for system analysts.

CONCLUSIONS

A configurable data analytics system can be implemented in a complex laboratory environment and provide substantial value to the laboratory through use of flexible tools for data analysis, presentation, and visualization. Success factors for implementation included commitment through a learning curve, attention to data validation, and tailoring to end-user needs.

J Pathol Inform. 2016 Jul 28;7:33.

Comparison of LOINC Codes for Commonly Ordered Lab Tests Provided by Different Medical Centers


Navid Farahani1, Tony Gigliotti2, Walter H. Henricks3, Michael Riben4, Douglas Hartman1, Liron Pantanowitz1

1Department of Pathology, University of Pittsburgh School of Medicine, 2Information Services Division, University of Pittsburgh Medical Center, Pittsburgh, Pennsylvania, 3Cleveland Clinic, Pathology and Laboratory Medicine Institute, Cleveland, OH, 4Department of Pathology and Laboratory Medicine, The University of Texas MD Anderson Cancer Center, Houston, TX, USA. E-mail: nfarahan@gmail.com

CONTENT

Standard codes for clinical measurements are essential for optimal exchange of health information. Logical Observation Identifiers Names and Codes (LOINC) is a universal method of normalizing, identifying, and reporting medical laboratory observations. In the USA, the Office of the National Coordinator have chosen LOINC coding as a standard to support healthcare data exchange and interoperability. To the best of our knowledge, a comprehensive analysis of LOINC between disparate health systems has not been undertaken. Therefore, we sought to evaluate the accuracy of LOINC codes assigned to commonly ordered lab tests at three distinct healthcare systems.

TECHNOLOGY

Excel spreadsheets (Microsoft).

DESIGN

Three large tertiary academic medical centers (University of Pittsburgh Medical Center, Cleveland Clinic, MD Anderson Cancer Center) participated. The 300 most commonly ordered clinical lab tests (chemistry, hematology, immunology) at one of the institutions were retrieved from their laboratory information system. Only 249 of these tests were compared, because not all centers offered exactly the same tests (especially for point of care testing). Excel spreadsheets were used to enter and analyze codes to determine universal matching (agreement between all 3 sites), partial matching (agreement between any 2 sites), and if there was no matching (no agreement between sites).

RESULTS

LOINC codes provided showed that there was 44% universal and 30% partial matching of lab tests. For 26% of the lab tests there was zero matching among centers that included hematology (36%), chemistry (35%), urinalysis (12%), immunology (8%) and point of care (7%) tests.

CONCLUSION

These data show that there was absolute concordance among all three healthcare systems for only 44% of LOINC codes. Reasons for discrepant LOINC coding need to be determined, but may have been limited by providing only the component and property database axes of test descriptors. Given the high discordance of LOINC coding that may occur among different pathology laboratories, additional measures (e.g., external quality control checks) may be necessary before these codes can be reliably used to support interoperability between healthcare systems.

J Pathol Inform. 2016 Jul 28;7:33.

HCV Genie V 2.0: A Web Platform for the Versant Hepatitis C Virus Genotype Line Probe Assay


Alex Dussaq1, Abha Soni1, Seung L. Park2, Shuko Harada1

1Department of Pathology, University of Alabama at Birmingham, 2Department of Pathology, Division of Informatics, University of Alabama at Birmingham, Birmingham, AL, USA. E-mail: adussaq@uab.edu

CONTENT

Hepatitis C virus (HCV) genotyping at our institution is performed using the Versant Hepatitis C virus genotype 2.0 Line Probe Assay (LiPA). The last steps of this procedure are a manual, time-consuming, error prone process that involves the identification of bands and comparison of each test strip to a physical reference table. A resident had developed an HCV genotype interpretation platform that identifies the strain of HCV based on the banding. However, identifying bands on the strip was done manually. This study serves as a follow-up with an MD/PhD student porting this system to an open web environment and adding an analytical step utilizing a scanned LiPA image to generate the genotyping results.

TECHNOLOGY

Web Server: Github gh-pages; Programming Language(s): JavaScript, HTML5, CSS; User Interface Framework: Bootstrap 3.3.

DESIGN

The student (a) ported the original, clinically validated, HCV genotype interpretation program, “HCV Genie,” from an SQL database to JSON object, (b) created image analysis algorithms that convert LiPA images into band and genotype calls, and (c) built a user interface to utilize these tools. Client side JavaScript allows the analysis to be performed without any data leaving the investigator's computer. Additionally, results of the analysis are downloadable as a printable report.

RESULTS

The original HCV Genie was written, deployed, clinically validated, and proven to be identical to human expert interpretation (n = 200). It decreased the time needed to interpret results by 53% for residents, but results among experienced lab technicians were more equivocal. Since the most time-consuming part is to identify each band on the strip, HCV-Genie 2 allows us to further minimize analysis time and eliminate errors, thereby, increasing the quality of patient care. Available at: hcvGenie.com.

CONCLUSION

This iteration of HCV Genie focused on developing lane and band detection algorithms, and creating a publically available tool that eliminates data privacy concerns. Future iterations of this program will focus on allowing users to store and aggregate results in a database of their choosing, allowing for advanced data analytics of HCV genotypes.

J Pathol Inform. 2016 Jul 28;7:33.

Clinical Lab Manager System V1.0 – A Web-based Application to Manage All Workflow in Genomic Pathology Laboratories with Interactivity with Beaker and I2B2


Chirayu Pankaj Goswami1, Erica Johnson1, David Corney1, Stephen Peiper1, Zi-Xuan Wang1

1Department of Pathology, Molecular and Genomic Pathology Laboratory, Thomas Jefferson University Hospitals, Philadelphia, PA, USA.

E-mail: chirayu.goswami@jefferson.edu

CONTENT

The power of genomic analysis is matched by the challenge of maintaining quality at each step of the process. Complex assays such as next generation sequencing have many procedural steps and are performed at multiple work stations, often by multiple technologists. Management of quality is dependent upon the traceability of the progression of a specimen throughout the process, a capability that is not available through commercial laboratory information systems (LIS). Many laboratories employ the work around of using multiple spreadsheets that lack real-time traceability and status update. The Clinical Lab Manager System V1.0 (CLMS) is a web-based application that was created to provide continuous access for documenting and reviewing status of diagnostic specimens through all phases. CLMS has been used in our Molecular & Genomic Pathology Laboratory since 2015. It extracts sample accessioning information from the CoPath LIS and tracks all steps of all processes, such as DNA concentration, quality, and QC data for library preparation of next generation sequencing assay and final results review.

TECHNOLOGY

CLMS is a web application created using PHP with a MySQL database backend utilizing R and javascript for various functionalities.

DESIGN

CLMS stores information in MySQL relational database. Front end forms are created in PHP and HTML. Order and result information can be communicated to Beaker via cloverleaf engine.

RESULTS

CLMS manages:

  • Specimen information including demographics, diagnoses, specimen type for all current and archived specimens in a single database with interactive front-end

  • Assay workflows, by calculating reagent requirements based on specimen number in real-time

  • Final result review and storage in the CLMS data base

  • Archival of de-identified results in the I2B2 translational research database.

CONCLUSIONS

CLMS has created a single portal for managing all operational steps with the capability to generate statistics for assay volumes and turn around times, as well as results. It has eliminated many spreadsheets and provided a “modern” working environment, resulting in increased operational efficiency. Bi-directional connectivity to EPIC Beaker has been established, which enables management of all intra-laboratory steps in CLMS and creation of orders and report resulting in Beaker when EPIC goes live in Jefferson Health System.

J Pathol Inform. 2016 Jul 28;7:33.

Fetal Autopsy Report Automation with Microsoft Excel and Word


Keluo Yao1, Alexander Fitzthum1, C. Eric Freitag1, Kaila Buckley1, Jesus Chavez1, Cassandra Heller2, Ian Talbott1, Anil Parwani1, Patricia Allenby1

1Department of Pathology, The Ohio State University, 2Department of Family Medicine, Mount Carmel Health System, Columbus, OH, USA. E-mail: keluo.yao@osumc.edu

CONTENT

Fetal autopsy reports are complex documents which record gross, histologic, and ancillary findings. Body and organ measurements are compared with gestational age and birth status dependent normal reference ranges. Traditional manual writing is notoriously error prone and time consuming, and few attempts have been made to improve it. The aim of this project was to design and validate an automated system for producing fetal autopsy reports using advanced programming functions available in Microsoft Excel and Word.

TECHNOLOGY

An excel spreadsheet fetal autopsy template was created using Microsoft (Redmond, WA) Excel and Word on a PC running Microsoft Windows 7 professional. We extracted all reference values from Potter's Pathology of the Fetus, 2007 and structured the data to allow automatic population of values using lookup and reference functions. Categorical values were set-up as drop down menus or check boxes with Boolean functions. Gross findings were presented as a list of unselected check boxes by default, along with individual text fields where alternative abnormal findings could be reported. Numerical values such as weight, length and body fluids were placed adjacent to normal reference ranges. All input values were inserted into an embedded Microsoft Word document as field codes with pre-populated texts. A macro function removed all field codes after completion of the report to generate “clean” text for copy and paste into Sunquest CoPath 6.1 (Tucson, AZ) for additional review and final sign-out.

DESIGN

To measure improvements in this new system compared to traditional methods, we used it to review 10 cases of reports that had been previously completed manually and looked for errors in the normal reference ranges and body/organ measurements.

RESULTS

The system detected errors in 4 out of 10 reports with no significant impact on overall diagnosis. The system was well received by both attending pathologists and residents. Since implementation, all users have adopted the system.

CONCLUSIONS

We have developed a novel and user friendly fetal autopsy report automation system using commonly available Microsoft Office products. It has improved the autopsy workflow by reducing errors and inefficiencies.

J Pathol Inform. 2016 Jul 28;7:33.

A Brief Technical Note on Microservices Architecture


Chris Williams1, Ulysses Balis1

1Department of Pathology, Division of Pathology Informatics, University of Michigan, Ann Arbor, MI, USA. E-mail: chriswi@med.umich.edu

CONTENT

The modern software ecosystem is a rapidly evolving landscape. The availability of cloud computing resources has encouraged developers to package applications into small, encapsulated & functional units that easily scale to meet demand. This segmentation is commonly termed as microservices-based architecture, which offers significant advantages over established monolithic architecture including reliability, maintainability, and security.

TECHNOLOGY

The enabling technology, Linux micro-kernels also referred to as “containers”, is in some ways an evolution of the virtual machine concept but has actually been around much longer. However, relatively recently this has gone from a relatively obscure concept to dominating much of the literature concerning cloud based services. Many cloud providers, including Amazon and Google, now have native container support. Indeed, even Microsoft has incorporated containers into their Azure service and supports Linux and recently announced Windows Server containers.

DESIGN

Microservice containers are essentially bare-bones operating systems. A lightweight framework on the host handles loading and allocation of system resources. The containers are agnostic, and in fact unaware, as to the host they are on. A variety of management frameworks are available to transparently network microservices together. Thus, containers can be running on a single development system, on a private intranet, or anywhere on the internet and function in exactly the same way.

RESULTS

We have started transitioning portions of our infrastructure to a microservices architecture, with immediately encouraging consequences. Although limited in scope, the transitioned services use fewer system resources, are more fault tolerant, and exhibit improved availability. Tempering this observation is the concurrent reality that many systems also under our stewardship are legacy applications and therefore not amenable to such a change.

CONCLUSIONS

Industry is rapidly adopting microservices-based approaches. Laboratory leaders will be well-served to learn best practices in other fields and apply these to their own organizations, or at least keeping it in mind as future roadmaps are being developed. We believe this is more than a passing trend and such solutions will be needed to manage an increasingly complex menagerie of interconnected systems and middleware.

J Pathol Inform. 2016 Jul 28;7:33.

Evaluation of 3D Reconstruction Analysis of FISH Slides Scanned by a Confocal WSI Scanner


Xiujun Fu1, Pinky A. Bautista1, Jochen K. Lennerz1,2, Maristela Onozato1, Anthony J. Iafrate1,2, Yukako Yagi1,2

1Department of Pathology, Massachusetts General Hospital, Boston, MA 02114, 2Harvard Medical School, Boston, MA, USA. E-mail: xfu1@partners.org

CONTENT

Technological advances contribute to a maturation of digital pathology in clinical applications. However, there are few reports on fluorescence scanning especially those include confocal fluorescence imaging technology, which has better resolution in depth compared to wide-field fluorescence imaging. Here, we explored benchmark features of a confocal WSI scanner for application in typical research and diagnostic imaging applications of fluorescence in situ hybridization (FISH) test.

TECHNOLOGY

Multilayer stacking (Z-stack) which stores all image information from each layer, and extended focus which stores the optimal image information from all scanned layers were used with the Pannoramic Confocal scanner (3DHISTECH Ltd., Budapest, Hungary). 3D reconstruction and automatic quantification of dots inside nuclei were made by Imaris (Bitplane, Zurich, Switzerland).

DESIGN

10 FISH slides were digitized with the Pannoramic confocal scanner at multiple layers. The objective used was 40× water immersion with a resolution of 0.1625 μm/pixel. Z-stack and extended focus were used for multiple layers scanning with 31 layers and 2 micron interval. Scanning time and file size were recorded, and image quality was assessed by visual comparison. The 3D reconstruction, quantification of dots, and co-localized analysis were made with Imaris.

RESULTS

Z-stack and extended focus had the same scanning time on the same scanning area, but Z-stack had tremendous file size than extended focus. The quantification of dots inside nuclei analysis showed that extended focus decreased the number of dots [Figure 1AD]. And the co-localization analysis of dots in FITC and TRITC channel indicated that extended focus increased the number of co-located dots [Figure 1E and F]. Multiple channels could be used to image various fluorophores, and the number of dots in each channel was quantified automatically [Figure 1G].

Figure 1.

Figure 1

Comparison of extended focus and Z-stack for analysis of dots inside nuclei. (A-D) A and C are extended focus and Z-stack images scanned with 31-layer and 0.2 μm interval at the same area; B and D are dots detected automatically in FITC (green) and TRITC (red) channels by Imaris (Bitplane, Switzerland). Blue is nucleus. (E, F) Co-localization analysis of FITC and TRITC channels. Cyan and purple dots are co-localized FITC and co-localized TRITC analyzed with Imaris. (G) 3D reconstruction of a single cell Z-stack (31-layer, 0.2 μm interval) with multiple staining, and automated detection

CONCLUSION

Extended focus decrease file size and storage, but could cause incorrect analysis due to overlapping information in depth. We foresee confocal Z-stack scanning as a digital pathology tool for FISH imaging and automated diagnosis in future.

Acknowledgement

The authors thank 3DHISTECH and Bitplane for technical support.

J Pathol Inform. 2016 Jul 28;7:33.

Three-dimension Whole-slide Histological Image Analytics


Yanhui Liang1, Jun Kong2, Fusheng Wang1

1Department of Biomedical Informatics, Stony Brook University, Stony Brook, NY, 2Department of Biomedical Informatics, Emory University, Atlanta, GA, USA. E-mail: yanhui.liang@stonybrook.edu

CONTENT

Whole-slide histological images encode a wealth of information on tissue morphological and pathological signatures at the cellular level, allowing researchers to better understand the underlying mechanisms of disease onsets and evolutions. Therefore, imaging analytical approaches for quantitative analysis of histological structures (such as nuclei and vessels) with microscopy images are in great demand. This is especially true for those enabling studies on 3D structural changes and 3D spatial relationships. We report such a method for 3D primary vessel reconstruction with a set of histological whole-slide images of liver sequential tissue sections, and a mechanism for characterizing 3D spatial relationships between nuclei and vessels by distance measurement.

TECHNOLOGY

With a stack of registered microscopy images, we segment primary vessels by an improved level set method with prior information on vessel wall probability for the energy minimization paradigm. We achieve the optimal vessel associations by local bi-slide vessel mapping and global vessel structure association within a Bayesian Maximum A Posteriori (MAP) framework. We visualize the reconstructed 3D primary vessels by a 3D mesh model, and perform 3D spatial analytics on the reconstructed vessels and simulated 3D nuclei by a distance-based query over Hadoop platform.

DESIGN

Our 3D primary vessel reconstruction framework consists of image registration, primary vessel segmentation, vessel cross-sections association, vessel interpolation and 3D reconstruction. After registering all the slides to a reference image, we segment primary vessels with an improved level set method. We associate the segmented vessel cross-sections in all slides by generating bi-slide vessel components and recovering the global vessel structures. We perform B-Spline interpolation between adjacent associated vessel objects and volumetrically render 3D vessel structure with a mesh representation. Additionally, we compute distances between 3D nuclei and vessels for spatial analytics.

RESULTS

We have tested our framework with a set of 54 whole-slide images of sequential liver tissue sections stained by Immunohistochemistry (IHC). Experiments present satisfactory results and quantitative evaluations demonstrate the efficacy of our method. The proposed framework for 3D vessel reconstruction and spatial analysis is generic and can be readily applied to the analytics of other 3D biological entities of common interest to a large number of studies using whole-slide microscopy imaging data.

CONCLUSIONS

3D modeling and spatial analysis of micro-anatomic objects in histological whole-slide images are essential for researchers and pathologists to understand both normal and disease processes. Our framework can automatically reconstruct the primary vessel structures in 3D with microscopy images and explore spatial patterns across 3D histological objects. In future work, we will develop a system that can dynamically analyze whole-slide images at higher resolutions to accommodate micro-vessel analysis and propose scalable and high-performance platforms for spatial analysis of 3D pathologic structures.

J Pathol Inform. 2016 Jul 28;7:33.

Lessons Learned from Integration of Digital Pathology into Gastrointestinal Pathology


Douglas Hartman1, Michael S. Landau1, Jon M. Davison1, Aatur D. Singhi1, Reetesh K. Pai1, Changqing Ma1, Shih-Fan Kuan1, Navid Farahani1, Anthony Piccoli2, Jeff McHugh2, Matt O’Leary2, Liron Pantanowitz1

1Department of Pathology, University of Pittsburgh Medical Center, 2Information Services Division, University of Pittsburgh Medical Center, Pittsburgh, PA, USA. E-mail: hartmandj@upmc.edu

CONTENT

Numerous studies have shown the equivalency of digital images to glass slides. We have integrated digital pathology into our workflow for gastrointestinal pathology at the University of Pittsburgh Medical Center. Herein, we describe our experience with adoption of digital pathology into our gastrointestinal pathology signout.

TECHNOLOGY

A VL120 scanner (Omnyx) and Integrated Digital Pathology solution (version 1.3, Omnyx) directly interfaced with the Anatomic Pathology Laboratory Information System (APLIS, CoPath Plus V2014.01.1.106, Cerner). The cases with images were viewed at Omnyx workstations.

DESIGN

Over a 3-month period, 529 were randomly selected from the daily gastrointestinal biopsy bench for digital evaluation with each case required to have less than 3 parts. For each case, a pathologist would first render a diagnosis based on digital images, followed by review of glass slides. The two reviews were compared for discrepancies. The histology laboratory created two workflows – one to divert slides for digitalization and one for the standard histology workflow. All slides were scanned at 40x and then sent to the signout pathologists with the remaining gastrointestinal slides for that day. No delays in the usual receipt time of slides was experienced.

RESULTS

Over the course of the study period, the APLIS integration experienced minor technical difficulties (predominantly related to the query service component of the integration) reducing the ability to access clinical information for many of the cases. Fifteen cases contained only partial diagnoses for the entire case based on the digital images and were excluded. Four hundred and seventy cases (91%) were interpreted the same as the final glass slide review. No major discrepancies occurred during the study period. Fifty four cases showed discrepancy between the Omnyx diagnosis and the final diagnosis. These discrepancies were minor in nature and would have limited impact on the patient management. The majority (70%) of these discrepancies involved the evaluation of inflammation within the tissue or the lack of confidence about identifying Helicobacter organisms.

CONCLUSION

In the evaluation of inflammation and Helicobacter organisms, digital images are difficult to interpret compared to glass slides. We were able to implement a gradual integration of digital pathology into our workflow for gastrointestinal pathology with agreement between the digital images and the glass slides. This work represents a partial adoption of digital imaging and future directions, which will include improving the workflow within the histology lab (convert to a complete digital workflow), scanning gastric biopsies with potential Helicobacter pylori at 60x and pathologists adjusting to this new workflow.

J Pathol Inform. 2016 Jul 28;7:33.

Multi-dimensional Nanoscale Nuclear Architecture Mapping for Prospective Prediction of Cancer Progression in Inflammatory Bowel Disease Colitis Patients


Shikhar Uttam1, Justin LaFace1, Jia Yin Tang1, Jana Al Hashash2, Douglas J. Hartman3, Randall E. Brand2, Yang Liu1,2

1Biomedical Optical Imaging Laboratory, Department of Medicine and Bioengineering, University of Pittsburgh, 2Department of Medicine, University of Pittsburgh, 3Department of Pathology, University of Pittsburgh, PA, USA.

E-mail: shf28@pitt.edu

CONTENT

We present md-nanoNAM, a derivative of Fourier-domain optical coherence tomography (FD-OCT), to perform nanoscale nuclear architecture mapping of unstained FFPE tissue sections to a multi-dimensional feature space characterizing the three-dimensional optical density alterations in nuclear architecture at nanometer precision (~1 nm). We perform md-nanoNAM on normal-appearing rectal biopsy to detect the presence of dysplasia throughout the entire colon and predict risk in developing colorectal cancer in patients with IBD colitis.

TECHNOLOGY

A three-module optical system that combines bright-field, common-path FD-OCT and quantitative phase imaging was developed. It builds in pathological identification of epithelial nuclei, along with an algorithm we developed for extracting Fourier phase in FD-OCT, for mapping nanoscale nuclear architecture to a higher-dimensional feature space. The higher-dimensional space is used to identify IBD colitis patients at-risk of developing dysplasia/cancer by learning the feature sub-spaces in which these at-risk patients lay.

DESIGN

We prospectively recruited 107 colitis patients undergoing surveillance colonoscopy with colon biopsies taken per the recommended surveillance guidelines. Two extra biopsies from normal-appearing rectum were analyzed via md-nanoNAM. The patients were grouped into low- and high-risk groups based on histologic diagnoses of all random biopsies from the initial and any available follow-up colonoscopies. We analyzed the initial biopsy to assess if we can both identify the presence of dysplasia anywhere throughout the entire colon, and predict cancer progression for those with follow-up colonoscopies.

RESULTS

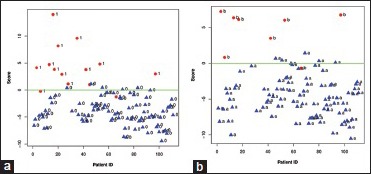
Our preliminary results, shown in Fig. 1, indicate that md-nanoNAM is able to identify:

Figure 1.

Figure 1

(a) 0: No dysplasia/cancer, 1: Dysplasia/cancer. (b) A: Lowrisk with no dysplasia on follow-up, b: Low-risk but dysplasia found on follow-up

  1. The presence of dysplasia/cancer found either concurrently or in the follow-up, and

  2. Those initially classified as low-risk, but dysplasia was found later in the follow-up colonoscopy.

CONCLUSIONS

This initial success of md-nanoNAM in detecting dysplasia from normal-appearing rectum is currently being extended to risk stratification.

Acknowledgements

We acknowledge funding support from NCI (R01CA185363), and NIBIB (R01EB016657).

J Pathol Inform. 2016 Jul 28;7:33.

Application of Augmented Dickey Fuller Test for Identification of Systematic Error in Clinical Chemistry


Amir Momeni Boroujeni1, Elham Yousefi1, Aaron Harper1, Matthew Pincus2

1Department of Pathology, SUNY Downstate Medical Center, Brooklyn, 2VA NY Harbor Healthcare System, Bronx, NY, USA. E-mail: amir.momeni@downstate.edu

CONTENT

The identification of systematic error is an important part of quality control in a clinical laboratory. The commonly used method to detect systematic error in analyte testing are the Westgard rules that require running at least two controls at least three times per 24 h for each analyte tested; these can result in significant patient reporting delays if results on at least one control lies outside of 2 standard deviations from the cumulative mean. In this study we have tried a different approach for identifying systematic error that can potentially avoid time-consuming procedures.

TECHNOLOGY

We have utilized the Siemens Advia 1800 Centralink 20, successive patient moving averages of potassium over a 6-month period for commonly ordered analytes [Figure 1]. We analyzed the data using R programming language.

Figure 1.

Figure 1

Time series showing the moving patient averages of potassium levels in a-month period

DESIGN

The quality control data for the same period including the high and low quality control results were also extracted. The average value of the low and high quality control was calculated and centered with patient averages. The patient averages and centered quality control averages distribution over a period of 30 days was compared using Kolmogorov-Smirnov (KS) test in order to validate the patient averages as a measure of quality control. The Augmented Dickey-Fuller (ADF) test was used to determine whether the patient averages time series is stationary over time. The final results were compared with the Levy-Jennings plots for the high and low controls over the same time period.

RESULTS

The KS two-sample test had a p-value of 0.131 (p<0.05 indicating significant difference), showing the distributions are similar. The ADF test of the time series of moving patient averages of potassium levels is stationary with a value of -4.321 (critical cut off value for sample size: <-2.60). The Levy-Jennings plot of the quality control results in the same period did not show any systematic errors.

CONCLUSIONS

These results suggest that the ADF test of moving patient averages can be a strong tool in determining the presence or absence of systematic errors.

J Pathol Inform. 2016 Jul 28;7:33.

Differentiation of Invasive Melanoma from Dysplastic Nevi by Cell Graph Extraction of Melan: A Stained Slides


Amir Momeni Boroujeni1, Elham Yousefi1, Motahareh Moghtadaei2, Arash Momeni2, Alex Goncharuk3, Viktor Goncharuk4, David Mehregan4, Darius Mehregan4

1Department of Pathology, SUNY Downstate Medical Center, Brooklyn, NY, 3Monroe County Community College, 4Pinkus Dermatopathology Laboratory, Monroe, MI, USA, 2Department of Biomedical Engineering, Dalhousie University, Halifax, NS, Canada. E-mail: amir.momeni@downstate.edu

CONTENT

Dysplastic nevi are the most important differential of melanoma, both clinically and histologically, and can usually be reliably distinguished from melanomas using published criteria. In histologic review, differentiating the two entities is sometimes troublesome with some overlapping features. In this study we aim to apply computer analysis to distinguish these two entities.

TECHNOLOGY

50 Melan-A stained glass slides each of invasive melanoma and dysplastic nevi were scanned at 200x magnification using Mikroscan technologies (Carlsbad, CA, USA) Q-Skan system.

DESIGN

The resulting image stack for each glass slide was exported as a TIF image file. The images were thresholded using intermodes method and fed into the MATLAB based computer model. The model chose 5 regions of interest from each scanned slide, selecting ROIs that had the most uptake of the stain using image intensity processing. Each ROI was segmented using the Hierarchical K-means method and the resulting image was binarized and watersheded. The model then extracted the adjacency matrix representing the image and analysed the characteristics of the matrix [Figure 1]. The network characteristics of 200 random ROIs were used to design a predictive model based on binary logistics regression and the remaining 300 ROIs were tested using the model.

Figure 1.

Figure 1

The top array of images show the thresholding, segmenting and cell graph extraction from a dysplastic nevus. The lower array of images show the thresholding, segmenting and cell graph extraction from an invasive melanoma

RESULTS

The most important predictors of the model were the number of isolated nodes, density and the number of components. The model was 96% accurate in differentiating the invasive melanoma ROIs from dysplastic nevi ROIs.

CONCLUSION

Our model has a very high accuracy in differentiating benign dysplastic nevi from malignant invasive melanomas. This model can be applied as a diagnostic aid for dermatopathologists in helping them diagnose melanocytic lesions with high degree of uncertainty [Figure 1].

J Pathol Inform. 2016 Jul 28;7:33.

Web Based Student Peer Evaluation System


Richard Lindquist1

1Department of Pathology, University of Connecticut School of Medicine, Farmington, CT, USA. E-mail: Lindquist@uchc.edu

CONTENT

Medical student peer evaluation stimulates student participation in PBL, TBL & laboratory learning and improves group performance & learning. Moreover through peer evaluations students gain a discerning attitude toward their future colleges that is essential for optimum patient care. In order to facilitate peer assessments a web based peer evaluation system was developed.

TECHNOLOGY

A web services solution stack consisting of Apache web server, MySQL database and PHP (hereinafter, web stack) was used to develop the Peer Evaluation System. Initially Uniform Server (http://www.uniformserver.com) and later Bitnami web stacks (https://bitnami.com/stacks) were employed. The Uniform Server, a Microsoft Windows operating system web stack, can run from a thumb drive or any USB storage device and requires no installation. Thus the system can simply be used on any Windows computer with a static IP address. The Bitnami web stack can run in Windows, Mac OS X or Linux environments as well as virtualized environments, and popular cloud platforms.

DESIGN

Students presented with multiple checkbox list of potential peer reviewees selected their peers to review. On submitting the selected list, reviewers were presented with forms for each of their peers which allowed them to rank their peers for frequency, quality of peer interactions using radio buttons on a 1-5 basis. A text box was used for collecting written peer evaluation and the peer review was database stored. Programs allowed reviewees to see anonymously their reviews and aggregated ranking scores. Faculty programs generate summative evaluations as well as allowing drill down.

RESULTS

The system has been designed, implemented and tested in classically run and flipped histology and pathology laboratories. Students have willingly accepted the use of the system; however, student evaluations have only been positive, never critical of their peers. This is in sharp contrast to student evaluation of their professors were student can be brutally critical.

CONCLUSIONS

In order to encourage student to be more discriminating in the peer evaluations 2 additional formats are being introduced to the system: divide the points and drag ‘n drop of rank order.

J Pathol Inform. 2016 Jul 28;7:33.

Web Based Student Response (Aka Clicker) System


R. R. Lindquist1

1Department of Pathology, University of Connecticut School of Medicine, Farmington, CT, USA. E-mail: lindquist@uchc.edu

CONTENT

A student response (aka clicker) system, which promotes active learning with increased student motivation and engagement, was developed for use in pathology and histology learning laboratories.

TECHNOLOGY

A web services solution stack consisting of Apache web server, MySQL database and PHP (hereinafter, web stack) was used to develop the clicker system. Initially Uniform Server (www.uniformserver.com) and later Bitnami web stacks (https://bitnami.com/stacks) were employed. The Uniform Server, a Microsoft Windows operating system web stack, is portable and can run from a thumb drive or any USB storage device. It requires no installation. Thus the system can simply be used on any computer with windows operating system and a static IP address. The Bitnami web stack can run in Windows, Mac OS X or Linux environments as well as VMware or VirtualBox virtualized environments, and popular cloud platforms such as Amazon Web Services (AWS), Microsoft Azure, Google Cloud Platform.

DESIGN

A web based clicker system in conjunction with Aperio virtual microscopes (http://www.leicabiosystems.com/digital-pathology/aperio-digital-pathology-slide-scanners) was developed to actively engage first and second year medical students in pathology and histology laboratories. Using the digital conference feature of Aperio, lab preceptor by arrow or circle on the virtual slides asked students to select from a radio button list of possible answers for data base storage. Preceptors tracked student clicks and when complete the aggregated results were projected to the students for discussion. Programs allowed students to see at any time all of their responses and the corresponding correct response throughout the year. Faculty programs generate summative evaluations as well as allowing drill down.

RESULTS

Student attitudes of the use of the web based clicker system in laboratory were very favorable and students looked forward to the continued use of the clicker system. Of 6 faculty who had the system available to them, 5 used it and employed it in writing summative student evaluations.

CONCLUSION

This web based clicker system engages students in pathology learning laboratories and leads to a student-centric learning experience.

J Pathol Inform. 2016 Jul 28;7:33.

Ultrasound Image Storage for Pathologist-performed Ultrasound-guided Fine Needle Aspiration


Sara E. Monaco1, Matt O’Leary1, Jackie Cuda1, Ralph Anderson1, Liron Pantanowitz1

1Department of Pathology, University of Pittsburgh Medical Center, Pittsburgh, PA, USA. E-mail: pantanowitzl@upmc.edu

CONTENT

With the introduction of pathologist-performed ultrasound-guided fine needle aspiration (USG-FNA), pathology departments are being challenged to manage Digital Imaging and Communications in Medicine (DICOM) images. We sought to incorporate such ultrasound images into our laboratory information systems (LIS) and picture archiving and communication system (PACS) to support our new USG-FNA practice.

TECHNOLOGY

BT12 LogiqE ultrasound machine (GE Healthcare). LIS (Cerner CoPath v3.2). SimpleDICOM Receiver and Enterprise DICOM Wrapper (developed by the University of Pittsburgh Medical Center). Networked workstation (HP computer, Intel Core, 8 GB RAM, Windows 7 Enterprise). PACS (iSite, Philips).

DESIGN

Our FNA clinic started an USG-FNA service in 2015. Images form the portable ultrasound machine were uploaded into the LIS (with PicsPlus interface) using Universal Serial Bus (USB) flash drives, a customized DICOM Receiver, and via a shared folder on a networked workstation. JPEG images uploaded into the LIS were then automatically converted using an Enterprise DICOM wrapper and transmitted as DICOM files to a PACS server.

RESULTS

Images (225 KB average file size) for 40 USG-FNA cases to date were uploaded into the LIS using USB flash drives (33 cases, 83%), our networked FNA clinic computer (5 cases, 12%), and DICOM receiver (2 cases, 5%). Table 1 compares all 3 image management methods. Using a shared network drive offered the highest quality images that could easily be incorporated into the LIS.

Table 1.

Comparison of different methods to manage ultrasound-guided fine needle aspiration images

graphic file with name JPI-7-33-g010.jpg

CONCLUSION

Pathology labs performing USG-FNA will likely need to manage their own ultrasound images, which is essential for radiological correlation, procedure documentation, billing and quality assurance. Saving these images as JPEG files in the LIS and DICOM format into a PACS is challenging. Our customized solution using a networked folder on the front end and DICOM wrapper for image conversion on the back-end works well.

J Pathol Inform. 2016 Jul 28;7:33.

Impact of Altering Image Parameters on Image Analysis Data Quality


Liron Pantanowitz1, Chi Liu2, Yue Huang2, Huazhang Guo1, Gustavo K. Rohde2

1Department of Pathology, University of Pittsburgh Medical Center, 2Department of Biomedical Engineering, Carnegie Mellon University, Pittsburgh, PA, USA. E-mail: pantanowitzl@upmc.edu

CONTENT

The quality of data obtained from image analysis can be directly affected by several pre-analytical (e.g., staining, image acquisition), analytical (e.g., algorithm, region of interest) and post-analytical (e.g., computer processing) variables. Whole slide scanners generate digital images that may vary depending on the type of scanner and device settings. Our goal was to evaluate the impact of altering brightness, contrast, compression and blurring on image analysis data quality.

TECHNOLOGY

VL120 scanner (Omnyx). Visiopharm (Hoersholm, Denmark). MATLAB (2015a, MathWorks). Computer (Alienware/M14XR2, Intel i7 CPU 2.3GHz, 12G memory).

DESIGN

Slides from 55 patients with invasive breast carcinoma were digitized to include a spectrum of HER2 scores analyzed with Visiopharm (30 cases with score 0, 10 with 1+, 5 with 2+, and 10 with 3+). For all images a region of interest was selected, and 4 parameters (brightness, contrast, JPEG2000 compression, out of focus blurring) then serially adjusted. HER2 scores were obtained for each altered image.

RESULTS

HER2 scores decreased with increased illumination, higher compression ratios, and increased blurring [Table 1 and Figure 1]. HER2 scores increased with greater contrast. Cases with HER2 score 0 were least affected by image adjustments.

Table 1.

Impact of adjusting parameters on human epidermal growth factor receptor 2 scores

graphic file with name JPI-7-33-g011.jpg

Figure 1.

Figure 1

Impact of altering image parameters on HER2 scores

CONCLUSION

This experiment shows that variations in image brightness, contrast, compression and blurring can have major influences on image analysis results. Such changes can result in under- or over-scoring with image algorithms. Standardization of image analysis is recommended in order to minimize the undesirable impact such variations may have on data output.

J Pathol Inform. 2016 Jul 28;7:33.

Pathology Informatics Essentials for Residents: Outcome of Alpha Testing by Pathology Resident Training Programs


Liron Pantanowitz1, Walter H. Henricks2, Donald S. Karcher3, Priscilla Markwood4, Ann Neumann5, Kristen Johnson5, Amanda Lofgreen5, Trish Glover5, Sue Plath5

1Department of Pathology, University of Pittsburgh Medical Center, Pittsburgh, PA, 2Cleveland Clinic, Center for Pathology Informatics, Cleveland, OH, 3Department of Pathology, The George Washington University, 5CAP Learning, College of American Pathologists, Washington, DC, 4Association of Pathology Chairs, Bethesda, MD, USA. E-mail: pantanowitzl@upmc.edu

CONTENT

The PIER pathology informatics curriculum (Release 1) was launched in September 2014 to facilitate training of U.S. pathology residents. PIER materials were made freely available to all pathology residency programs (http://www.apcprods.org/pier/). To evaluate PIER and support adoption, a group of pathology resident training programs were selected to alpha test the curriculum. Our aim is to report the findings of this testing.

TECHNOLOGY

Feedback was gathered via online surveys (SurveyMonkey®), phone interviews, and virtual focus groups (Citrix GoToWebinar).

DESIGN

12 programs that represented a cross-section of program sizes, geographic locations, and levels of informatics expertise, were selected in the alpha test. Feedback was solicited on four occasions between November 2014 and October 2015 from the department chair, program director, faculty and residents. Nine non-alpha programs also implementing PIER during this time provided input via online survey.

RESULTS

In total, seven department chairs, 30 implementers (program directors and faculty), and 82 residents provided feedback. Programs that already had an informatics curriculum agreed that PIER improved their training (average rating = 4.46, 5-point scale). Most programs without an informatics curriculum agreed that PIER effectively supported implementing informatics training (average rating = 3.87), and had a positive impact on learning. On average, residents reported significant increases in their knowledge/skill after PIER was implemented. 46% of implementers found implementing PIER to be more difficult than other curriculum changes their programs had made; 32% found it easier and 21% found it about the same. Similar to other curriculum changes, the greatest reported challenges were lack of time and/or faculty expertise. The majority (86% chairs, 79% implementers) reported that they were likely to continue using PIER.

CONCLUSIONS

The findings from the alpha test indicate that: (1) the PIER curriculum and associated tools are effective, (2) participating residents reported an increase in knowledge/skill related to PIER learning objectives, (3) implementing PIER may be more difficult than other curriculum changes, and (4) despite implementation difficulties, most participants support PIER and would recommend it to other programs.

J Pathol Inform. 2016 Jul 28;7:33.

Image Analysis Using Shape-based Modeling Segmentation to Grade Renal Cell Carcinoma


Liron Pantanowitz1, Thomas Martel2, John T. Freyhof2

1Department of Pathology, University of Pittsburgh Medical Center, Pittsburgh, 2CytoSavvy, Wayne, PA, USA. E-mail: pantanowitzl@upmc.edu

CONTENT

Several technologies are available to create image analysis algorithms for diagnostic use in pathology. One approach is to employ symbolic object model technology that targets edge detection, in order to generate a database of shape and identity metadata for elements of each image. Our aim was to test whether such shape-based modeling segmentation could be used to develop an image algorithm to automate the grading of renal cell carcinomas.

TECHNOLOGY

CytoSavvy image analysis technology utilizing Bézier curves (up to cubic order) and Ellipse object models. Multiple threshold, multiple resolution dashboard to display image data (https://www.cytosavvy.com/renal-tumor-grading-dashboard.html).

DESIGN

Digital slides of renal cell carcinoma cases with varying grade were selected. These whole slide images were used to develop a set of algorithms, collectively called shape-based modeling segmentation, to grade these tumors. Decision-tree logic was applied to identify cells and multicellular structures based on an extensive morphology database. The algorithm conformed to Fuhrman nuclear grades (1 to 4) using criteria (nuclei size, nuclear shape, presence of nucleoli) outlined in the kidney AFIP Atlas of Tumor Pathology. Analyzed data was displayed in a browser-based interactive dashboard [Figure 1].

Figure 1.

Figure 1

CytoSavvy interactive dashboard (top panel) and highlighted automated nuclei detection (bottom panel)

RESULTS

The algorithm reliably identified renal carcinoma nuclei and automatically generated an overall Fuhrman nuclear grade. For each tumor, an overview heat map showing heterogeneity of nuclear grade was established. The dashboard provided the exact number of nuclei/grade present for the entire slide and an image gallery of all individually graded nuclei for verification.

CONCLUSION

We successfully developed an image algorithm using shape-based modeling segmentation to automatically grade renal cell carcinoma from whole slide images, and a web-based solution for efficient workflow that displays analyzed data. Future work is aimed at clinical validation of this algorithm and applying the same technology to automate grading and scoring of other tumor types.

J Pathol Inform. 2016 Jul 28;7:33.

Whole Slide Imaging Consistency: A Multinational Approach


Eric Vail1, Daiki Taniyama2, Kiyomi Taniyama2, Kazhiro Tabata3, Junya Fukuoka3, Ichiro Mori4, Robert Y. Osamura4, John Fallon1, Yukako Yagi5

1Westchester Medical Center, New York Medical College, Valhalla, NY, 5Department of Pathology, Massachusetts General Hospital, Boston, MA, USA, 2National Kure Medical Center and Chugoku Cancer Center, 3Departments of Pathology, Nagasaki University, Nagasaki, 4International University of Health and Welfare Hospital, Japan. E-mail: eric.vail@wmchealth.org

CONTENT

WSI is a rapidly emerging field in pathology and current efforts are under way to obtain FDA approval for primary diagnosis. It is critical that scanners in different locations produce the same result from the same slide. We evaluated system variability between multiple scanners of the same type at multiple locations.

TECHNOLOGY

Five Phillips Ultra Fast Scanners and five Hamamatsu Nanozoomers were used. All scanners were currently commercially available, unmodified, high volume, high speed scanners.

DESIGN

Fifteen slides were selected for scanning on individual scanners in ten different locations. The slides were assessed for quality and discrepancy between their respective images. A grading system including color, focus and reproducibility was devised to determine if the image was of acceptable quality or required rescanning.

RESULTS

The number of slides that needed rescanning, averaged 2 out of 15 (13%). All of the unacceptable scans had one or more, less than one square millimeter areas that were out of focus. An example of one such discrepancy can be seen in Figure 1. The specific focus abnormalities were not present on rescanned images. All 5 of one scanner type consistently failed to recognize two levels on one of the slides across all of the sites. After discussion with the vendor a tentative fix was made. One scanner had multiple focus discrepancies. However, after maintenance was performed, its performance conformed to the rest of the group. Color discrepancies were site specific and correlated with time from last calibration and software version.

Figure 1.

Figure 1

Example of an area of focus discrepancy between two image

CONCLUSION

Our findings show that currently the machines that we tested showed few variances in slide image quality. The areas that were out of focus were unique to the scanner tested and comparatively small. We did not see any scanning error that disrupted diagnosis. We also found that a large number of levels on one slide presented challenges for the tissue recognition for one of the scanner types. Individual scanners had noticeable inter-site color variation, but no intra-site discrepancies. This was correlated with calibration history and software version. Standardization of image quality evaluation protocol and scanner consistency is critical for continued evolution of diagnostic WSI capabilities.

J Pathol Inform. 2016 Jul 28;7:33.

Provider and Patient Acceptance of Auto-release of Test Results


Jennifer S. Woo1, Opal Reddy1, Thomas A. Drake1

1Department of Pathology and Laboratory Medicine, David Geffen School of Medicine, UCLA, Los Angeles, CA, USA. E-mail: jswoo@mednet.ucla.edu

CONTENT

CMS meaningful use stipulates that patients are provided timely online access to their health information. We report experience of a large health system in meeting this goal with regard to lab results through implementation of an auto-release policy on a patient portal, with a specific assessment of tumor markers for Hematology-Oncology patients.

TECHNOLOGY

Epic 2014 is the electronic health record system in place at the time of this assessment, with the MyChart feature as the patient portal. Data for the numbers of cancer antigens tests were obtained from the Epic Clarity data repository.

DESIGN

This is a descriptive study of acceptance of auto-release of laboratory data through the patient portal over a 13 month period, beginning Oct 2014. Patient and physician experience were known through monthly meetings and reports from the MyChart team. Test data were obtained for the cancer antigen markers CA125, CA15-3, CA19-9, and CA27.29.

RESULTS

The vast majority of lab tests results were auto-released 3 days after resulting. Tests excluded from auto-release because of California law were pathology results, and tests related to HIV, hepatitis, and drugs of abuse. Also excluded were genetic tests. Since implementation, the MyChart committee received only one formal request to change lab release policy. This was from a Hematology-Oncology clinician, responding to a patient complaint related to cancer antigen tests. To obtain context for this, cancer antigen test ordering was assessed. A total of 21,881 cancer antigen tests were ordered for 5,631 patients, the majority being ordered by specialists (75% of total). A third of test values were deemed as elevated. These data supported continuing current policy.

CONCLUSIONS

Access to personal health information empowers patients to engage their health care. The vast majority of patients embrace this, but on occasion the auto-release of certain tests before the ordering physician is able to effectively communicate results, leads to patient distress. Currently any given test is auto-released or not to all patients. Enabling personalized auto-release of test results could mitigate this issue.

J Pathol Inform. 2016 Jul 28;7:33.

Quantitative Phase Imaging to Improve the Diagnostic Accuracy of Urine Cytology


Hoa V. Pham1, Liron Pantanowitz2, Yang Liu1

1Department of Medicine and Bioengineering, University of Pittsburgh, 2Department of Pathology, University of Pittsburgh Medical Center, Pittsburgh, Pennsylvania, USA. E-mail: hvp2@pitt.edu

CONTENT

Definitive diagnosis of urothelial carcinoma in urine specimens based on cytomorphology alone may be challenging, with 30% “indeterminate” diagnosis. We present the use of quantitative phase imaging (QPI) to quantify the nuclear dry mass of unstained urine cytology specimens to improve the diagnostic accuracy of urine cytology.

TECHNOLOGY

QPI is an emerging technology in which quantitative phase images of unstained specimen can be obtained, from which the dry mass can be accurately measured at single cell and nucleus level. A custom-built quantitative phase microscope was used, which provides a high-contrast low-noise quantitative phase image from unstained cells.

DESIGN

Urine samples were processed with ThinPrep, and unstained slides were made. Urothelial cells from four categories of cytological diagnosis (negative, atypical, suspicious, positive) were imaged and three parameters (nuclear dry mass, nucleus-to-cytoplasm dry mass ratio, nuclear entropy) were calculated for each cell (~50-400 cells per patient). A multivariate scoring scheme with each parameter tested against a chosen threshold resulting in a TRUE or FALSE outcome. A diagnosis for each patient was based on majority vote of the three outcomes.

RESULTS

Quantitative analysis of the nucleus dry mass showed a progressively higher value for the four diagnostic categories, with morphologically benign and malignant urothelial cells well separated, and the atypical and suspicious cases also showing significant differences. Table 1 shows our prediction results with the initial and clinical follow-up diagnosis, which shows a perfect match with the patients’ available follow-up.

Table 1.

Proposed quantitative phase imaging based scoring scheme for cytologic diagnosis

graphic file with name JPI-7-33-g015.jpg

CONCLUSION

QPI shows potential to improve the diagnostic accuracy of urine cytology, based on precise quantitative assessment of nuclear dry mass in label-free cells. A large-scale study is needed to verify this scoring scheme as well as to train the test thresholds to get a rigorous diagnostic scoring scheme.

J Pathol Inform. 2016 Jul 28;7:33.

Laboratory Information System Conversion of ICD-9 to ICD-10: Don’t Believe the Hype


Navid Farahani1, Sharon DiMaggio1, Frank Losos1, Anthony Piccoli2, Jeffrey McHugh2, Liron Pantanowitz1

1Department of Pathology, Division of Pathology Informatics, University of Pittsburgh Medical Center, 2Information Services Division, University of Pittsburgh Medical Center, Pittsburgh, PA, USA. E-mail: nfarahan@gmail.com

CONTENT

The International Classification of Diseases (ICD) is a standardized set of codes for medical conditions and procedures, which are used for diagnosis, epidemiology, health management, and billing. Since 1979, the United States has required ICD codes for Medicare and Medicaid claims. ICD codes were last updated over 35 years ago with the release of the ninth revision (ICD-9), and contain obsolete terms that are inconsistent with recent advances in medical practice, knowledge, and technology. The original deadline for adoption of the tenth revision of the ICD (ICD-10) has been delayed. We describe our experience with conversion from ICD-9 to ICD-10 at a large multi-hospital health network.

TECHNOLOGY

Anatomic pathology laboratory information system (APLIS); CoPath Plus v2013 (Cerner, Kansas City, MO).

DESIGN

The new ICD-10 codes were downloaded from the Centers for Medicare & Medicaid Services (CMS) website, along with a General Equivalence Mappings (GEMs) toolkit to assist with the conversion of ICD-9 to ICD-10 and vice versa. GEMS was used to develop application-specific mappings between the disparate code tables of ICD-9 and ICD-10. New ICD-10 codes were subsequently uploaded into the CoPath Plus ICD dictionary.

RESULTS

Over 68,000 diagnosis-related and 87,000 procedure-related ICD-10 codes were successfully mapped to over 14,000 diagnosis-related and 4,000 procedure-related ICD-9 codes, respectively. All pathology reports now contain ICD-10 codes in place of ICD-9 codes.

CONCLUSION

There was much concern that the ICD-10 conversion process would be a technological nightmare with wide reaching implications. From an APLIS standpoint, these fears were never realized and the conversion process was largely flawless due to the extensive preparation process undertaken by our large integrated health system over the course of several years.

J Pathol Inform. 2016 Jul 28;7:33.

Adjusting Color Threshold for Whole Slide Imaging Overcomes Artifacts Caused by Pen Markings on Glass Slides


Navid Farahani1, Jon Duboy1, Douglas J. Hartman1, Michael Riben2, Liron Pantanowitz1

1Department of Pathology, Division of Pathology Informatics, UPMC, Pittsburgh, PA, 2Department of Pathology and Laboratory Medicine, MD Anderson Cancer Center, Houston, TX, USA. E-mail: farahanin@upmc.edy

CONTENT

Placing color pen markings on glass slides (e.g. dotting significant areas, writing down measurements, circling floaters, delineating control tissue for stains) is common practice in anatomical pathology. Unfortunately, pen marks on coverslips may negatively affect slide digitization, by interfering with tissue detection and focusing. We sought to investigate whether altering color detection thresholds during scanning could overcome this problem.

TECHNOLOGY

Aperio ScanScope XT (Leica Biosystems) and permanent pen markers (PILOT).

DESIGN

Glass slides with H&E-stained tissue were marked with color pens (black/blue/green/red). The scanner's command code for detection threshold of dark-colored objects was incrementally adjusted (from 0-70) in the configuration panel to find the optimal value to ignore black pen marks, without affecting tissue detection and focus point selection. Using the optimized threshold value, 25 slides were scanned, including: 10 H&E stained tumors with black inked margins, 10 H&E stained tissue with endogenous/exogenous dark-colored pigments (e.g. melanin, ochronosis, hemosiderin, amalgam tattoo, anthracosis, coal miner's lung, minocycline), and dark-colored special stains (Von Kossa, reticulin, Verhoeff elastic, Grocott's methanamine silver) were scanned.

RESULTS

The optimal threshold for slide digitization, where black pen marks were ignored but all tissue got detected and scanned in focus, was determined to be 34 [Figure 1]. At this threshold, all black ink on tumor margins and dark tissue pigments were automatically detected with optimal focus point selection. Black stained tissue was only partially detected at the optimal threshold value.

Figure 1.

Figure 1

With zero detection threshold (DT) for black (left) both light and dark tissue pieces get detected during scanning, but automated focal points also include unwanted black pen markings on the slide. With optimal DT set at 34 (middle) both tissue fragments are scanned and pen marks are not included during focusing. With a higher DT (right) the darker piece of tissue is no longer scanned. Yellow boxes represent focus points for scanning

CONCLUSION

When scanning in glass slides where it is essential to keep pen markings, it is recommended that only black markers be used and that the threshold setting for the color black be simultaneously optimized to ensure that these marks do not interfere with scanning. Marked color adjustments are best avoided in cases when special stains with black coloration are employed.

J Pathol Inform. 2016 Jul 28;7:33.

Does Oculus Rift Enhance the Ability to Examine Digital Pap Test Slides?


Navid Farahani1, Jon Duboy1, Jacqueline Cuda1, Juan Xing1, Sara E. Monaco1, Liron Pantanowitz1

1Department of Pathology, University of Pittsburgh Medical Center, Pittsburgh, PA, USA. E-mail: nfarahan@gmail.com

CONTENT

Digital cytology is particularly challenging because cytologists have to thoroughly screen entire slides. Whole slide images, typically viewed using desktop personal computers and monitors, are cumbersome to navigate. Virtual reality technology such as Oculus Rift, used primarily for gaming, has yet to be tested for medical imaging purposes and cytopathology. The aim of this study was to determine the utility of using Oculus Rift to interpret digital Papanicolaou (Pap) slides.

TECHNOLOGY

Oculus Rift Development Kit 2 (Facebook Inc.), 64-bit desktop computer (HP Z440 Workstation, Intel Xeon E5-1650v3, 32GB DDR4-2133, NVIDIA GeForce GTX Titan X GPU, 512GB PCIe SSD, 1TB 7200RPM HDD) running Microsoft Windows 10, 27-inch IPS 5K display (HP Z27q), Aperio Scanscope XT scanner (Leica Biosystems).

DESIGN

Ten randomly selected ThinPrep Pap test glass slides (4 negative, 1 atypical, 5 positive) were digitized using an Aperio whole slide scanner. Three pathologists and one cytotechnologist reviewed these digital Pap test slides on a 27-inch 5K display and using the Oculus Rift [Figure 1]. Final diagnoses and time required to examine slides were recorded. Participants also rated image quality and diagnostic confidence for both modalities.

Figure 1.

Figure 1

Using oculus rift to interpret digital Pap test slides

RESULTS

Diagnostic concordance was 60% for the 5K display and Oculus Rift. The time to examine digital slides on the Oculus Rift (average 320, range 191-503 seconds) averaged 70 seconds more than the 5K display (average 250, range 135-350 seconds). Reviewers complained about suboptimal image quality/artifacts, fatigue, and reported lower diagnostic confidence when using the Oculus Rift.

CONCLUSION

Using the Oculus Rift to view and navigate Pap test whole slide images in a virtual environment, while feasible, is suboptimal for diagnostic purposes. Low image resolution and juddering (secondary to high latency and/or low frame rates) of the Oculus Rift device were major limitations. Given that cytologists spent longer times screening Pap test slides with the Oculus Rift, they experienced several well-known side effects associated with prolonged virtual reality usage (nausea, headache, dizziness).

J Pathol Inform. 2016 Jul 28;7:33.

How much do Digital Artifacts Interfere with Interpreting Teleconsultation Cases?


Navid Farahani1, Douglass J. Hartman1, Thomas Harper2, Liron Pantanowitz1

1Department of Pathology, Division of Pathology Informatics, UPMC, 2Information Services Division, UPMC, Pittsburgh, PA, USA. E-mail: nfarahan@gmail.com

CONTENT

Telepathology is increasingly being used to support diagnostic consultation services. Prior publications have addressed various technical and clinical aspects of telepathology efforts; however, literature regarding the impact of tissue and glass slide preparation artifacts on digitization for teleconsultation has not been well addressed. This study aimed to characterize the types of digital artifacts commonly encountered and their impact on the practice of diagnostic telepathology.

TECHNOLOGY

Whole slide images were acquired with a NanoZoomer 2.0-HT (Hamamatsu, Japan). Images were submitted for consultation via a customized telepathology portal (https://pathconsult.upmc.com/).

DESIGN

Feedback on tissue staining and image quality was solicited from pathologists while reviewing whole slide images submitted for teleconsultation. Digital slides in a subset (n=50) of cases, across all surgical subspecialities, were carefully screened for artifacts (thick tissue sections, tissue folds, pale staining, coverslip artifacts, dirt, obscuring mounting media, focus problems).

RESULTS

Of 2310 cases reviewed, pathologists complained about focus problems in 28 (1.21%) cases, stain artifacts in 6 (0.002%) cases, image artifacts in 3 (0.001%) cases, and insufficient image resolution in 1 (0.0004%) case. Subsequent review of 50 cases revealed that the presence of dirt [Figure 1] was the most common artifact (44 cases, 88%) followed by coverslip issues (34 cases, 68%), tissue folds (28 cases, 56%), thick tissue sections (24 cases, 48%), obscuring mounting medium (16 cases, 32%), pale tissue staining (11 cases, 22%), and focus artifacts (6 cases, 12%). In all cases a second opinion diagnosis was rendered, without deferral to glass slides.

Figure 1.

Figure 1

Examples of minor digital slide artifacts showing (top left) out of focus tissue extending beyond the coverslip and (bottom left, top right and bottom right) dirt above and below the coverslip

CONCLUSION

These results indicate that pathologists interpreting whole slide images submitted for teleconsultation are tolerant to several minor artifacts, both from slide preparation (e.g. tissue folds) and digitization (e.g. focus artifacts), despite the fact that such artifacts may be commonly seen in digital slides.

J Pathol Inform. 2016 Jul 28;7:33.

Automated 3D Scanning of Gross Surgical Pathology Specimens


Navid Farahani1, Jon Duboy1, Ishtiaque Ahmed1, Samuel Yousem1, Douglas Hartman1, Liron Pantanowitz1

1Department of Pathology, University of Pittsburgh School of Medicine, Pittsburgh, Pennsylvania, USA. E-mail: nfarahan@gmail.com

CONTENT

Commercial three-dimensional (3D) scanning, printing, and virtual reality technologies today are ubiquitously available, relatively inexpensive, and easy-to-use. Limited studies have explored the utility of manual 3D scanning in pathology, primarily for educational purposes. To the best of our knowledge, the use of automated, high-resolution 3D scanners for routine use in pathology has not been well tested. Our aim was to determine the feasibility of generating high fidelity 3D scans of gross pathology specimens.

TECHNOLOGY

Matter and Form 3D scanner (Matter and Form Inc., Toronto, ON, Canada) measuring 34.5 × 21cm with USB 2.0 connectivity; Microsoft Surface Pro 3 (Microsoft Corporation, Redmond, WA, USA) with 64-bit Windows 8.1 operating system; Matter and Form Scan software for Windows (v 0.2.11.0).

DESIGN

A 3D scanner was used to capture multiple dense point clouds and color texture maps from several orthopedic gross pathology specimens including metallic and non-metallic hardware (e.g. rods, screws, plates, spacers) and tissue (bone, amputated digit). The scanner was calibrated prior to scanning each specimen and operated in a bright, evenly lit room. Captured data was vertex-cleaned and separate scans of the specimen in various positions were combined. Composite scans for each specimen were subsequently mesh-reconstituted using vendor provided software, and exported in both. obj and. stl formats [Figure 1].

Figure 1.

Figure 1

3D scanner shown with a big toe specimen secured to the rotating platter using putty-like adhesive (left). Corresponding dense point cloud generated from a single scan of the big toe specimen (center). Final mesh-reconstituted 3D scan of an unfixed, bloody femoral head specimen (right)

RESULTS

The maximum specimen size that could be scanned was 25 × 18 cm. 3D scans took 15-20 minutes per scan, prior to post-acquisition modifications. Each scanned specimen had 360° visibility and could be easily rotated and viewed in 3D. Post-processing software was required to optimize scans by removing extraneous artifacts (e.g. the rotating platter, background noise) and combine/align multiple scans at different angles to fill in specimen features. Image quality of scanned specimens was satisfactory, but limited by scanner resolution (capture details ≥0.43 mm with a capture size within ± 0.25 mm). Scan quality was negatively impacted by excessively bright and reflective backgrounds (e.g. computer screen). Lightly using baby powder on specimens that had reflective, translucent or transparent components improved scans.

CONCLUSION

Automated 3D capture of gross surgical pathology specimens is feasible using commercial, inexpensive 3D scanners. These 3D images of gross specimens can be used for a variety of reasons such as documentation and archiving in the laboratory information system, gross telepathology, education, 3D printing, and research employing annotation tools.

J Pathol Inform. 2016 Jul 28;7:33.

Using Heatmaps to Identify Opportunities for Optimization of Test Utilization and Care Delivery


Nina Haghi1, Tylis Chang1

1Department of Pathology and Laboratory Medicine, Northwell Health, Lake Success, NY, USA. E-mail: NHaghi12@northwell.edu

CONTENT

Clinical laboratory test orders provide a vast amount of data, which can be overwhelming and difficult to extract meaning from. We demonstrate the use of “heatmaps” as a means to quantify utilization patterns and identify opportunities for improvement of care delivery for internal medicine providers in our health system.

TECHNOLOGY

Orders originating from internal medicine practices affiliated with Northwell Health between September 2015 and December 2015 were extracted from the laboratory information service (LIS), Cerner Millenium.

DESIGN

Test volumes (by specific orderable) were organized by specific provider. A “utilization index” was calculated using the following formula: [utilization index = (provider test volume/provider total volume)/(total test volume/total volume)] to identify over- and under-utilization, as compared to the established cohort. Orderables were ranked according to volume, and “hot spots” (shades of red) and “cold spots” (shades of blue) were identified using Excel conditional formatting color scale, using a midpoint value of 1.0 [Figure 1].

Figure 1.

Figure 1

Internal Medicine Practice Laboratory Test Data by Provider between 09/24/15 and 12/22/15

RESULTS

We identified several “hot spots” as areas of potential over-utilization associated with specific providers. This information can used to initiate meaningful dialogue with providers and identify areas for improvement. Variations in patient populations and peer-to-peer provider ordering behaviors are accounted for by comparing providers to other members of their cohort. While billing and insurance information can be another source of ordering behavior, it is inherently incomplete as it does not include clinical data, precluding fair assessment of ordering practices.

CONCLUSION

In conclusion, “heatmaps” provide a simple, visual illustration of test ordering behavior which can be used to identify opportunities for care improvement and reduction in healthcare costs.

J Pathol Inform. 2016 Jul 28;7:33.

How does Digital Magnification on Different Whole Slide Scanners Affect the Assessment of Gastric Biopsies for Helicobacter Pylori?


Douglas J. Hartman1, Dinesh Pradhan1, Liron Pantanowitz1, Jon Duboy2

1Department of Pathology, University of Pittsburgh Medical Center, 2Information Services Division, University of Pittsburgh Medical Center, Pittsburgh, PA, USA. E-mail: hartmandj@upmc.edu

CONTENT

Whole slide imaging (WSI) adoption is starting at various institutions around the world. Published studies have indicated that microorganisms such as Helicobacter pylori (HP) may be missed in digital slides. However, no systematic study has been performed to evaluate this drawback. The objective of this study was to compare the quality of digital slides scanned using different scanners at different magnifications for the interpretation of gastric biopsies to detect HP.

TECHNOLOGY

Omnyx VL120 (Omnyx) and Aperio ScanScope XT (Leica Microsystems) were used. Aperio digital slides were viewed using ImageScope (Aperio ePathology, Leica) on HP ZR24w (1920×1200) monitors. Omnyx images were viewed on an Omnyx workstation (HP Z24s Generic PnP monitors with 3840 x 2160 resolution).

DESIGN

Ten blinded, randomly selected and de-identified gastric biopsies (1 Hematoxylin and Eosin (H&E) slide and 1 HP immunostain slide of each case) were evaluated using Omnyx (40x and 60x) and Aperio (20x and 40x). The original final diagnosis rendered by glass slides was used as the gold standard comparison. Two pathologists rendered diagnoses and rate the image quality (1-10) for each format.

RESULTS

Table 1 compares the findings using digital slides to the glass slide assessment. One difficult case accounted for the discrepancy with the glass slide across all magnifications. The discrepancy in result interpretation of H&E digital slide on both Omnyx and Aperio system was because of inability to confidently identify HP in one case. The image quality was better at the higher magnification regardless of scanner type.

Table 1.

Comparison of findings using digital slides to the glass slide assessment

graphic file with name JPI-7-33-g021.jpg

CONCLUSION

The assessment for HP on gastric biopsies via digital images does show discrepancy between digital and glass slides regardless of imaging magnification or stain. Future work should be focused assessing a cost-effective solution for this common problem.

J Pathol Inform. 2016 Jul 28;7:33.

Successful Implementation of Whole Slide Imaging for Pediatric Surgical Pathology: A Pilot Study


Jennifer Picarsic1, Douglas J. Hartman1, Miguel Reyes-Múgica1, John Ozolek1, Amy Davis1, Ranganathan Sarangarajan1, Lori Schmitt1, Navid Farahani1, Chelsea Watkins2, Matthew O’Leary2, Anthony Piccoli2, Jeffrey McHugh2, Liron Pantanowitz1

1Department of Pathology, UPMC, 2Information Services Division, UPMC, Pittsburgh, PA, USA. E-mail: picarsicj@upmc.edu

CONTENT

Whole slide imaging (WSI) is being increasingly adopted in surgical pathology for primary diagnostic use. So far, very few studies have been prospectively evaluated by the College of American Pathologists and Laboratory Quality Center (CAP-PLQC) recommended guidelines for validating WSI for diagnostic purposes in pediatric pathology. We aim to share our successes and challenges in the implementation of a WSI system for clinical work in an academic pediatric pathology laboratory.

TECHNOLOGY

Implementation using a VL120 scanner (Omnyx), Integrated Digital Pathology software (version 1.3.1, Omnyx) interfaced with our Anatomic Pathology Laboratory Information System (APLIS, CoPath Plus V2014.01.1.106, Cerner), and Omnyx workstation (HP Z24s Generic PnP monitors with 3840 × 2160 resolution).

DESIGN

Prospective pilot validation of select pediatric pathology cases (one block with 1 hematoxylin and eosin slide) compared WSI with the glass slide over a 3 month period, in accordance with CAP-PLQC guidelines. WSI was first reviewed, followed by the glass slide. User satisfaction was documented via survey (scale 1 = poor to 10 = best) for 5 participating pediatric pathologists.

RESULTS

WSI integrated with our laboratory information system was achieved. A total of 243 surgical pathology cases were scanned. WSI diagnoses (n = 238) were highly concordant with glass slide diagnoses (99% concordance). Pathologist's average satisfaction score of image quality was 8.2 and for digital workflow it was 7.6. Image focus quality issues were encountered in 11 cases (4.6%), which included cases with tissue folds and heavily pigmented or calcified sections. WSI workflow issues occurred in 49 cases (20%), which included scan failures (n = 6), temporary laboratory information system interface downtime (n = 35), and problems with finalizing cases as complete (n = 8).

CONCLUSIONS

Digital pathology integration into a diagnostic pediatric pathology laboratory is feasible for diagnostic purposes. In the majority of cases pathologists were satisfied with image quality and digital workflow. A small proportion of cases were hindered by image focus difficulties and technical delays. Increased adoption of digital pathology will require increasing dedicated staff in the clinical laboratory to support high-volume scanning and ongoing technical support.

J Pathol Inform. 2016 Jul 28;7:33.

Evaluation of Accessibility and Content in Pathology Residency Program Websites


Shyam Prajapati1, Dominick Guerrero1, Emilio Madrigal1

1Department of Pathology, Ichan School of Medicine, Mount Sinai Health System, New York, USA. E-mail: sprajapati@chpnet.org

CONTENT

The internet affords combined anatomic and clinical pathology (AP/CP) residency training programs the opportunity to showcase a wealth of information. In today's world, residency candidates peruse program websites prior to and while applying and it should be in the best interest of programs to optimize their published pages. Our study examines accessibility and content of such websites.

TECHNOLOGY

The Mobile-Friendly Test (Google Menlo Park, CA) was used to determine mobile platform performance and Google Analytics (Google Menlo Park, CA) was used to track our program's website traffic.

DESIGN

All of the 142 AP/CP residency programs were identified by utilizing databases maintained by Fellowship and Residency Electronic Interactive Database (FREIDA) and Accreditation Council for Graduate Medical Education (ACGME). Attempts were made to access the program websites via these databases and Google Search. Dead links, mobile-friendliness, and the use of social media were recorded. Content items (program description, personnel listings, and incentives) were recorded and considered current if an update occurred in 2015. Residency candidates interviewed at our institution were surveyed on their use of our program's website and web analytics tracked site traffic and user behaviors.

RESULTS

139 of 142 websites were accessible, with 94.2% and 81.7% of functional links originating from FREIDA and ACGME, respectively. Google searches directly linked to 96% of programs, 43.0% programs had connectivity through social media, and 40.8% of websites tested “mobile friendly.” All 139 websites contained content related to training descriptions; however 77.7% posted information on incentives; 87.1% had personnel listings; 47.5% were recently updated. Our in-house survey revealed 93.4% of interviewees visited our program's website prior to interviewing. Web analytics showed that our applicant requirements page received an increase of visitors by an average of 196%, corresponding to the residency application season.

CONCLUSIONS

A majority of ACGME accredited AP/CP programs have functional websites with online content catered for potential residents. Accessibility issues could possibly be addressed by repairing dead links, accommodating to mobile devices, and embracing social media connectivity. We believe an up to date and comprehensive website is critical in disseminating residency program information and possibly for residency recruitment.

J Pathol Inform. 2016 Jul 28;7:33.

Uncovering Diagnostic Heuristics Using Multi-dimensional Gaze-tracking Data and PathEdEx Platform


Dmitriy Shin1,2,3, Ilker Ersoy1, Misha Kovalenko1, Filiz Bunyak3, Donald Doll4, Chi-Ren Shyu2, Richard Hammer1

1Department of Pathology and Anatomical Sciences, 3Department of Computer Science, University of Missouri, MO, USA, 2MU Informatics Institute, University of Missouri, 4Ellis Fischel Cancer Center, University of Missouri, Columbia, MO, USA. E-mail: shindm@health.missouri.edu

CONTENT

We have developed an online interactive Whole-Slide-Imaging (WSI) hematopathology atlas PathEdEx (pathedex.com) with a realistic diagnosis workflow and WSI viewing capability. The atlas was implemented as an online resource that has the capability to communicate with the local eye tracking hardware to capture the screen coordinates of user's gaze, and compute the image coordinates of where in the slide they are looking at with respect to pan and zoom data. Here we report results of a study to uncover pathologist heuristic of diagnosing hematopathological cases by users with different levels of expertise.

TECHNOLOGY

PathEdEx is as part of our previously developed Digital Pathology Integrative Platform (DPIP) which has several software modules to provide educational and research tools in pathology informatics. In addition to DPIP platform PathEdEx introduces a novel informatics pipeline based on mean shift algorithm to cluster multidimensional gaze data at different zoom levels to capture the regions of interest during panning and zooming. The panning and zooming error analysis was performed and method to adjust to individual pathologist image investigations styles was developed.

DESIGN

In this study we have collected user behavior and whole slide image viewing data while users went through the diagnostic workflow of real hematopathological patient cases in PathEdEx atlas. As they panned and zoomed in the WSI viewer, we captured their gaze data and computed their fixation points to quantify visual diagnostic heuristics [Figure 1]. We captured their navigation data as they go through the cases, and their gaze data while they interacted with the H&E and IHC slides.

Figure 1.

Figure 1

The design of study to uncover diagnostic heuristics using PathEdEx atlas

RESULTS

Here we report results of a study to uncover pathologist heuristic of diagnosing 5 hematopathological cases by users with different levels of expertise (medical student, first year resident, last year resident, expert and generalist pathologist). Our data show that experienced hematopathologists require up to 2 times fewer fixations and up to 90% less time to diagnose than generalist pathologist.

CONCLUSION

We conclude that PathEdEx can be used to capture and analyze diagnostic heuristic of multidimensional gaze-tracking data and diagnostic navigation workflow for complex hematopathological cases.

J Pathol Inform. 2016 Jul 28;7:33.

Hierarchical Feature Extraction for Diagnosis of Thyroid Follicular Lesions from Cell Nuclei Morphology


Chi Liu1, Yue Huang2, John A. Ozolek3, Gustavo K. Rohde1

1Department of Biomedical Engineering, Carnegie Mellon University, 3Department of Pathology, Children's Hospital of Pittsburgh, Pittsburgh, PA, USA, 2Department of Communications Engineering, Xiamen University, Xiamen, China.

E-mail: chiliu@andrew.cmu.edu

CONTENT

Cell nuclei are of great interest to pathologists for diagnosis of thyroid lesions. However, it is impractical to obtain nuclei-level annotations from pathologists for training a classifier in computer-aided diagnosis (CAD) systems. We solve this problem by proposing a novel feature extraction method which hierarchically exploits potential dependency between cell nuclei and represents each patient using a single feature vector facilitating classification.

TECHNOLOGY

The cell nuclei were segmented from histopathology images, and represented using 256-dimensional feature vectors. Given the feature matrix describing the cell nuclei, a set of prototypes are initialized in the feature space using a clustering method. Then, each patient is hierarchically embedded as a point in the new feature space with the defined prototypes. Finally, the decision boundary and instance prototypes are jointly optimized by maximizing the margin in a support vector machine (SVM) classifier [Figure 1].

Figure 1.

Figure 1

Illustration of the proposed hierarchical feature extraction framework. (a) Cell nuclei segmentation; (b) nuclei feature extraction; (c) hierarchical feature extraction and label prediction for patients

DESIGN

The performance of the proposed method was tested in the diagnosis of thyroid lesions, including follicular adenoma of the thyroid (FA), follicular variant of papillary thyroid carcinoma (FVPC), and nodular goiter (NG), which remain diagnostic challenges in surgical pathology. We compare the classification results by our method and naive Bayes method which assumes that cell nuclei are independent to each other. In our experiment, the widely-used naive Bayesian linear support vector machine + majority voting strategy was used to predict the class labels of patients.

RESULTS

The classification results are shown in Table 1.

Table 1.

Classification results from different approaches

graphic file with name JPI-7-33-g024.jpg

CONCLUSIONS

Our method showed better performance compared with naive Bayes method tested on thyroid dataset. The proposed hierarchical structure can be stacked in a repeatable fashion and the parameters can be optimized alternatively by maximizing the class separation margin. The potential dependency between nuclei is incorporated layer by layer for performance boosting.


Articles from Journal of Pathology Informatics are provided here courtesy of Elsevier

RESOURCES