

Abstract
Introduction:
Social Network Analysis (SNA) provides an important, underutilized approach to evaluating Community Academic Partnerships for Health (CAPHs). This study examines administrative data from 140 CAPHs funded by the Healthier Wisconsin Partnership Program (HWPP).
Methods:
Funder data was normalized to maximize number of interconnections between funded projects and 318 non‐redundant community partner organizations in a dual mode analysis, examining the period from 2003–2013.Two strategic planning periods, 2003–2008 vs. 2009–2014, allowed temporal comparison.
Results:
Connectivity of the network was largely unchanged over time, with most projects and partner organizations connected to a single large component in both time periods. Inter‐partner ties formed in HWPP projects were transient. Most community partners were only involved in projects during one strategic time period. Community organizations participating in both time periods were involved in significantly more projects during the first time period than partners participating in the first time period only (Cohen's d = 0.93).
Discussion:
This approach represents a significant step toward using objective (non‐survey) data for large clusters of health partnerships and has implications for translational science in community settings. Considerations for government, funders, and communities are offered. Examining partnerships within health priority areas, orphaned projects, and faculty ties to these networks are areas for future research.
Keywords: community engagement, social network analysis, community‐academic partnerships for health, team science, translational research
Introduction
Social Network Analysis (SNA) uses network theory to describe the relationships between people, items, or institutions. SNA is used widely in industry and academia to understand network composition such as how networks influence outcomes, and how information and resources flow through social systems.1 Increasingly, SNA is used to explain a variety of health outcomes.2, 3 However, SNA is not widely used in community partnership research. This is surprising because community‐academic partnerships for health (CAPHs) work to integrate academic, nonprofit service agency, and community‐level expertise to impact complex health problems.4
CAPHs are important to translational science and translational medicine because these ad hoc, multiagency networks often involve transdiciplinary teams that provide institutional reach to individuals “on the ground” in a wide variety of communities that would otherwise be difficult to access. This reach can facilitate brokered access to health disparities groups for interventions designed to improve health and can make recruiting and retaining research participants from these groups more feasible by involving community agencies and participants in collaborative, culturally appropriate ways.
Moreover, CAPHs also provide communities with powerful avenues to influence health systems and the research priorities of their academic institution partners. When developed carefully by attending to the principles of Community Engagement,5 CAPHs can become semipermanent structures that allow community partner organizations access to high‐level institutional decision‐makers, seats on institutional planning committees, and provide opportunities to collaboratively construct research agendas and funding proposals.
There is a great deal of focus on team science as a strategy in translational medicine and much work has been done over the last several decades to improve community engagement strategies. However, comparatively little work has focused on articulating the networks of teams involved in CAPHs that are strategically positioned at the edge of the healthcare systems and the communities they serve. These networks of teams are optimally positioned to both perform T4 translation in the community, and also take input from patients and communities to assist in shaping bench and clinical research.6, 7, 8
CAPHs are complex social systems that can be described by at least four levels: Level (1) CAPHs intentionally capitalize on social relationships as part of multifaceted interventions to impact health outcomes. Attempts to change knowledge, attitudes, and behaviors are often spread by trusted community figures (for example, a health navigator employed by a community nonprofit enrolls participants in a study, but also talks about prevention behaviors with the community at large)9, 10; Level (2) CAPHs are typically initiated and maintained through interpersonal connections between individual researchers and individual community partners who are boundary spanners between their respective agencies11; Level (3) CAPHs involve strategic bridging relationships between large academic or healthcare systems and nonprofits in communities with health disparities; and Level (4) while stakeholders in CAPHs often start with different assumptions, values, and expectations, these groups can evolve into ad hoc organizations that can dynamically reorganize to obtain financial, informational and material resources.1
Theoretical and methodological considerations for SNA on CAPHs are discussed in other analogous domains, ranging from health impact of social networks to management of complex, multinational coalitions.3, 12, 13, 14, 15, 16, 17, 18, 19, 20, 21, 22, 23, 24 There are a few foundational SNA studies assessing whether individual community partners from different agencies view their collaboration similarly.25, 26, 27 However, to date, most of the studies involving SNA of CAPH projects use data collected only by surveying individual members of a single CAPH (i.e., Level 2 above).
In contrast, the current study uses an existing administrative data set to describe and analyze linkages between 140 community–academic partnerships funded through the Healthier Wisconsin Partnership Program (HWPP), a regional funding mechanism available to CAPHs in Wisconsin. Thus, this analysis moves up one level of organizational abstraction to consider the strategic relationships between a large set of CAPHs (i.e., Level 3 as described above), rather than the individual social connections within a single partnership. To date, only a handful of studies have looked across such large numbers of community–academic partnerships to examine how this information may be of value to funders, universities, healthcare systems, and communities.28
This research lays the groundwork for probing empirical questions about the potential utility of social network administrative data in improving the efficiency of the CAPH partnership process. Forming and maintaining early partnerships are notoriously resource‐intensive tasks and early partnerships are often “blind” to strategic relationships that may offer critical expertise, physical assets, existing programs, or access to capital. Later stage partnerships may be uniquely positioned to engage in cross‐sector health initiatives, but often these partnerships are so involved with their own operational picture that they cannot afford to search for complementary groups in other sectors. The HWPP administrative data offer an important avenue to explore ways in which the structural information can be used to assist large‐scale CAPH funders and funded partnerships to view these data from a relational, rather than purely numerical perspective.
Thus, this research was approached as exploratory analysis designed to: (1) carefully articulate the data available on HWPP funded CAPHs; (2) provide detailed, reproducible methodological steps accessible to others involved in Community Engagement without in‐depth knowledge of SNA in order to encourage further work in this arena; (3) produce visualizations of the interconnections between community partners that are meaningful both for SNA researchers and those involved in community engagement; and (4) encourage further discussion about the research assumptions and analysis approaches that are best suited to dual‐mode (project/partner) CAPH data.
Two notable limitations of this research are that it does not explore MCW faculty ties to and between partnerships, nor does it compare the networks of successful versus unsuccessful HWPP grant applications. HWPP expressed concerns about potential career and reputational risks for faculty and individual partners. As a result, HWPP requested the analysis be initially limited to agency based data for awarded grants only. Discussions with the funder about how to negotiate these concerns are ongoing and future research will seek to integrate individual level data. Implications of these limitations, as well as theoretical and practical issues involved in advancing this work, are explored in the discussion.
History of the Healthier Wisconsin Partnership Program
In 1999 BlueCross/BlueShield of Wisconsin converted to for‐profit status. Through this conversion process, the Advancing a Healthier Wisconsin (AHW) Endowment was established. As part of the activities of AHW, the Healthier Wisconsin Partnership Program (HWPP) was formed. HWPP was specifically designed as a funding mechanism for CAPHs, focusing on community health interventions, research, and evaluation. HWPP began planning in 2003, and grants were awarded annually starting in 2005 (Cycle 1). Over the 9‐year analysis window, 140 grants (79 short duration Development Awards and 61 longer term Impact Awards) were awarded. Through a shared community‐academic governance model, strategic planning changed the HWPP grant review process, award amounts, and other administrative processes over time. The first strategic plan covered the years 2003–2008 (HWPP strategic period 1), the second strategic plan covered the years 2009–2014 (HWPP strategic period 2). Since its inception, HWPP distributed over $40 million for community–academic partnership projects to improve health in Wisconsin.
Developing an SNA approach to examining HWPP partnerships
The structured nature of HWPP administrative data, availability of information about how awards changed over time, comparatively large number of funded CAPHs, and the researchers’ familiarity with the intricacies of administering these grants in collaboration with community partners led us to believe that these data provided a rich, relatively error free source of social network information about partnerships. The primary goal throughout this effort was to define an approach to further standardizing the data. This allowed formal social network analysis to be performed, while also maintaining a nuanced view of the complexity of CAPHs informed by a Community Engagement in Research (CEnR) perspective.5, 29, 30
The HWPP grant application captures some of the data elements that describe collaborative arrangements typical to CAPHs and enforces some degree of structure on these relationships. Because the funds are administered through the Medical College of Wisconsin (MCW), every application must designate an MCW faculty member as the Primary Investigator and must also identify one community partner as the Primary Community Partner (PCP). Beyond these constraints, many partnership configurations are possible, involving small or large community nonprofits, government agencies, other institutions of higher education, for example.
Example HWPP projects
While our goal is not to delve deeply into the intra‐partnership relationships (Levels 1 and 2 above), the nature and strength of these ties have implications that governed our assumptions about analysis, thus some contextual information driven from project exemplars has both illustrative and analytical utility.
For example, one 2‐year Development award was a project focused on teen HPV prevention and this project involved two community partners, the Boys & Girls Club of Wisconsin and the City of Milwaukee. A larger, multiyear Impact award focused on military veteran reintegration involves six community partners, including a veteran serving nonprofit, a local chapter of a national mental health service agency, the Milwaukee VA Healthcare System, the University of Wisconsin‐Milwaukee, Marquette University, and two 2‐year technical colleges addressing veteran reintegration at a community level.
We concluded that a fairly circumspect view of the HWPP data should be applied in the absence of evidence about the robustness of interactor ties within projects. The implications of this analytical stance are detailed further in the methods, results, and discussion sections. Others may disagree with this constrained view, however, we feel that a robust discussion on analysis approaches that address the different structural views of partnerships (i.e., the levels enumerated above) and across these levels will benefit the field, but that this discussion is best initiated with a view that does not overstep the information available from the data.
Methods
In order to evaluate the network characteristics of the overall HWPP initiative, changes that occurred over time including administrative, strategic planning process and exogenous events had to be identified and systematically addressed. For example, currently HWPP requires projects to specify a primary “Health Focus Areas” and any number of secondary areas. In earlier years, these were referred to as “Health Risk Areas” and submissions were allowed to identify multiple health risk areas without specifying a primary focus. In order to overcome this problem, the project summaries for earlier projects with multiple health risk areas selected were reviewed and a primary health focus area was assigned by one member of the research team. In most cases, this was a straightforward process, but future research could approach this more systematically using independent raters, for example. Details about this process are important to ensure reproducibility and to provide a sense of the types of issues that should be considered when performing this type of research. Table 1 summarizes some of these considerations.
Table 1.
HWPP project characteristics and changes to the program over time
|
|
|
|
|
|
Data cleaning and restructuring for SNA analysis
HWPP administration provided an Excel spreadsheet with initial state information about all of the funded community–academic partnerships. Because of the flat file approach, many partners organizations were entered in the Excel sheet in different ways across partnerships (slight variations in naming, e.g., “Milwaukee Department of Public Health” vs. “Public Health Department, City of Milwaukee”). The first step of analysis involved normalizing these data by creating a nonredundant list of community partners. (Note that throughout, we use HWPP's terminology "community partner" to indicate a community partnering organization, not an individual.)
Centering on appropriate organizational levels
The second step involved data restructuring to center the description of community partners on appropriate organizational levels to use for analysis. Because we needed to identify shared connections between partners across many projects, it became clear that fine grained community partner information (e.g., a subdepartment within a major department of the Wisconsin State Department of Health and Human Services) would be problematic because this would likely result in a partner being associated with only one project and not showing important connections.
To address this, the partnership table was expanded to include all potential hierarchical nestings in each organization. The entire list was reordered by parent organization name and visual analysis was used to identify an appropriate organizational level to include, maximizing the number of ties while preserving domain specificity to the degree possible.
For example, one project listed a partner as the Wisconsin Cancer Reporting System. Examination of the partner led to our understanding that the agency was actually better described as: State of Wisconsin\Division of Public Health\Department of Health Services\Wisconsin Cancer Reporting System. While the Wisconsin Cancer Reporting System only appears once in the data set as a partner, its parent, the Wisconsin Department of Health Services appears across 19 partnerships, providing a more accurate view of the level of engagement of this arm of the Wisconsin state government in community projects. Throughout this process, we elected to describe State of Wisconsin connections at the Department level in all projects.
In contrast, the Special Needs program within Children's Hospital and Health System (CHHS) in Milwaukee was listed as the partner in one project. This was expanded to describe how this partner was organizationally situated: CHHS\Children's Hospital of Wisconsin\Special Needs Program\. Examining the expanded partnership list, five different subdepartments within CHHS were partners to various HWPP projects. CHHS as a whole was selected as the best organizational level to include and the subdepartments were removed from analysis.
Some notable exceptions to this approach included keeping police, fire, EMT and school systems as discrete entities outside of their parent organizations because these agencies played very distinct roles. We elected to keep City Departments of Public Health within their parent organizations, although an argument can be made that these departments play a unique and distinct role from other aspects of city government and are listed much more frequently as partners than other departments.
Temporal comparison
The relative similarity of HWPP project duration and the funders approach to awarding a broad range of grants during this strategic period, coupled with the advent of the global financial crisis provided a fairly natural temporal split between the Cycles 1–4 covered by the 1st HWPP 5‐year strategic plan (2003–2008) and projects covered by the 2nd strategic plan (2009–2014). Available data through 2013 is included in these analyses, with future work anticipated to examine data for the entire second strategic period as data for the 2014 awards becomes available.
HWPP projects in strategic period 1: 2005–2008
A total of 54 Development and 47 Impact grants were awarded from 2005 to 2008. During Cycle 1, the award amounts for Development projects ranged from $10,000 to $25,000 with 1‐year duration. The ceiling award amount for Impact projects was $150,000 and maximum duration was typically three years. By Cycle 4 (2008), the maximum award for Development projects increased to $50,000, while the duration remained at 1 year. The maximum award for an Impact project increased to $450,000 and duration remained at 3 years. Notably, the global economic crisis resulted lower yields to the AHW endowment in 2008 and real‐time budget reductions to HWPP funded projects occurred in that year.
HWPP strategic period 2: 2009–2013
A total of 25 Development and 14 Impact awards were awarded from 2009 to 2013. Based on feedback from community partnerships and the MCW Consortium on Public and Community Health Board, which oversees the HWPP program, award amounts increased and the project periods lengthened in recognition that community health impacts required sustained, long‐term engagement. Ceiling award amounts for Development projects increased to $200,000 and the duration of the projects increased 2 years. Ceiling award amount for Impact projects increased to $750,000 and maximum duration was raised to 5 years. Notably, the global economic crisis led to substantially fewer projects funded in 2009 and no projects funded in 2010.
Network inferences from the HWPP administrative data
While community engagement emphasizes collaborative, mutual involvement of partnering organizations as a fundamental principle, it may be unreasonable to assume that all pairs of community partners interact meaningfully during the course of the project given the types of data available from HWPP. Even in projects with few community partners, it is uncertain whether all pairs of community partners have significant direct contact with each other while carrying out the project. For example, if there are four community‐partnering agencies with one “lead” agency listed on the project, it may be that all three supporting agencies have strong dyadic relationships with the lead agency, but they may not interact much with each other.
Therefore, we focus primarily on the connections between projects and community partners. We keep the data in two‐mode (projects × community partners) format, and do not convert the data into one‐mode format through matrix multiplication. Alternative assumptions could arguably be used, and future research might demonstrate evidence of significant cross dyadic ties that suggest the application of one‐mode analysis. However, because we cannot infer community partners’ direct ties with each other by virtue of comembership on the same project, it is our view that the HWPP data alone do not allow meaningful estimation of some common social network properties, such as centrality/centralization.
Results
The relatively recent application of SNA to CE and unfamiliarity of the approach among community researchers, nonprofit partners, and community members necessitates a brief discussion of SNA in order to frame the data analysis and results. In this descriptive study, network “nodes” are used to represent community partner organizations (blue squares) or HWPP projects (red circles) in the main visualizations. Nodes are connected to each other by lines indicating community partners associated with particular projects. Partners and projects linked directly or indirectly form components (clusters) of the network. Component size grows with the number of projects with one or more partners in common.
There were 140 HWPP funded projects, with 318 nonredundant community partners from 2005 to 2013. The number of community partner organizations per project increased somewhat from 2005–2008 to 2009–2013 (See Table 2). The vast majority of organizations within each period are connected, in single large network “component,” to each other directly through comembership on the same project(s) or indirectly (185 are interconnected in the main component for the 2005–2008 strategic period and 133 in main component for the 2009–2013 strategic period). Thus, although the organizations in the main component for each time period differ, the component distribution (i.e., connectivity of the network) was very similar across the two strategic time periods, with a single large component and a small number of isolates (Table 3). These isolates were typically composed of one or two projects with six or fewer partner organizations, and these projects were not connected to the organizations in the primary component through other shared projects or partnership relationships (Table 3, Figures 1 and 2). Indirect links between organizations in the large component are sometimes quite distal, involving many intervening projects (See Figures 1 and 2). The distal nature of these links may, for example, reflect the very different health targets addressed by HWPP projects, geography, or even time (i.e., some partners with recent HWPP funding may not yet enjoy the same level of interconnectivity as more established partners).
Table 2.
Total number of HWPP projects and partner organizations by time period
| N | |
|---|---|
| Number of HWPP projects | |
| Total projects 2005–2013 | 140 |
| Time period 1: 2005–2008 | 101 |
| Time period 2: 2009–2013 | 39 |
| Number of community partners | |
| Total community partners 2005–2013 | 318 |
| Time period 1: 2005–2008 | 227 |
| Time period 2: 2009–2013 | 152 |
| Community partners spanning time periods | |
| Community partners that appear in both 2005–2008 and 2009–2013 | 61 |
| Appear in 2005–2008 only | 166 |
| Appear in 2009–2013 only | 91 |
| HWPP projects and partners | |
| Mean | Median | SD | Range | |
|---|---|---|---|---|
| Number of community partners per HWPP project | ||||
| 2005–2008 | 3.9 partners | 3 | 3.8 | 1–26 |
| 2009–2013 | 5.1 partners | 4 | 4.0 | 1–15 |
| Number of HWPP projects per community partner | ||||
| 2005–2008 | 1.7 projects | 1 | 1.8 | 1–16 |
| 2009–2013 | 1.3 projects | 1 | 0.9 | 1–9 |
| % Interorganizational ties | ||||
| 2005–2008 to 2009–2013 (continuing) | 8 (mean%) | 5 | 11 | 0–50 |
| 2005–2008 only (noncontinuing)* | 48 (mean%) | 50 | 30 | 0–100 |
*n = 50 because one organization had no collaborators for its projects in either period.
Table 3.
Component distribution
| 2005–2008 Size (number of partners) | Freq. | 2009–2013 size (number of partners) | Freq. |
|---|---|---|---|
| 185 | 1 | 133 | 1 |
| 6 | 2 | 4 | 1 |
| 4 | 1 | 3 | 2 |
| 3 | 3 | 2 | 3 |
| 2 | 4 | 1 | 3 |
| 1* | 9 | – | – |
*Projects with only one partner each, and each of these partners had no other projects.
Figure 1.
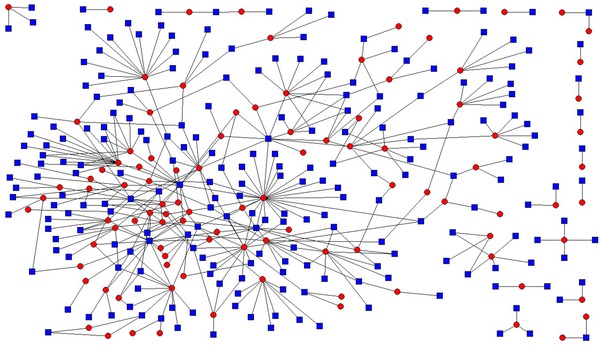
HWPP partnerships; projects (red circles) and partners (blue squares). Time period 1: 2005–2008.
Figure 2.
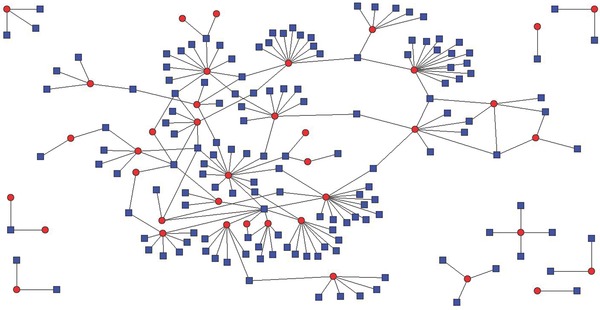
HWPP partnerships; projects (red circles) and partners (blue squares). Time period 2: 2009–2013.
The large majority of community partners were involved in only one time period (i.e., either 2005–2008 or 2009–2013). That is, community partners participating in both periods were uncommon. Community partners participating in both periods were involved in significantly more projects in the first period than those that participated only in the first period (See Table 4). The association between early participation in multiple HWPP projects and successfully obtaining funding in the second HWPP strategic cycle was large, Cohen's d = 0.93.31
Table 4.
Number of projects per organization in 2005–2008 versus 2009—2013
| Strategic period | Mean | Median | SD | Range | Cohen's d * |
|---|---|---|---|---|---|
| For organizations that appear only 2005–2008 | 1.30 | 1 | 0.58 | 1–3 | 0.93 |
| For organizations that also appear in 2009–2013 | 2.87 | 2 | 3.11 | 1–16 | Randomization test p < 0.00001 |
*Cohen's d is the standardized mean difference, a measure of effect size. Rule of thumb Cohen's d values for effect size are small, 0.2; medium, 0.5; and large, 0.8 or greater. These values are relative and should be adjusted as information about typical effect sizes for a given domain become available.
Project comembership ties formed by participation in HWPP projects tended to be transient. Among community partners that were in projects in both 2005–2008 and 2009–2013, on average only 8% of a community partner's project comemberships were present in both periods (see Table 2, %project comemberships). New projects may have changed health domains, potentially requiring different partners.
These results indicate that the overall structure of the interorganizational network was stable over time; the number of organizations involved in each project increased over time; active organizations involved in early funded projects were more likely to participate in later projects; and project comembership ties formed in 2005–2008 tended not to persist into 2009–2013 for those community partners that participated in both periods. Transient comembership ties for these partners present in both time periods may, for example, reflect changes in project focus (e.g., a substitution occurs because a different partner organization offers deeper topical expertise) or changing strategic positions of community organizations over time (e.g., the project no longer fits the primary objectives of a given partner), necessitating shuffles in organizational collaborators on a project. These are just some of the imaginable scenarios; integrating new and existing research regarding the transience of project comembership ties from traditional methods of inquiry on CAPHs to this type of SNA research is an important area for future inquiry.
Community partners’ project comembers rarely persisted from one period to the next. This result is consistent with the idea that connections between project comembers cannot be automatically assumed. Empirical studies focused on describing community partners’ involvement in projects and interactions with each other would be valuable for determining the circumstances in which direct ties between project comembers can be reasonably inferred.
In addition to the results for the overall network, we also produced visualizations for projects within each HWPP Health Risk Area. Two health risk area visualizations are presented, mental health (Figure 3a) and injury and violence (Figure 3b). Next, in order to demonstrate how this information might be made practically useful to funders, partnering academics, and community agencies, we combined these data so that mental health and injury and violence projects and partners are displayed in a single visualization (Figure 4a), and finally a callout section shows how these different project types are related through shared partners (Figure 4b). These risk areas were selected because both have a fairly large number of projects and partners, thus maximizing the likelihood of overlap. Note that the layouts of the network in Figures 3a and b differ from Figures 4a and b, but the connections between the projects and partners involved are not different. Differences simply represent visualization optimization changes produced by NetDraw software as we focus on particular aspects of the network.
Figure 3.
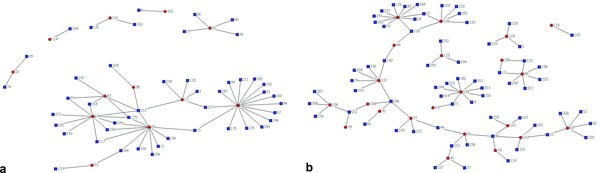
Health focus areas—(a) mental health; (b) injury and violence viewed separately.
Figure 4.
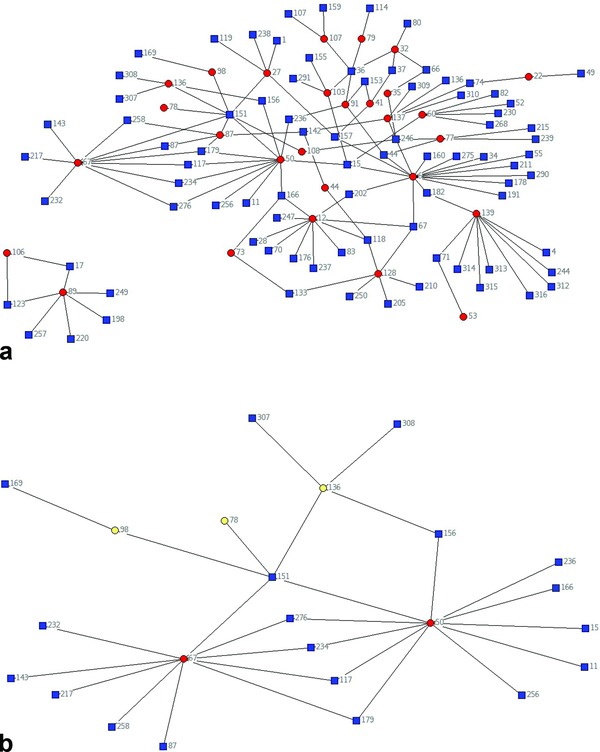
Combined heath focus areas and shared partnering organizations—(a) mental health and injury and violence health areas combined into a single visualization; (b) detail of highlighted projects from different health focus areas that share partners.
In this particular case, the partners shared between the two project types are the County of Milwaukee and the City of Milwaukee Police Department. Although the same information can be gathered through standard queries of the data rather than SNA, the visualizations may provide additional utility as stakeholders can overlay visual depiction of multiple interrelationships with their own knowledge of the landscape of community–academic partnerships. It is possible, for example, to imagine that future projects in either Risk Area might consider including one or more of these bridging organizations early on, especially if the intention is ensure broader systemic impact. Alternatively, community partnerships that share fewer connections to other organizations might elect to include or consult with these bridging organizations in order to more efficiently develop a broader range of organizational relationships, or mature partnerships might leverage this information to form cross Risk Area coalitions to address complex, multifactor health problems using a comprehensive, upstream approach. Additional potential uses of this information are considered in the discussion.
Discussion
This research was performed because relatively little is known about the social organization of CAPHs in general. More specifically, understanding interrelationships among large numbers of CAPHs has strategic value for communities, major funders, healthcare organizations, and government agencies addressing population health issues. While CAPH targeted funding sources like HWPP are uncommon, there are a number of other geographic regions in the US supporting intensive CAPH activity that might replicate and extend this approach, ultimately articulating overlapping social networks across large regions and multiple health domains. Further, the visual representation of this information may provide deeper insights for major funders and policy makers to better understand how their resources can encourage alignment and maximize impact. This visual information may also allow community organizations to better understand potential future collaborations that might otherwise go unrecognized, identify latent resources from prior partnerships that could be reactivated, or to gain awareness of others doing similar work in other geographic locations, and so on.
Areas for future work
Open data standard for CAPHs
In order to achieve these goals, several intermediate steps must be taken. First, the time required to obtain, clean, and organize CAPH data for SNA must be reduced. This suggests that an open data standard should be adopted by major regional and national funders supporting CAPHs, so current and historical information about each partnership is systematically maintained. There are, of course, nuances in how each funder describes partnerships that are important to preserve, but a consensus approach to data management also holds the promise of deeper insight into the “ecosystem” of CAPHs.
Visualization for community partners
Through an ongoing conversation with community partners about how community health informatics can assist nonprofits, it is clear that data fusion and data visualization are areas of significant need for both individual community partners and for multipartner CAPHs.32, 33 What is less clear is if the SNA visualizations that are useful to researchers are meaningful for community members and agencies. Research on ways to describe the CAPH social networks that are overlaid with geographical, population health, environmental, and/or built environment data to assist community partners contextualize this information and to see potential linkages between CAPHs is needed.34 Simple linkages might include fostering strategic alliances between partnerships that are geographically close by and working on similar health issues. At the most complex, potential interrelationships between geographically distal partners, temporally distant partners (e.g., groups that were active in past funding cycles) or working on different, yet interrelated problems (e.g., an environmentally focused partnership working to reduce environmental toxins and another addressing asthma in children) might be better able to understand their strategic value to one another.35 Community partners may also be able to use SNA visualizations to illustrate areas for potential innovation and intervention to funders and policymakers.
Visualization for funders and major institutions
While funders typically attend to macrolevel considerations, SNA can offer detailed insight into partnership activities at the mesolevel in communities. The ties described in SNA may be influenced by funding, but also represent natural strategic alliances between nonprofits. Using administrative data in this fashion provides a relatively inexpensive approach for funders to learn from the community partners they seek to support. Further, while forcing strategic alliances between CAPHs may run counter to CE principles, this deeper understanding may assist funders to tailor requests for proposals to encourage cross domain collaboration in extended groups of CAPHs.36 With dynamic updating it may ultimately be possible for funders to provide “just‐in‐time” suggestions to applicants early in the application process.37, 38 Dynamic availability of CAPH visualizations may have numerous implications for policy, funding, and situational awareness among state, regional, and federal agencies.39
Conclusions
A major limitation of this research is that faculty ties (which implicitly bind MCW to each HWPP supported CAPH) are not considered here. Another limitation is that HWPP Cycle 9 projects slated to begin in 2014 were not included because funding decisions were not available when the analysis was performed. Future research should integrate primary faculty partners and explore their role as bridging agents between disparate projects and partners.
Areas for further examination include evaluating community agency characteristics (e.g., number of employees, annual budget, geographical location, etc.) on the number and quality of ties to other HWPP funded projects; exploring faculty characteristics (e.g., department, career stage, and orientation toward CE) to identify predictors of CAPH formation and maintenance; exploring networks by health domain focus; orphan projects and partners not connected to larger component structure; and comparing projects and partnerships that did vs. did not receive funding.
Theory generation incorporating approaches from CE and SNA perspectives is key to advancing research in this arena. For example, while scaling up community‐based interventions is generally viewed as desirable, large coalitions also present specific governance and sustainability challenges—in part because CAPHs are often predicated on relationships between individual academics and community representatives (level 2 in intro). Further, while sophisticated SNA techniques exist that may be particularly applicable to this domain and provide avenues for hypothesis testing, CE specialists need further training to gather appropriate data, apply these analysis strategies, and interpret the results both internally and collaboratively with the communities they serve.
Funding/Support
This project is funded by the Clinical and Translational Science Institute of Southeast Wisconsin, a recipient of a National Clinical and Translational Science Award 8UL1TR000055 and by Advancing a Healthier Wisconsin Research and Education Initiative Fund, a component of the Advancing a Healthier Wisconsin endowment at the Medical College of Wisconsin. All of the opinions expressed are the authors’ and do not necessarily reflect the policies or views of the funders.
Acknowledgments
The authors wish to thank Christina Ellis, HWPP Program Manager, and Timothy Meister, HWPP Program Coordinator for Evaluation, for their insight and assistance in accessing organizational data from HWPP.
References
- 1. Haythornthwaite C. Social network analysis: an approach and technique for the study of information exchange. Libr Inf Sci Res. 1996; 18(4): 323–342. [Google Scholar]
- 2. Christakis N, Fowler J. The spread of obesity in a large social network over 32 years. NEJM. 2007; 375(4): 370–379. [DOI] [PubMed] [Google Scholar]
- 3. Christakis NA, Fowler JH. The collective dynamics of smoking in a large social network. N Engl J Med. 2008; 358(21): 2249–2258. [DOI] [PMC free article] [PubMed] [Google Scholar]
- 4. Aguilar‐Gaxiola S, Ahmed S, Franco Z, Kissack A, Gabriel D, Hurd T, Ziegahn L, Bates NJ, Calhoun K, Carter‐Edwards L, et al. Towards a unified taxonomy of health indicators: academic health centers and communities working together to improve population health. Acad Med. 2014; 89: 564–572. [DOI] [PMC free article] [PubMed] [Google Scholar]
- 5. Lloyd Michener M, Cook J, Ahmed SM, Yonas MA, Coyne‐Beasley T, Aguilar‐Gaxiola S. Aligning the goals of community‐engaged research: why and how academic health centers can successfully engage with communities to improve health. Acad Med. 2012; 87(3): 285–291. [DOI] [PMC free article] [PubMed] [Google Scholar]
- 6. Hall KL, Feng AX, Moser RP, Stokols D, Taylor BK. Moving the science of team science forward: collaboration and creativity. Am J Prev Med. 2008; 35(2): S243–S249. [DOI] [PMC free article] [PubMed] [Google Scholar]
- 7. Stokols D, Hall KL, Taylor BK, Moser RP. The science of team science: overview of the field and introduction to the supplement. Am J Prev Med. 2008; 35(2): S77–S89. [DOI] [PubMed] [Google Scholar]
- 8. Calhoun WJ, Wooten K, Bhavnani S, Anderson KE, Freeman J, Brasier AR. The CTSA as an exemplar framework for developing multidisciplinary translational teams. Clin Transl Sci. 2013; 6(1): 60–71. [DOI] [PMC free article] [PubMed] [Google Scholar]
- 9. Minkler M, Wallerstein N. Community‐based participatory research for health: From process to outcomes: Wiley.com; 2010.
- 10. Minkler M, Wallerstein N, Wilson N. Improving health through community organization and community building. Health Behav. Health Educ.: Theor., Res., Prac. 1997; 3: 279–311. [Google Scholar]
- 11. Weerts DJ, Sandmann LR. Community engagement and boundary‐spanning roles at research universities. J Higher Educ. 2010; 81(6): 702–727. [Google Scholar]
- 12. Cacioppo JT, Fowler JH, Christakis NA. Alone in the crowd: the structure and spread of loneliness in a large social network. J Personal Soc Psychol. 2009; 97(6): 977– 991. [DOI] [PMC free article] [PubMed] [Google Scholar]
- 13. Christakis NA, Fowler JH. The spread of obesity in a large social network over 32 years. N Engl J Med. 2007; 357(4): 370–379. [DOI] [PubMed] [Google Scholar]
- 14. Fowler JH, Christakis NA. Dynamic spread of happiness in a large social network: longitudinal analysis over 20 years in the Framingham Heart Study. BMJ. 2008; 337: a2338. [DOI] [PMC free article] [PubMed] [Google Scholar]
- 15. Mednick SC, Christakis NA, Fowler JH. The spread of sleep loss influences drug use in adolescent social networks. PloS one. 2010; 5(3): e9775. [DOI] [PMC free article] [PubMed] [Google Scholar]
- 16. Rosenquist JN, Murabito J, Fowler JH, Christakis NA. The spread of alcohol consumption behavior in a large social network. Ann Inter Med. 2010; 152(7): 426–433. [DOI] [PMC free article] [PubMed] [Google Scholar]
- 17. Fuller CM, Borrell LN, Latkin CA, Galea S, Ompad DC, Strathdee SA, Vlahov D. Effects of race, neighborhood, and social network on age at initiation of injection drug use. J Info. 2005; 95(4): 689–695. [DOI] [PMC free article] [PubMed] [Google Scholar]
- 18. Zohar D, Tenne‐Gazit O. Transformational leadership and group interaction as climate antecedents: a social network analysis. J Appl Psychol. 2008; 93(4): 744–757. [DOI] [PubMed] [Google Scholar]
- 19. Ghoshal S, Bartlett CA. The multinational corporation as an interorganizational network. Acad Manage Rev. 1990; 15(4): 603–626. [Google Scholar]
- 20. Mendonca D, Wallace WA. Studying organizationally‐situated improvisation in response to extreme events. Int J Mass Emerg Disas. 2004; 22(2): 5–30. [Google Scholar]
- 21. Fleming L, Mingo S, Chen D. Collaborative brokerage, generative creativity, and creative success. Admin Sci Quart. 2007; 52(3): 443–475. [Google Scholar]
- 22. Emilie M, Hafner‐Burton MK. Network analysis for international relations. Int Org. 2009; 63: 559–592. [Google Scholar]
- 23. de Toni AF, Nonino F. The key roles in the informal organization: a network analysis perspective. Learn Org. 2010; 17(1): 86–103. [Google Scholar]
- 24. Cross R, Prusak L. The people who make organizations go‐or stop. Harv Bus Rev. 2002; 80(6): 104–112. [PubMed] [Google Scholar]
- 25. Tanjasiri SP, Tran JH, Palmer PH, Valente TW. Network analysis of an organizational collaboration for Pacific Islander cancer control. J Health Care Poor Underser. 2007; 18(6): 184–196. [DOI] [PubMed] [Google Scholar]
- 26. Valente TW, Fujimoto K, Palmer P, Tanjasiri SP. A network assessment of community‐based participatory research: linking communities and universities to reduce cancer disparities. American Journal of Public Health 2010; 100(7): 1319–1325. [DOI] [PMC free article] [PubMed] [Google Scholar]
- 27. Luque J, Martinez Tyson D, Lee JH, Gwede C, Vadaparampil S, Noel‐Thomas S, Meade C. Using social network analysis to evaluate community capacity building of a regional community cancer network. J Commun Psychol. 2010; 38(5): 656–668. [DOI] [PMC free article] [PubMed] [Google Scholar]
- 28. Sandy M, Holland BA. Different worlds and common ground: community partner perspectives on campus‐community partnerships. Mich J Commun Serv Learn. 2006; 13(1): 30–43. [Google Scholar]
- 29. Ahmed SM, Palermo A‐GS. Community engagement in research: frameworks for education and peer review. Am J Publ Health. 2010; 100(8): 1380–1387. [DOI] [PMC free article] [PubMed] [Google Scholar]
- 30. Newton G. Overcoming barriers to effective community‐based participatory research in US medical schools. Educ Health. 2004; 17(2): 141–151. [DOI] [PubMed] [Google Scholar]
- 31. Cohen J. Statistical power analysis for the behavioral sciences. New York: Psychology Press; 1988. [Google Scholar]
- 32. Goovaerts P. Three‐dimensional visualization, interactive analysis and contextual mapping of space‐time cancer data. Paper presented at: Proceedings of 13th Agile international conference. Guimarães, Portugal 2010.
- 33. Buckingham W. Capturing qualitative spatial data to understand social epidemiology in public health. The Journal of Community Informatics 2012. Available at: http://ci‐journal.net/index.php/ciej/article/view/837/1003. [Google Scholar]
- 34. Shneiderman B. Technology‐mediated social participation: the next 25 years of HCI challenges Human‐computer interaction. Design and development approaches. New York: Springer; 2011: 3–14. [Google Scholar]
- 35. Cross R, Borgatti SP, Parker A. Making invisible work visible: using social network analysis to support strategic collaboration. Calif Manage Rev. 2002; 44(2): 25–46. [Google Scholar]
- 36. Tsai W, Ghoshal S. Social capital and value creation: The role of intrafirm networks. Acad Manage J. 1998; 41(4): 464–476. [Google Scholar]
- 37. Hsu WH, King AL, Paradesi MS, Pydimarri T, Weninger T. Collaborative and Structural Recommendation of Friends using Weblog‐based Social Network Analysis. Paper presented at: AAAI Spring Symposium: Computational Approaches to Analyzing Weblogs 2006.
- 38. Maaradji A, Hacid H, Daigremont J, Crespi N. Towards a social network based approach for services composition. Paper presented at: Communications (ICC), 2010 IEEE International Conference on 2010.
- 39. Wang F‐Y, Carley KM, Zeng D, Mao W. Social computing: from social informatics to social intelligence. Intelligent Systems, IEEE. 2007; 22(2): 79–83. [Google Scholar]