Abstract
Anemia of CKD seems to be related to impaired production of renal erythropoietin (Epo). The glycosylation pattern of Epo depends on the synthesizing cell and thus, can indicate its origin. We hypothesized that synthesis of Epo from nonkidney cells increases to compensate for insufficient renal Epo production during CKD. We determined plasma Epo levels and Epo glycosylation patterns in 33 patients with CKD before undergoing dialysis and nine patients with CKD undergoing dialysis. We compared these values with values obtained in healthy volunteers and other controls. Although patients with CKD before undergoing dialysis had median (interquartile range) Epo levels higher than those of healthy controls (13.8 IU/L; interquartile range, 10.0–20.7 IU/L versus 8.4 IU/L; interquartile range, 7.6–9.0 IU/L; P<0.01), these patients were moderately anemic (mean±SD; hemoglobin =118±17 g/L). Detected as the percentage of migrated isoforms (PMI), Epo glycosylation in patients with CKD before undergoing dialysis (PMI=36.1±11.7%) differed from that in healthy controls (PMI=9.2±3.8%; P<0.01) but not from that in umbilical cord plasma (PMI=53.9±10.6%; P>0.05), which contains mainly liver-derived Epo. Furthermore, glycosylation modification correlated with eGFR loss. These results suggest that patients with CKD maintain persistent Epo synthesis despite declining renal function, and this maintenance may result in part from increased liver Epo synthesis.
Keywords: anemia, chronic kidney disease, erythropoietin
Anemia is a frequent complication of CKD. The origin of anemia in CKD remains debated but is generally assumed to be related to inadequate erythropoietin (Epo) synthesis by diseased kidneys.1 One mechanism proposed for the failure of kidneys to synthesize Epo in adequate amounts is the conversion of peritubular fibroblasts into α-smooth muscle actin–expressing myofibroblasts, thereby losing their ability to secrete Epo.2 However, a functional defect in oxygen sensing may also contribute to decreased renal Epo production as suggested by the observation that pharmacologic hypoxia inducible factor (HIF) stimulation increases kidney Epo synthesis in patients on dialysis.3 Surprisingly, in a large cohort of patients with CKD and anemia, circulating Epo levels were only moderately suppressed at early stages of disease compared with expected values.4 In addition to kidney fibroblasts, liver cells and astrocytes may also synthesize Epo and thereby, contribute to circulating Epo levels.5,6 This contribution may increase when the kidneys are unable to secrete sufficient Epo to maintain erythropoiesis, and an experimental report suggested that liver Epo synthesis is activated in mice suffering from chronic GN.7 Furthermore, even patients who are anephric increase their Epo levels in response to pharmacologic HIF stimulation, implying that other sites than the kidney are involved in Epo production during CKD.3 Accordingly, we tested the hypothesis in this study that patients with CKD may intensify the contribution of nonkidney-synthesized Epo. For this purpose, blood samples obtained from patients with stages 2–5 CKD were compared with those collected from healthy controls with respect to their Epo glycolysation pattern, which is specific to its synthesizing cell.8,9 We also analyzed Epo glycosylation in nine patients on dialysis not treated with recombinant human erythropoietin (rhEpo).
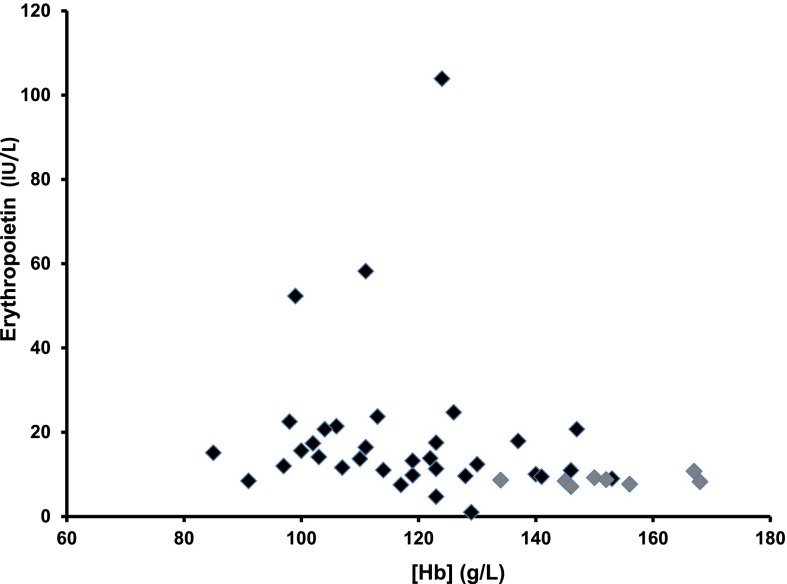
The mean eGFR according to the Chronic Kidney Disease Epidemiology Collaboration equation in patients with CKD before dialysis was 33±15 ml/min per 1.73 m2. Their mean hemoglobin (Hb) concentration was 118±17 g/L, mean corpuscular volume was 91±6 fl, and mean corpuscular Hb was 29±2.3 pg per cell. The origin of CKD was vascular or diabetic in the majority of patients. Plasma Epo concentrations were higher in patients with CKD compared with healthy controls (13.8 IU/L; interquartile range, 10–20.7 IU/L versus 8.4 IU/L; interquartile range, 7.6–9 IU/L; P<0.01) (Figure 1). To correct for anemia, we calculated the predicted Epo values according to [Hb] levels4: predicted log10(Epo) =4.46− (0.274× [Hb in grams per deciliter]). Predicted values did not differ (P=0.20) from the observed values. Altogether, in patients before dialysis, 18 patients presented a ratio of Epo-to-predicted Epo under one, whereas 15 had a ratio above one.
Figure 1.
Plasma Epo concentrations (international units per liter) in relation to Hb levels (grams per liter) in healthy control volunteers (gray diamonds) and patients with CKD (black diamonds).
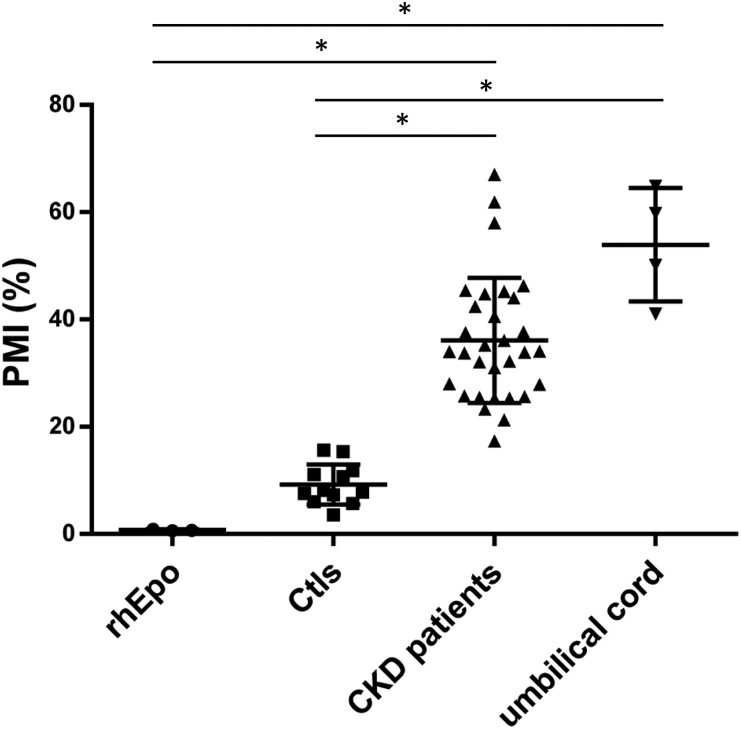
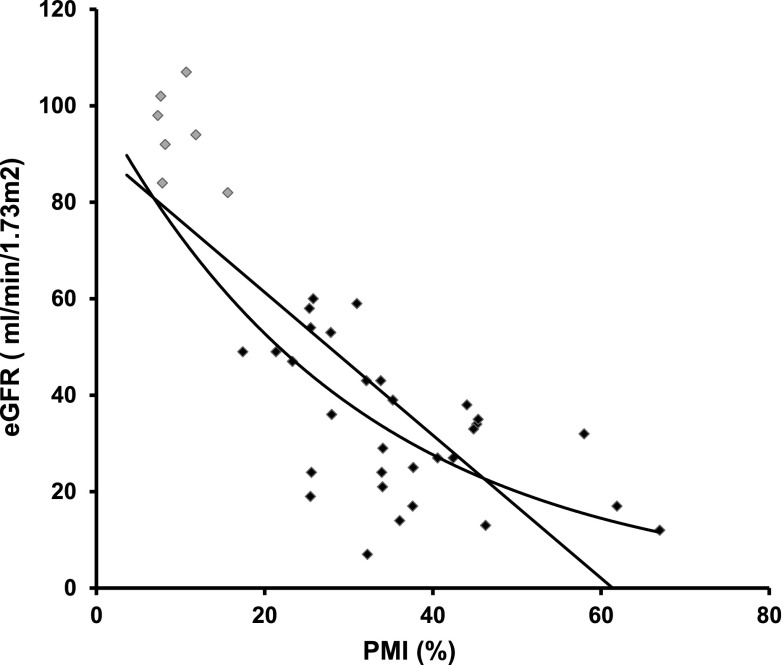
The Epo values of patients with CKD before dialysis exhibited different glycosylation patterns (detected as percentage of migrated isoforms [PMI]) compared with those observed in healthy controls (Figure 2). PMI could not be assessed in two patients for technical reasons. Patients with CKD had PMI values higher than those of healthy controls and rhEpo-containing samples. Patients with CKD exhibited glycosylation patterns very similar to the umbilical cord samples, which are considered to be mainly of hepatic origin5,9 (Figure 2). Using absolute PMI values, patients with CKD presented a PMI of 36.1±11.7% that was markedly higher than that in healthy controls (9.2±3.8%; P<0.01) and furthermore, also higher compared with rhEpo–containing control samples (1.4±1.4%; P<0.01), whereas the CKD PMI values did not differ from the PMI values from venous umbilical cord plasma samples (53.9±10.6%; P>0.05). The similitude between the glycosylation patterns of CKD Epo and those of umbilical cord Epo suggests that part of the circulating Epo levels in patients with CKD is of liver origin. Hence, the closer the PMI value is to the PMI of the umbilical cord samples, the higher a fraction of hepatic-derived Epo. We observed an inverse correlation between PMI and eGFR as illustrated in Figure 3. The association could be either linear or exponential, and correlation factors were significant using both PMI and log(PMI) in correlation to eGFR: R=−0.79 versus PMI and R=−0.88 versus log(PMI); P<0.001. When considering only patients with CKD, the correlation was still highly significant: R=−0.53 for PMI and R=−0.55 for log(PMI); P=0.001. This suggests that the lower the renal function, the more important the hepatic synthesis of Epo. We cannot, however, fully exclude that other Epo synthesis sites may also contribute or that local conditions within the kidney may alter Epo glycosylation by renal fibroblasts, although the similitude of the glycosylation pattern to umbilical Epo and previous work rather suggests a hepatic origin. Indeed, in mice suffering from progressive GN, liver Epo synthesis seems to be enhanced,7 whereas Bernhardt et al.3 reported that HIF stimulation increases Epo levels, even in patients who are anephric. Our results are also in line with previous observations in patients on dialysis; data interpretation, however, is difficult because of simultaneous rhEpo treatment.8
Figure 2.
Scatterplot with mean and SD of Epo glycosylation pattern (determined as PMI) in rhEpo, healthy control volunteers (Ctls), patients with CKD before dialysis, and four umbilical cord samples. PMI values are directly related to the glycosylation pattern of Epo and hence, indicative of synthesizing cell. Hence, an increase in PMI value toward umbilical cord values would be a consequence of a sample containing both renal and hepatic Epo. *P<0.01.
Figure 3.
Inverse correlation between the eGFR (milliliters per minute per 1.73 m2) and PMI in healthy control volunteers (gray diamonds) and patients with CKD (black diamonds).
Several patients with CKD displayed higher Epo levels than expected for their [Hb], suggesting that other factors than Epo deficiency may contribute to anemia of CKD.4 Glycosylation changes may influence both Epo binding to its receptor and its half-life.10,11 A higher PMI suggests less glycosylated Epo. With a less glycosylated Epo, one could expect a higher affinity to the receptor and a shorter half-life of Epo. It may also, however, depend on the type of glycosylation changes. It is currently unclear how the changes in glycosylation that we observe will modify erythrogenicity of Epo in our setting. Other factors are also likely to influence this apparent diminished effect of Epo in CKD. Indeed, circulating inhibitors of erythropoiesis and alterations of iron metabolism may play important roles.12 Carbamylation was recently described as a factor inducing resistance to rhEpo treatment.13 We, therefore, assessed albumin carbamylation as a marker for total carbamylation. As expected, the percentage of carbamylated albumin (c-alb) was higher in patients with CKD than in controls (4.4%; interquartile range, 3.6%–6.1% versus 8%; interquartile range, 6.4%–10.5%; P<0.01). Percentage of c-alb displayed a negative correlation to [Hb] level [R=−0.35 for c-alb and R=−0.39 for log(c-alb); P<0.05], suggesting that carbamylation may contribute also to endogenous Epo resistance in CKD. We observed, however, no correlation between albumin carbamylation and PMI, suggesting that the two processes are independent.
Most patients with advanced CKD displayed lower Epo compared with their [Hb] level, despite apparently increased liver synthesis, which is consistent with previous observations.4 This suggests that the liver may reactivate Epo synthesis with CKD but without compensating fully for deficient kidney Epo when it is beyond a given threshold. This may be related to the maximal capacity of the liver to produce Epo in adults, a shorter half-life of the produced Epo, or altered hypoxia sensing in liver as suggested by previous observations.3 Finally, the stimulus for the increased hepatic synthesis of Epo with CKD or changes in glycosylation pattern remains undetermined. We observed no correlations between PMI and [Hb] or Epo levels, but a strong correlation between PMI and eGFR (Figure 3). There may, therefore, be crosstalk between the kidney and the liver to enhance Epo synthesis when renal function decreases or alternatively, a progressive alteration of Epo glycosylation within the kidney with CKD.
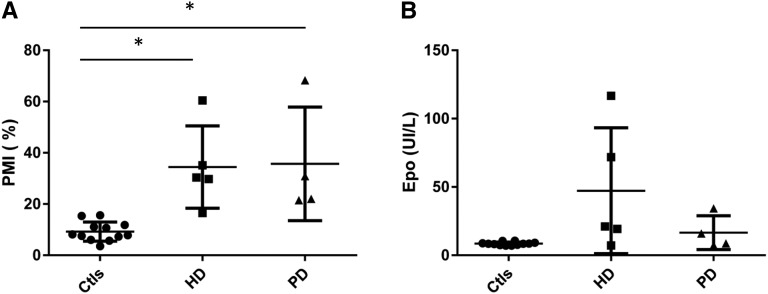
Finally, we assessed Epo levels and PMI in five patients undergoing hemodialysis and four patients on peritoneal dialysis not receiving rhEpo. In these patients, we observed higher PMI values compared with healthy controls (Figure 4). When combining all patients on dialysis, their PMI profile was different from controls but not from patients with CKD before dialysis (9.2±3.8% in controls versus 36.1±11.7% in patients with CKD and 35±17.8% in patients on dialysis; P<0.01 versus controls). However, both PMI and Epo levels were highly variable in this population (Figure 4). The variability of PMI and Epo values may be explained by individual factors, such as the presence of kidney cysts. Indeed, the patients displaying the lowest PMI and highest Epo levels were suffering from autosomal dominant polycystic disease and secondary kidney cysts. Of note, by selecting only patients not treated by rhEpo, we likely included a specific patient population displaying higher residual kidney Epo synthesis. It is likely that the proportion of hepatic Epo would be higher in the majority of patients on dialysis requiring rhEpo as suggested by the study by Lönnberg et al.8
Figure 4.
Scatterplot with mean and SD of (A) Epo glycosylation pattern (determined as PMI) and (B) Epo values in healthy control volunteers (Ctls), five patients undergoing hemodialysis (HD), and four patients on peritoneal dialysis (PD) not receiving rhEpo. *P<0.05.
In conclusion, our study shows that Epo glycosylation is modified with CKD in relation to kidney function loss. Our observations suggest that liver–derived Epo synthesis may partly compensate for deficient kidney Epo synthesis in terms of circulating Epo concentrations and that liver synthesis is proportional to the decline in eGFR. Finally, the efficiency of this Epo with modified glycosylation profile regarding erythropoiesis is unknown.
Concise Methods
Patients and Healthy Volunteers
In total, 33 (28 men and five women; age =67±12 years old) patients with CKD stages 2–5 not on dialysis and not treated with rhEpo and followed at the nephrology outpatient clinic at the University Hospital of Geneva were included. Additionally, nine patients on dialysis, five patients on hemodialysis (two men and three women; mean age =63±14 years old), and four patients on peritoneal dialysis (four men; mean age =64±9 years old) were included. Healthy individuals (six men and six women; age =31±7.5 years old) served as controls. Creatinine values were available for seven of the controls, and Hb levels were available for eight. All participants signed an informed consent. The study was approved by the local ethical committee for human studies of the Canton of Geneva (CER 11–112) and performed according to the Declaration of Helsinki principles.
Measurements
Total plasma Epo concentrations were determined in duplicates by using a solid–phase sandwich ELISA kit (Human Erythropoietin Quantikine IVD ELISA Kit, Quantikine; R&D Systems, Minneapolis, MN). An Epo purification kit from MAIIA Diagnostics (Uppsala, Sweden) was used to purify Epo from patient and control plasma samples and four umbilical cord plasma samples obtained from the University Hospital of Zürich.9 The purifications were performed according to the directions by the company, which are briefly described here: 1.5–2 ml plasma was diluted in sample dilution buffer to a final volume of 20 ml and loaded to disposable anti–Epo columns with immobilized monoclonal anti–Epo antibody 3F6, which very specifically captures both endogenous and rhEpo. The Epo was eluted with 50 μl desorption buffer into Eppendorf tubes containing 5 μl adjustment buffer containing Tween 20 and BSA. The samples were stored at −20°C until further use. Plasma Epo levels were estimated in the purified Epo samples14 and showed high correlation to the ELISA kit values: R=0.83 between log(Epo); P<0.01.
Epo glycosylation pattern was determined using a commercially available kit (MAIIA Diagnostics) as previously described.9 Healthy volunteers were used as controls for kidney Epo, whereas umbilical cord Epo and rhEpo provided in the MAIIA Diagnostics Kit were used as controls for liver-derived Epo and synthetic Epo, respectively. PMI as a percentage is calculated as the ratio of Epo migration in a low versus high N-acetylglucosamine–containing solution for a given sample.
Albumin carbamylation was determined in batch on serum samples as previously described.13,15
Statistical Analyses
Measurements are expressed as means±SDs or medians (interquartile ranges) according to the distribution. Normality was tested using the Shapiro–Francia test for normally distributed data. Distribution of Epo values was non-normal, and log(Epo) was used for analysis and correlation. Distribution of c-alb was non-normal. For comparisons, given the small number of observations and with the intent to be more conservative, we used nonparametric tests: Mann–Whitney for two-groups analysis and Kruskal–Wallis for multiple comparisons. Post hoc analyses were then performed using the Dunn test to obtain P values between the subgroups. For correlation analyses, we performed Pearson tests if one variable was normally distributed. We report R coefficients and P values after controlling the linear associations with scatterplots. Because of the small numbers of patients, we did not conduct multivariate analyses. Statistical analyses were performed using STATA 13.0 (StataCorp., College Station, TX).
Disclosures
None.
Acknowledgments
We thank Chantal Martinez for technical assistance. We also thank Soren Christensen for collaboration.
This work was funded by a grant from the National Center for Competence in Research Kidney.CH (to S.d.S. and C.L.).
Footnotes
Published online ahead of print. Publication date available at www.jasn.org.
References
- 1.McGonigle RJ, Wallin JD, Shadduck RK, Fisher JW: Erythropoietin deficiency and inhibition of erythropoiesis in renal insufficiency. Kidney Int 25: 437–444, 1984 [DOI] [PubMed] [Google Scholar]
- 2.Asada N, Takase M, Nakamura J, Oguchi A, Asada M, Suzuki N, Yamamura K, Nagoshi N, Shibata S, Rao TN, Fehling HJ, Fukatsu A, Minegishi N, Kita T, Kimura T, Okano H, Yamamoto M, Yanagita M: Dysfunction of fibroblasts of extrarenal origin underlies renal fibrosis and renal anemia in mice. J Clin Invest 121: 3981–3990, 2011 [DOI] [PMC free article] [PubMed] [Google Scholar]
- 3.Bernhardt WM, Wiesener MS, Scigalla P, Chou J, Schmieder RE, Günzler V, Eckardt KU: Inhibition of prolyl hydroxylases increases erythropoietin production in ESRD. J Am Soc Nephrol 21: 2151–2156, 2010 [DOI] [PMC free article] [PubMed] [Google Scholar]
- 4.Mercadal L, Metzger M, Casadevall N, Haymann JP, Karras A, Boffa JJ, Flamant M, Vrtovsnik F, Stengel B, Froissart M NephroTest Study Group : Timing and determinants of erythropoietin deficiency in chronic kidney disease. Clin J Am Soc Nephrol 7: 35–42, 2012 [DOI] [PMC free article] [PubMed] [Google Scholar]
- 5.Dame C, Fahnenstich H, Freitag P, Hofmann D, Abdul-Nour T, Bartmann P, Fandrey J: Erythropoietin mRNA expression in human fetal and neonatal tissue. Blood 92: 3218–3225, 1998 [PubMed] [Google Scholar]
- 6.Masuda S, Okano M, Yamagishi K, Nagao M, Ueda M, Sasaki R: A novel site of erythropoietin production. Oxygen-dependent production in cultured rat astrocytes. J Biol Chem 269: 19488–19493, 1994 [PubMed] [Google Scholar]
- 7.Yamaguchi-Yamada M, Akashi N, Goto Y, Anan S, Yamamoto Y, Ogura A, Manabe N: Erythropoietin-producing cells in the liver of ICR-derived glomerulonephritis (ICGN) mice. J Vet Med Sci 68: 65–68, 2006 [DOI] [PubMed] [Google Scholar]
- 8.Lönnberg M, Garle M, Lönnberg L, Birgegård G: Patients with anaemia can shift from kidney to liver production of erythropoietin as shown by glycoform analysis. J Pharm Biomed Anal 81-82: 187–192, 2013 [DOI] [PubMed] [Google Scholar]
- 9.Lundby AK, Keiser S, Siebenmann C, Schäffer L, Lundby C: Kidney-synthesized erythropoietin is the main source for the hypoxia-induced increase in plasma erythropoietin in adult humans. Eur J Appl Physiol 114: 1107–1111, 2014 [DOI] [PubMed] [Google Scholar]
- 10.Elliott S, Egrie J, Browne J, Lorenzini T, Busse L, Rogers N, Ponting I: Control of rHuEPO biological activity: The role of carbohydrate. Exp Hematol 32: 1146–1155, 2004 [DOI] [PubMed] [Google Scholar]
- 11.Darling RJ, Kuchibhotla U, Glaesner W, Micanovic R, Witcher DR, Beals JM: Glycosylation of erythropoietin affects receptor binding kinetics: Role of electrostatic interactions. Biochemistry 41: 14524–14531, 2002 [DOI] [PubMed] [Google Scholar]
- 12.Babitt JL, Lin HY: Mechanisms of anemia in CKD. J Am Soc Nephrol 23: 1631–1634, 2012 [DOI] [PMC free article] [PubMed] [Google Scholar]
- 13.Kalim S, Tamez H, Wenger J, Ankers E, Trottier CA, Deferio JJ, Berg AH, Karumanchi SA, Thadhani RI: Carbamylation of serum albumin and erythropoietin resistance in end stage kidney disease. Clin J Am Soc Nephrol 8: 1927–1934, 2013 [DOI] [PMC free article] [PubMed] [Google Scholar]
- 14.Lönnberg M, Andrén M, Birgegård G, Drevin M, Garle M, Carlsson J: Rapid detection of erythropoiesis-stimulating agents in urine and serum. Anal Biochem 420: 101–114, 2012 [DOI] [PubMed] [Google Scholar]
- 15.Berg AH, Drechsler C, Wenger J, Buccafusca R, Hod T, Kalim S, Ramma W, Parikh SM, Steen H, Friedman DJ, Danziger J, Wanner C, Thadhani R, Karumanchi SA: Carbamylation of serum albumin as a risk factor for mortality in patients with kidney failure. Sci Transl Med 5: 175ra29, 2013 [DOI] [PMC free article] [PubMed] [Google Scholar]


