Abstract
Excess aldosterone is an important contributor to hypertension and cardiovascular disease. Conversely, low circulating aldosterone causes salt wasting and hypotension. Aldosterone activates mineralocorticoid receptors (MRs) to increase epithelial sodium channel (ENaC) activity. However, aldosterone may also stimulate the thiazide–sensitive Na+-Cl− cotransporter (NCC). Here, we generated mice in which MRs could be deleted along the nephron to test this hypothesis. These kidney–specific MR–knockout mice exhibited salt wasting, low BP, and hyperkalemia. Notably, we found evidence of deficient apical orientation and cleavage of ENaC, despite the salt wasting. Although these mice also exhibited deficient NCC activity, NCC could be stimulated by restricting dietary potassium, which also returned BP to control levels. Together, these results indicate that MRs regulate ENaC directly, but modulation of NCC is mediated by secondary changes in plasma potassium concentration. Electrolyte balance and BP seem to be determined, therefore, by a delicate interplay between direct and indirect mineralocorticoid actions in the distal nephron.
Keywords: aldosterone, cell signaling, ENaC, epithelial sodium transport, hypokalemia
Patients with low aldosterone, as in Addison disease, exhibit salt wasting, hypotension, and hyperkalemia. In contrast, primary aldosteronism is characterized by hypertension and hypokalemia.1 The steroid hormone aldosterone exerts its actions by binding to mineralocorticoid receptors (MRs) in multiple tissues.2 Although actions outside the kidney have received attention recently, aldosterone was first recognized for its effects on sodium (Na+) and potassium (K+) transport by the kidney.3 MRs are expressed from the thick ascending limb to the collecting duct (CD),4 but physiologic effects of aldosterone on ion homeostasis occur predominantly along the aldosterone–sensitive distal nephron (ASDN), comprising the connecting tubule (CNT) and CD and in some species, the late distal convoluted tubule (DCT2).5,6
Although the canonical action of aldosterone is to increase epithelial Na+ channel (ENaC) activity, it is accepted that aldosterone also stimulates the thiazide–sensitive Na+-Cl− cotransporter (NCC).7,8 Aldosterone infusion increases NCC activity9 and NCC abundance.10 Dietary salt restriction increases the abundance of phosphorylated (activated) Na+-Cl− cotransporter (pNCC).11,12 Although several hormonal systems are likely activated in these models, aldosterone has been reported to play a key role.11
Schütz and colleagues13 reported that constitutive MR knockout mice died in the neonatal period; when rescued by salt administration, however, they exhibited profound salt wasting and hyperkalemia.14 Surprisingly, mice with MR deleted along much of the ASDN (the CNT and CD) exhibited only a mild phenotype.15 The failure to delete MR along more proximal segments was suggested to explain the difference. Here, we generated mice in which MR could be deleted along the nephron to test the hypothesis that renal MR regulation is essential. The results confirm that MRs regulate ENaC directly but indicate that effects on NCC are secondary to metabolic changes.
Results
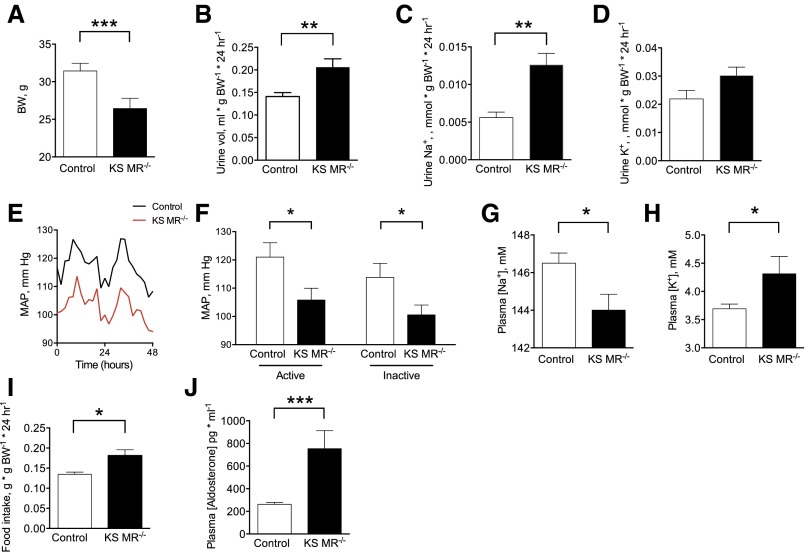
We used the Pax8/LC1 CRE/Lox system to generate mice in which MR could be deleted along the entire nephron using doxycycline (documented by RT-PCR in Supplemental Figure 1). After MR gene deletion at 8 weeks, kidney–specific MR knockout (KS MR−/−) mice survived, but body weight was lower than that in controls (Figure 1A). Even on a normal diet, daily urine volume and Na+ excretion rates were higher in KS MR−/− mice than in controls, although urine K+ excretion rates were similar (Figure 1, B–D). The BP was substantially lower in the knockout mice than in control animals (Figure 1, E and F), and knockout mice had lower plasma [Na+], higher plasma [K+], and greater food intake (Figure 1, G–I). Plasma aldosterone was also higher in knockout mice (Figure 1J).
Figure 1.
Kidney-specific MR deletion reduces blood pressure and alters electrolytes. (A) Body weight (BW) in the two groups, (B–D) urine measurements at baseline, (E and F) mean arterial pressure (MAP) and mean values during active and inactive periods, (G and H) plasma electrolyte values, (I) food intake, and (J) plasma aldosterone concentration. Data obtained at least 2 weeks after doxycycline treatment. Animals were maintained on standard chow for these studies (5L0D diet: 1.18% K+, 0.4% Na+, and 0.67% Cl−; Labdiet). For A, n=11 control and n=8 KS MR−/− mice. For C and D, n=11 control and n=13 KS MR−/− mice. For E and F, n=7 control and n=10 KS MR−/− mice. For G and H, n=5 per group. For J, n=6 per group. MAP tracing is average of all animals. Comparisons by unpaired t test. *P<0.05; **P<0.01; ***P<0.001.
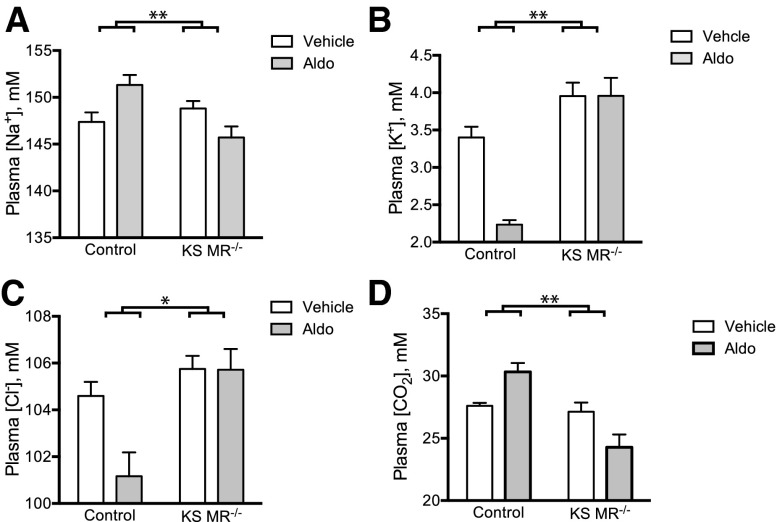
Although the data above suggest that the phenotype is similar to that of complete rescued MR knockout mice,14 we confirmed complete functional MR deletion by infusing aldosterone in control and KS MR−/− mice. In control animals, aldosterone infusion increased plasma [Na+], decreased plasma [K+] and [Cl−], and tended to increase plasma [CO2] as expected; in contrast, KS MR−/− animals were resistant to these effects (Figure 2).
Figure 2.
Aldosterone fails to affect plasma electrolytes in kidney-specific MR knockout mice. (A–D) Plasma electrolyte concentrations in the two groups treated with vehicle or aldosterone (n=5–8 per group). Statistical comparison with two-way ANOVA followed by Sidak multiple comparison test. Asterisks represent a significant interaction between aldosterone treatment and genotype. Additionally, there was a significant effect of aldosterone treatment on plasma [Na+], [K+], and [Cl−] in controls and plasma [CO2] (in the opposite direction of controls) in knockouts. *P<0.05; **P<0.01.
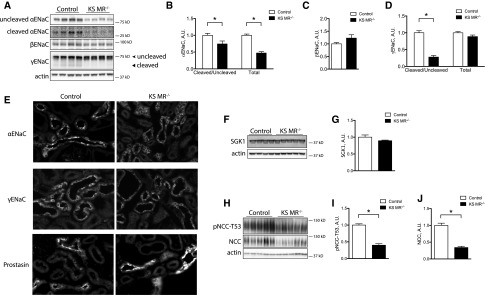
The observed phenotype suggested that KS MR−/− animals exhibit altered Na+ and K+ transport along the nephron. Therefore, we investigated the effects of MR deletion on renal ion transporters and channels. The abundance of α-ENaC was lower in KS MR−/− mice than in controls, whereas β- and γ-ENaC were similar (Figure 3, A–D). Because proteolytic cleavage of the α- and γ-subunits increases ENaC function,16 we also determined effects of renal MR deletion on the abundance of cleavage products. The ratios of cleaved to uncleaved α- and γ-ENaC were both lower in the knockout animals than in controls (Figure 3, B–D). Compared with controls, α-ENaC and to a lesser extent, γ-ENaC also exhibited a less apical orientation in the knockouts (Figure 3E). Neither prostasin (Figure 3E), which colocalized with α-ENaC (Supplemental Figure 2), nor SGK1 abundance (Figure 3, F and G), however, was different. NCC and pNCC abundances were also lower in knockouts than in controls (Figure 3, H–J).
Figure 3.
Both ENaC and NCC are reduced in kidney-specific MR knockout mice. (A) Western blot of ENaC in the two groups with uncleaved and cleaved proteins indicated, (B–D) quantification of ENaC abundance, (E) photomicrograph of ENaC and prostasin in the cortex of the two groups, (F) Western blot of SGK1 in the two groups, (G) quantification of SGK1, (H) Western blot of total NCC and pNCC, and (I and J) quantification of NCC. Statistics are the same as in Figure 1. *P<0.05.
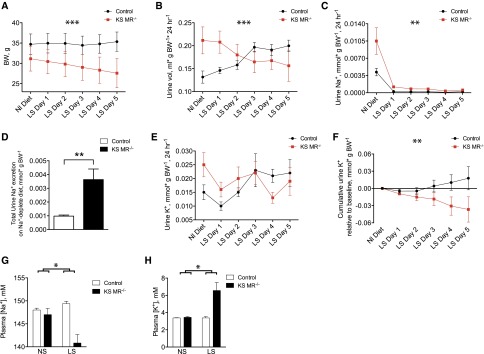
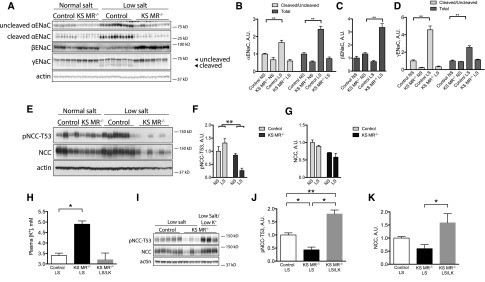
To determine whether the ability to tolerate Na+ deprivation and K+ loading was impaired in renal MR knockout mice, we treated control and KS MR−/− animals with Na+-deplete and high-K+ diets. Mice were treated with an Na+-deplete diet for 5 days to allow for reestablishment of electrolyte balance. This caused significant weight loss in KS MR−/− mice but not in control animals (Figure 4A). The urine volume tended to increase in the knockout mice (Figure 4, A and B), and the KS MR−/− mice had persistently elevated Na+ excretion compared with controls (Figure 4, C and D). Although the interaction between genotype and time was not quite statistically significant for urinary K+ excretion (P=0.05 by two-way ANOVA with repeated measures), analysis of cumulative K+ excretion indicated that the KS MR−/− animals failed to maintain adequate K+ excretion on the low-Na+ diet (Figure 4, E and F). On low Na+, knockout animals had significantly reduced plasma [Na+] and increased plasma [K+], whereas control animals did not (Figure 4, G and H). Plasma [Cl−] and hematocrit increased in both genotypes compared with their baseline values, whereas plasma [CO2] trended toward being reduced in the knockouts but not in control animals (Supplemental Figure 3).
Figure 4.
Low salt diet exacerbates the phenotype of kidney-specific MR knockout mice. (A–C) Effects on body weight (BW), urine volume, and urine Na+ excretion of changing from normal (Nl) salt to low salt (LS) diet. (D) Total urinary Na+ excretion in the groups, (E and F) urinary K+ excretion and cumulative urine K+ excretion relative to baseline (for each day in F, the difference between urine K+ on that day and baseline urine K+ was determined; for a given data point on the graph, these values were summed up to and including that day), and (G and H) plasma [Na+] and [K+]. Blood was taken on day 5 of the low-salt diet. Asterisks above time graphs indicate significant interactions between time and genotype by two-way ANOVA with repeated measures. Differences were significant on day 1 in B and C and day 5 in F as determined by Sidak multiple comparison test. Significance in D was determined by an unpaired t test. For A–F, n=6 per group. For G and H, the asterisk represents statistical interaction between diet and genotype as determined by two-way ANOVA. Low-salt (LS) diet also significantly affected plasma [Na+] and [K+] in the knockouts but not in controls. For G and H, n=4 (control NS), n=4 (knockout NS), n=5 (control LS), and n=6 (knockout LS). *P<0.05; **P<0.01; ***P<0.001.
Consumption of an Na+-deplete diet increased the abundance and ratio of cleaved to uncleaved α- and γ-ENaC in control mice but not in KS MR−/− animals (Figure 5, A–D). Surprisingly, consumption of an Na+-deplete diet further reduced pNCC abundance in the KS MR−/− mice (Figure 5, E–G). Although the low pNCC in KS MR−/− mice suggested that MRs regulate NCC, these mice also have elevated plasma [K+]. Because plasma [K+] has a direct effect on NCC,17 we prevented this rise in plasma [K+] by treating KS MR−/− animals for 5 days with an Na+-deplete diet that is also deplete in K+ (Figure 5H). pNCC abundance in KS MR−/− mice that consumed this diet was greater than it was in control mice that consumed a low-salt diet (Figure 5, I–K). This indicated that reduced pNCC abundance in KS MR−/− mice resulted predominantly from the rise in plasma [K+] and not the lack of MR.
Figure 5.
Deletion of MR completely prevents ENaC activation, but not NCC. (A) Effects of diet on ENaC abundance in control and KS MR−/− mice, (B–D) quantification of results in A (normal salt, NS; low salt, LS), (E) effects of diet on NCC abundance, (F and G) quantification of results in E, (H) effects of low-K+ intake (LK) on plasma [K+] in mice on low-salt diet, (I) effects of low-K+ intake on NCC abundance, and (J and K) quantification of results in I. Results were analyzed by two-way ANOVA, except for in H–K, which were analyzed by one-way ANOVA with Tukey multiple comparison test. Animals in A–G are the same as those in Figure 4. The low-salt feeding period was for 5 days. Animals in H–K were treated with indicated diet for 5 days. *P<0.05; **P<0.01.
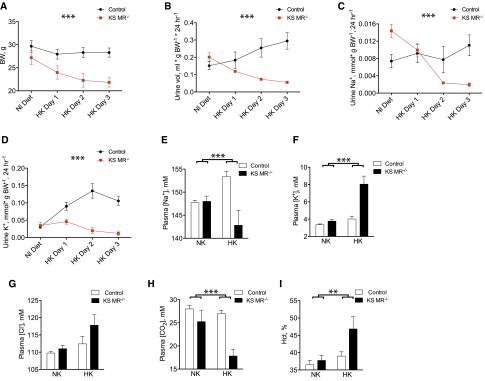
Treatment with a high-K+ diet produced similar but more dramatic effects in KS MR−/− mice compared with the low-salt diet. The KS MR−/− mice did not tolerate this diet well, so we performed a shorter experiment (3 days) to obtain data before the mice became sick. In control mice, K+ loading did not significantly affect body weight or urinary Na+ excretion, but it did produce a diuresis and a kaliuresis (Figure 6, A–D). In contrast, KS MR−/− animals showed significant weight loss and lower urine volume and Na+ excretion (Figure 6, A–D). Additionally, the knockout animals failed to increase K+ excretion (Figure 6D). K+ loading also reduced plasma [Na+] in KS MR−/− mice, whereas it was increased in controls (Figure 6, E and F). Plasma [K+] and [Cl−] increased in knockouts and plasma [CO2] declined in response to high-K+ diet (Figure 6, F–H). Lastly, hematocrit rose substantially when the KS MR−/− mice were fed high-K+ chow (Figure 6I).
Figure 6.
Mice lacking MR along the nephron do not tolerate dietary potassium loading. (A) Body weight (BW) when mice were switched from normal (Nl) diet (NK) to high K+ diet (HK). (B–D) urine volume and electrolyte excretion, (E–H) plasma electrolyte concentrations, and (I) hematocrit (Hct; n=4–6 per group). Timed data were analyzed by two-way ANOVA with repeated measures. Blood values were analyzed by two-way ANOVA. Asterisks depict interaction between time and genotype in A–D and interaction between diet and genotype in E–I. **P<0.01; ***P<0.001.
Similar to Na+ deprivation, K+ loading increased total and cleaved α- and γ-ENaC in control animals (Supplemental Figure 4), but this effect was completely absent in KS MR−/− animals. As expected,17 pNCC abundance decreased in K+–loaded control mice (Supplemental Figure 4). This effect was similar yet more dramatic in KS MR−/− animals (Supplemental Figure 4).
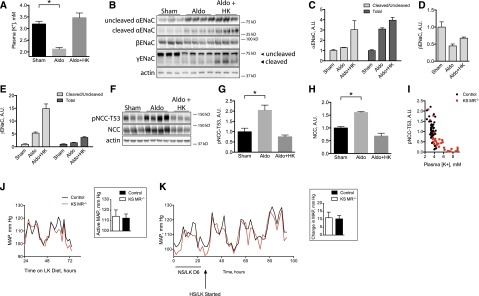
These data confirm that aldosterone activates ENaC through the MR, because activation of ENaC did not occur in KS MR−/− mice. In contrast, these data also indicate that MRs are not necessary for NCC activation, because NCC and pNCC abundance increased with K+ restriction in KS MR−/− mice. To test the converse hypothesis that aldosterone administration increases pNCC abundance only when it causes hypokalemia, we infused aldosterone into wild-type animals consuming either a normal or a high-K+ diet; the high-K+ diet prevented the reduction in plasma [K+], which otherwise occurred (Figure 7A). As expected, aldosterone increased both α- and γ-ENaC abundance (Figure 7, B–D) and pNCC when mice consumed the normal K+ diet (Figure 7, F–H). K+ loading of aldosterone-infused mice led to even greater changes in α- and γ-ENaC (Figure 7, A–E). In striking contrast, high-K+ diet completely prevented a rise in NCC during aldosterone infusion (Figure 7, F–H). Thus, high-aldosterone concentrations are not sufficient to increase pNCC abundance. Similar results were obtained when plasma [K+] was maintained using amiloride rather than diet (Supplemental Figure 5). When data from control and KS MR−/− mice were pooled, pNCC abundance and plasma [K+] seemed to describe a single curve (Figure 7I), further suggesting that plasma [K+] and not mineralocorticoid effect is the primary NCC driver.
Figure 7.
Aldosterone appears to stimulate ENaC directly, but NCC indirectly, to modulate blood pressure. (A) Effects of aldosterone and high-K+ diet (HK) on plasma [K+], (B) effect of aldosterone and diet on ENaC, (C–E) quantification of results in A, (F) effect of aldosterone and diet on NCC, (G and H) quantification of results in E, (I) relationship between plasma [K+] and pNCC in control and KS MR−/− mice (data are pooled from all presented experiments, and some of control data have been published previously45), (J) BP in control and KS MR−/− mice on low-K+ (LK) diet (J, Inset shows mean values during the active period), and (K) effect of high-salt intake on BP in LK diet–treated mice (K, Inset shows mean values during the active period). Animals in A–H are all wild type. Genotypes in I–K are as indicated. For A–H, n=3–4. For BP data, n=3 controls and n=4 knockouts. Mean arterial pressure (MAP) tracings are averages of all animals. For BP analyses, unpaired t tests performed on data displayed in bar charts were not statistically significant. *P<0.05.
These results suggest that combined inhibition of both NCC and ENaC may cause the profound salt wasting and low BP of MR deficiency. If the NCC inhibition, however, is indirect, then BP should normalize in KS MR−/− mice when the rise in plasma [K+] is prevented. Figure 7J shows that arterial pressure in KS MR−/− mice when they are fed low-K+ chow is essentially identical to that of control mice. In fact, low-K+ diet made KS MR−/− mice susceptible to salt–induced BP rises, similar to those that occurred in control animals (Figure 7K).
Discussion
Individuals with low–circulating aldosterone concentrations suffer from severe and potentially fatal electrolyte disorders and hypotension. Genetic deletion of MR throughout the body largely recapitulates this phenotype,13 but deletion of MR along the CNT and CD causes only mild salt wasting.15,18 The present results show that MRs along the DCT2 and proximal CNT account for this difference, because deletion of MR along the entire nephron recapitulates the effects of rescued total body knockout.
Although ENaC is the canonical MR target, it is now widely accepted that aldosterone also activates NCC.9,10,19 A first analysis of the current results seemed to confirm this view, because NCC and pNCC abundances were substantially reduced in the KS MR−/− mice. However, plasma [K+], an important direct regulator of NCC,17 was also elevated in the knockout mice. Thus, we investigated whether the effects on NCC were secondary to the changes in plasma [K+] instead of lack of MR. Dietary K+ restriction of KS MR−/− mice maintained the abundance of pNCC at a level similar to or greater than in control, indicating that the high plasma [K+], not MR deficiency, reduces NCC abundance. Although remaining MRs in the kidney might have played a role, the complete absence of ENaC activation, despite low-salt or high-K+ diets, argues strongly against this conjecture. Coupled with the observation that NCC abundance was suppressed by a high-K+ diet, even during aldosterone infusion, these results make clear that MRs are neither necessary (Figure 4) nor sufficient (Figure 7) for NCC activation. Instead, plasma [K+] derangements induced by MR effects on ENaC are dominant. Most or all prior in vivo observations suggesting that aldosterone stimulates NCC9,10,19–21 can be explained by this K+ effect, likely combined with effects of angiotensin II,22 consistent with studies suggesting that NCC is regulated primarily by K+ status.12,17,23–25
These data do not exclude the previously suggested direct effect of aldosterone on NCC,9–11,19,20 but K+ effects seem predominant. Ko et al.21 used cultured cells to argue for a direct mechanism; their in vivo aldosterone infusion experiment, however, did not test the mechanism involved.21 Roy et al.26 used cell culture systems to suggest that aldosterone regulates WNK1 to stimulate NCC, but their work did not determine effects of aldosterone on NCC either in vitro or in vivo. Given our data, changes in WNK1 after aldosterone infusion might have resulted from changes in plasma [K+].
These results indicate that MRs along the nephron are essential for normal electrolyte and pressure homeostasis, even in fully developed mice. The results correspond with the observation that Addison disease is associated with hypotension or the resolution of hypertension.27 The results also model the hyponatremia typically observed in Addison disease, which is ascribed to nonosmotic vasopressin release.
A high-K+ diet was associated with lower blood [CO2] and higher hematocrit in KS MR−/− mice, both of which were observed after total body MR knockout.13 Our knockout animals also ate more, suggestive of secondary hyperphagia, perhaps caused by salt craving. Thus, the reason for reduced body weights is not entirely clear.
Although K+ excretion is determined by many factors,28 these results argue that aldosterone plays an essential and nonredundant role in daily K+ balance. We did not perform formal balance studies, however, so that MR effects on plasma [K+] may not reflect changes in total body K+ content as suggested.29 However, deletion of renal MR shifts the relationship between plasma [K+] and urinary K+ excretion to the right and downward (K+ excretion is essentially flat when plasma [K+] is raised in the absence of MR). This supports the elegant model of total body K+ regulation developed by Young and colleagues30–33 30 years ago. It should be noted, however, that the effect of aldosterone (MR) is multiplicative with that of plasma [K+], so that the effects of aldosterone are increasingly apparent when mice or humans are challenged.
Young31 also suggested that aldosterone strongly affects internal K+ balance by enhancing K+ uptake into cells throughout the body. Our model provided one opportunity to test this directly, because an infusion of aldosterone should reduce the plasma [K+] under these conditions. Against predictions, aldosterone infusion at concentrations that were clearly effective in control mice did not alter plasma [K+] in KS MR−/− mice. At least two issues, however, complicate the interpretation. First, although the Pax8 system is relatively specific for kidney epithelia,34,35 substantial gene deletion also occurs in the liver, which may have contributed to extrarenal K+ uptake. Second, extrarenal MR may be stimulated in KS MR−/− mice at baseline, because plasma [aldosterone] is elevated; the addition of supraphysiologic aldosterone, then, may have little additional effect.
As expected, MR deletion had a profound effect on ENaC activity (inferred from the Na+ wasting and K+ retention). Deletion of MR along the entire nephron led to a shift of ENaC away from the apical membrane, a reduction in α-ENaC abundance, and impaired cleavage; these observations generally concord with the work of others. On a low-salt diet, ENaC abundance and cleavage did not change further, suggesting that aldosterone itself is the dominant ENaC regulatory factor. Although angiotensin II has been reported to stimulate ENaC, the lack of ENaC stimulation observed here is consistent with evidence from angiotensin receptor knockout studies of Coffman and colleagues.36 Here, we also found a marked decrease in apical membrane γ-ENaC and nearly absent cleavage, even when mice were treated with low-salt or high-K+ diets. Prostasin plays an important role in γ-ENaC cleavage.37 Although prostasin was strikingly enriched in the ASDN, MR deletion had little or no effect on either its distribution or abundance.
Surprisingly, SGK1 abundance was also unaltered in the KS MR−/− mice, suggesting that the chronic suppression of ENaC activity is not related to changes in SGK1 signaling. Although we measured only total kidney SGK1, our results concord with those in the work by Alvarez de la Rosa et al.,38 which reported that low-salt diet does not affect the distribution or intensity of SGK1 in the kidney.
The low BP in KS MR−/− mice resulted from the combined deficiency of NCC and ENaC activity in the setting in which transport proteins along more proximal nephron segments are likely activated by extracellular fluid volume depletion.39 Soleimani and colleagues40,41 have shown how defects in salt reabsorption along sequential nephron segments often lead to profound salt wasting, whereas defects along one of the segments do not. Deletion of renal MR seems to present an interesting variant on this model; although only ENaC seemed to be inhibited directly by MR deletion, NCC abundance and activity were suppressed secondarily by high plasma [K+]. Although we used pNCC abundance to estimate rather than measure NCC activity, Figure 7 shows that arterial pressure and pNCC abundance track together, suggesting that the biochemical effects reflect transporter activity.
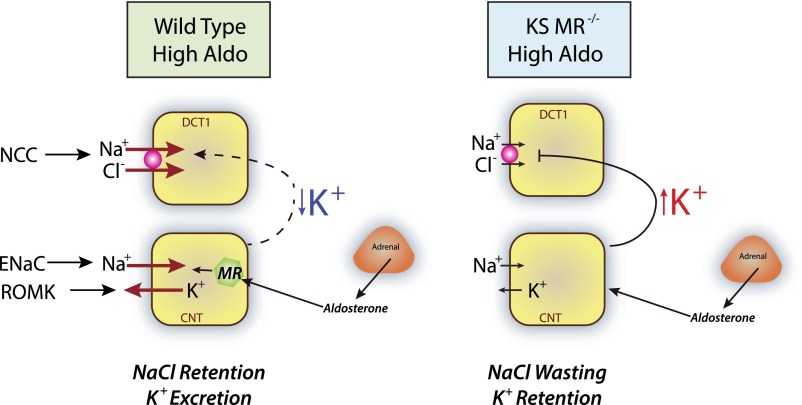
These results, thus, elucidate the delicate interplay between aldosterone-regulated ENaC and K+-regulated NCC (Figure 8). When, for example, primary aldosteronism stimulates ENaC, this reduces plasma [K+], activating NCC and contributing to hypertension.42 When aldosterone secretion is deficient, such as in Addison syndrome, ENaC cannot be activated, plasma [K+] rises, and NCC is suppressed; this causes salt wasting and low BP.
Figure 8.
Both direct and indirect effects of aldosterone are necessary or regulation of electrolyte and blood pressure homeostasis. (Left panel) In a state of primary aldosterone excess, aldosterone stimulates ENaC and ROMK (and likely, BK) directly, leading to a decline in plasma [K+]. The low plasma [K+] stimulates NCC secondarily (dashed line), causing salt retention and hypertension. (Right panel) In the knockout mice, ENaC is not activated, and plasma [K+] rises. This suppresses NCC secondarily (line), leading to salt wasting and low BP. Salt wasting requires both the direct inhibition of ENaC and the indirect inhibition of NCC. DCT1 and CNT cells are shown.
In summary, these results show the essential role that MRs play in electrolyte balance and highlight the importance of the DCT in these effects. They indicate that MRs are not necessary for NCC activation but instead, act through ENaC and plasma [K+] to activate the transporter. The results show how diminution of both ENaC and NCC activity is required for the profound effects of MR deletion on arterial pressure. Finally, they indicate how the tight control of salt and K+ balance is dependent on both direct and indirect effects of the mineralocorticoid hormone, aldosterone.
Concise Methods
Animals
Studies were approved by Oregon Health and Science University’s Animal Care and Usage Committee (Protocol IS3286). KS MR−/− mice were generated through use of the Pax8-rtTA/LC1 system34 as before.43 Mice were genotyped as described in Supplemental Material. To induce Cre-mediated recombination, mice were treated with 2 mg/ml doxycycline hyclate in 5% sucrose drinking water for 2 weeks. All mice used for experiments were 12–24 weeks old.
BP Measurement
BP was measured by radiotelemetry. Two-hour averages were used to calculate mean arterial pressures.
Metabolic Cage Studies
Animals were acclimated to metabolic cages (Hatteras Instruments) for 2 days before urine collection. Animals were fed a gel diet with indicated mineral content (Harlan Industries, Indianapolis, IN) (Supplemental Material, Animal Diets and Measurement of Food Consumption). Urine was collected under water–saturated light mineral oil every 24 hours. Urine Na+ and K+ contents were determined by flame photometry.
Blood Collection and Electrolyte Measurements
Whole blood was collected by cardiac puncture under anesthesia. Plasma was removed and stored at −20°C.
Kidney Western Blot
Kidneys were removed, snap frozen, and homogenized.43 Homogenate was centrifuged, and supernatant was transferred to a new tube. After total protein quantification, 40 μg protein per sample was separated on either a 4%–12% Bis-Tris or a 3%–8% Tris-acetate gel (Invitrogen) and transferred overnight to a PVDF membrane. Membranes were then washed, incubated with an HRP–coupled secondary antibody (1:5000; Invitrogen, Carlsbad, CA), washed again, and imaged using a Western Lightning Kit (PerkinElmer, Waltham, MA).
Perfusion Fixation and Immunofluorescence Imaging
Kidneys were fixed in vivo as described44; 5-μm sections were washed, blocked in 5% nonfat milk, and incubated overnight in primary antibody. The next day, sections were washed, incubated with Cy-3–coupled secondary antibody (Invitrogen), and embedded.
Aldosterone Infusion and Plasma Concentration Measurement
Aldosterone was infused at a concentration of 240 μg/kg per day for 7 days by osmotic minipump (Alzet, Cupertino, CA). Plasma aldosterone concentration was measured by ELISA (IBL America).
Statistical Analyses
The null hypothesis was tested using unpaired t tests, two-way ANOVA, or two-way ANOVA for repeated measures as indicated in the figures and text.
Disclosures
None.
Supplementary Material
Acknowledgments
The authors thank J. Loffing for the epithelial sodium channel antibodies, J. Chao (Medical University of South Carolina) for the antiprostasin antibodies, and S. Berger and G. Schütz for the floxed mineralocorticoid receptor mice.
This work was funded by National Institutes of Health (NIH) Grants 5R01DK098141 (to J.A.M.) and 2R01DK051496-15A1 (to C.-L.Y. and D.H.E.) and Department of Veterans Affairs Grant 1I0BX002228-01A1 (to D.H.E.). A.S.T. and B.Y. were supported by NIH Grant 5T32DK067864-10, A.S.T. was supported by American Heart Association Predoctoral Award 3PRE14090030, and R.A.L. was supported by American Heart Association Predoctoral Award 14PRE18330021. D.H.E. was the recipient of Marie Curie Fellowship of the European Union PIIF-GA-2012-329677 during these studies.
Portions of this work were presented at Experimental Biology, Boston MA, March 2015.
Footnotes
Published online ahead of print. Publication date available at www.jasn.org.
This article contains supplemental material online at http://jasn.asnjournals.org/lookup/suppl/doi:10.1681/ASN.2015070815/-/DCSupplemental.
References
- 1.Magill SB: Pathophysiology, diagnosis, and treatment of mineralocorticoid disorders. Compr Physiol 4: 1083–1119, 2014 [DOI] [PubMed] [Google Scholar]
- 2.Nguyen Dinh Cat A, Jaisser F: Extrarenal effects of aldosterone. Curr Opin Nephrol Hypertens 21: 147–156, 2012 [DOI] [PubMed] [Google Scholar]
- 3.Funder JW: Minireview: Aldosterone and mineralocorticoid receptors: Past, present, and future. Endocrinology 151: 5098–5102, 2010 [DOI] [PubMed] [Google Scholar]
- 4.Ackermann D, Gresko N, Carrel M, Loffing-Cueni D, Habermehl D, Gomez-Sanchez C, Rossier BC, Loffing J: In vivo nuclear translocation of mineralocorticoid and glucocorticoid receptors in rat kidney: Differential effect of corticosteroids along the distal tubule. Am J Physiol Renal Physiol 299: F1473–F1485, 2010 [DOI] [PubMed] [Google Scholar]
- 5.Hunter RW, Craigie E, Homer NZ, Mullins JJ, Bailey MA: Acute inhibition of NCC does not activate distal electrogenic Na+ reabsorption or kaliuresis. Am J Physiol Renal Physiol 306: F457–F467, 2014 [DOI] [PMC free article] [PubMed] [Google Scholar]
- 6.Bostanjoglo M, Reeves WB, Reilly RF, Velázquez H, Robertson N, Litwack G, Morsing P, Dørup J, Bachmann S, Ellison DH: 11Beta-hydroxysteroid dehydrogenase, mineralocorticoid receptor, and thiazide-sensitive Na-Cl cotransporter expression by distal tubules. J Am Soc Nephrol 9: 1347–1358, 1998 [DOI] [PubMed] [Google Scholar]
- 7.Moes AD, van der Lubbe N, Zietse R, Loffing J, Hoorn EJ: The sodium chloride cotransporter SLC12A3: New roles in sodium, potassium, and blood pressure regulation. Pflugers Arch 466: 107–118, 2014 [DOI] [PubMed] [Google Scholar]
- 8.Subramanya AR, Ellison DH: Distal convoluted tubule. Clin J Am Soc Nephrol 9: 2147–2163, 2014 [DOI] [PMC free article] [PubMed] [Google Scholar]
- 9.Velázquez H, Bartiss A, Bernstein P, Ellison DH: Adrenal steroids stimulate thiazide-sensitive NaCl transport by rat renal distal tubules. Am J Physiol 270: F211–F219, 1996 [DOI] [PubMed] [Google Scholar]
- 10.Kim GH, Masilamani S, Turner R, Mitchell C, Wade JB, Knepper MA: The thiazide-sensitive Na-Cl cotransporter is an aldosterone-induced protein. Proc Natl Acad Sci U S A 95: 14552–14557, 1998 [DOI] [PMC free article] [PubMed] [Google Scholar]
- 11.Chiga M, Rai T, Yang SS, Ohta A, Takizawa T, Sasaki S, Uchida S: Dietary salt regulates the phosphorylation of OSR1/SPAK kinases and the sodium chloride cotransporter through aldosterone. Kidney Int 74: 1403–1409, 2008 [DOI] [PubMed] [Google Scholar]
- 12.van der Lubbe N, Moes AD, Rosenbaek LL, Schoep S, Meima ME, Danser AH, Fenton RA, Zietse R, Hoorn EJ: K+-induced natriuresis is preserved during Na+ depletion and accompanied by inhibition of the Na+-Cl- cotransporter. Am J Physiol Renal Physiol 305: F1177–F1188, 2013 [DOI] [PubMed] [Google Scholar]
- 13.Berger S, Bleich M, Schmid W, Cole TJ, Peters J, Watanabe H, Kriz W, Warth R, Greger R, Schütz G: Mineralocorticoid receptor knockout mice: Pathophysiology of Na+ metabolism. Proc Natl Acad Sci U S A 95: 9424–9429, 1998 [DOI] [PMC free article] [PubMed] [Google Scholar]
- 14.Bleich M, Warth R, Schmidt-Hieber M, Schulz-Baldes A, Hasselblatt P, Fisch D, Berger S, Kunzelmann K, Kriz W, Schütz G, Greger R: Rescue of the mineralocorticoid receptor knock-out mouse. Pflugers Arch 438: 245–254, 1999 [DOI] [PubMed] [Google Scholar]
- 15.Ronzaud C, Loffing J, Bleich M, Gretz N, Gröne HJ, Schütz G, Berger S: Impairment of sodium balance in mice deficient in renal principal cell mineralocorticoid receptor. J Am Soc Nephrol 18: 1679–1687, 2007 [DOI] [PubMed] [Google Scholar]
- 16.Shi S, Carattino MD, Hughey RP, Kleyman TR: ENaC regulation by proteases and shear stress. Curr Mol Pharmacol 6: 28–34, 2013 [DOI] [PMC free article] [PubMed] [Google Scholar]
- 17.Terker AS, Zhang C, McCormick JA, Lazelle RA, Zhang C, Meermeier NP, Siler DA, Park HJ, Fu Y, Cohen DM, Weinstein AM, Wang WH, Yang CL, Ellison DH: Potassium modulates electrolyte balance and blood pressure through effects on distal cell voltage and chloride. Cell Metab 21: 39–50, 2015 [DOI] [PMC free article] [PubMed] [Google Scholar]
- 18.Ronzaud C, Loffing J, Gretz N, Schütz G, Berger S: Inducible renal principal cell-specific mineralocorticoid receptor gene inactivation in mice. Am J Physiol Renal Physiol 300: F756–F760, 2011 [DOI] [PubMed] [Google Scholar]
- 19.van der Lubbe N, Lim CH, Meima ME, van Veghel R, Rosenbaek LL, Mutig K, Danser AH, Fenton RA, Zietse R, Hoorn EJ: Aldosterone does not require angiotensin II to activate NCC through a WNK4-SPAK-dependent pathway. Pflugers Arch 463: 853–863, 2012 [DOI] [PMC free article] [PubMed] [Google Scholar]
- 20.Abdallah JG, Schrier RW, Edelstein C, Jennings SD, Wyse B, Ellison DH: Loop diuretic infusion increases thiazide-sensitive Na(+)/Cl(-)-cotransporter abundance: Role of aldosterone. J Am Soc Nephrol 12: 1335–1341, 2001 [DOI] [PubMed] [Google Scholar]
- 21.Ko B, Mistry AC, Hanson L, Mallick R, Wynne BM, Thai TL, Bailey JL, Klein JD, Hoover RS: Aldosterone acutely stimulates NCC activity via a SPAK-mediated pathway. Am J Physiol Renal Physiol 305: F645–F652, 2013 [DOI] [PMC free article] [PubMed] [Google Scholar]
- 22.Castañeda-Bueno M, Cervantes-Pérez LG, Vázquez N, Uribe N, Kantesaria S, Morla L, Bobadilla NA, Doucet A, Alessi DR, Gamba G: Activation of the renal Na+:Cl- cotransporter by angiotensin II is a WNK4-dependent process. Proc Natl Acad Sci U S A 109: 7929–7934, 2012 [DOI] [PMC free article] [PubMed] [Google Scholar]
- 23.Sorensen MV, Grossmann S, Roesinger M, Gresko N, Todkar AP, Barmettler G, Ziegler U, Odermatt A, Loffing-Cueni D, Loffing J: Rapid dephosphorylation of the renal sodium chloride cotransporter in response to oral potassium intake in mice. Kidney Int 83: 811–824, 2013 [DOI] [PubMed] [Google Scholar]
- 24.Vitzthum H, Seniuk A, Schulte LH, Müller ML, Hetz H, Ehmke H: Functional coupling of renal K+ and Na+ handling causes high blood pressure in Na+ replete mice. J Physiol 592: 1139–1157, 2014 [DOI] [PMC free article] [PubMed] [Google Scholar]
- 25.Rengarajan S, Lee DH, Oh YT, Delpire E, Youn JH, McDonough AA: Increasing plasma [K+] by intravenous potassium infusion reduces NCC phosphorylation and drives kaliuresis and natriuresis. Am J Physiol Renal Physiol 306: F1059–F1068, 2014 [DOI] [PMC free article] [PubMed] [Google Scholar]
- 26.Roy A, Al-Qusairi L, Donnelly BF, Ronzaud C, Marciszyn AL, Gong F, Chang YP, Butterworth MB, Pastor-Soler NM, Hallows KR, Staub O, Subramanya AR: Alternatively spliced proline-rich cassettes link WNK1 to aldosterone action. J Clin Invest 125: 3433–3448, 2015 [DOI] [PMC free article] [PubMed] [Google Scholar]
- 27.Dunlop D: Eighty-six cases of Addison’s disease. BMJ 2: 887–891, 1963 [DOI] [PMC free article] [PubMed] [Google Scholar]
- 28.Gumz ML, Rabinowitz L, Wingo CS: An integrated view of potassium homeostasis. N Engl J Med 373: 60–72, 2015 [DOI] [PMC free article] [PubMed] [Google Scholar]
- 29.Rabinowitz L: Aldosterone and potassium homeostasis. Kidney Int 49: 1738–1742, 1996 [DOI] [PubMed] [Google Scholar]
- 30.Young DB: Quantitative analysis of aldosterone’s role in potassium regulation. Am J Physiol 255: F811–F822, 1988 [DOI] [PubMed] [Google Scholar]
- 31.Young DB: Analysis of long-term potassium regulation. Endocr Rev 6: 24–44, 1985 [DOI] [PubMed] [Google Scholar]
- 32.Young DB, Paulsen AW: Interrelated effects of aldosterone and plasma potassium on potassium excretion. Am J Physiol 244: F28–F34, 1983 [DOI] [PubMed] [Google Scholar]
- 33.Young DB: Relationship between plasma potassium concentration and renal potassium excretion. Am J Physiol 242: F599–F603, 1982 [DOI] [PubMed] [Google Scholar]
- 34.Traykova-Brauch M, Schönig K, Greiner O, Miloud T, Jauch A, Bode M, Felsher DW, Glick AB, Kwiatkowski DJ, Bujard H, Horst J, von Knebel Doeberitz M, Niggli FK, Kriz W, Gröne HJ, Koesters R: An efficient and versatile system for acute and chronic modulation of renal tubular function in transgenic mice. Nat Med 14: 979–984, 2008 [DOI] [PMC free article] [PubMed] [Google Scholar]
- 35.Lazelle RA, McCully BH, Terker AS, Himmerkus N, Blankenstein K, Mutig K, Bleich M, Bachman S, Yang C-L, Ellison DH: Renal deletion of 12 kDa FK506-binding protein attenuates tacrolimus-induced hypertension [published online ahead of print October 2, 2015]. J Am Soc Nephrol 10.1681/ASN.2015040466 [DOI] [PMC free article] [PubMed]
- 36.Stegbauer J, Gurley SB, Sparks MA, Woznowski M, Kohan DE, Yan M, Lehrich RW, Coffman TM: AT1 receptors in the collecting duct directly modulate the concentration of urine. J Am Soc Nephrol 22: 2237–2246, 2011 [DOI] [PMC free article] [PubMed] [Google Scholar]
- 37.Carattino MD, Mueller GM, Palmer LG, Frindt G, Rued AC, Hughey RP, Kleyman TR: Prostasin interacts with the epithelial Na+ channel and facilitates cleavage of the γ-subunit by a second protease. Am J Physiol Renal Physiol 307: F1080–F1087, 2014 [DOI] [PMC free article] [PubMed] [Google Scholar]
- 38.Alvarez de la Rosa D, Coric T, Todorovic N, Shao D, Wang T, Canessa CM: Distribution and regulation of expression of serum- and glucocorticoid-induced kinase-1 in the rat kidney. J Physiol 551: 455–466, 2003 [DOI] [PMC free article] [PubMed] [Google Scholar]
- 39.Grimm PR, Lazo-Fernandez Y, Delpire E, Wall SM, Dorsey SG, Weinman EJ, Coleman R, Wade JB, Welling PA: Integrated compensatory network is activated in the absence of NCC phosphorylation. J Clin Invest 125: 2136–2150, 2015 [DOI] [PMC free article] [PubMed] [Google Scholar]
- 40.Soleimani M, Barone S, Xu J, Shull GE, Siddiqui F, Zahedi K, Amlal H: Double knockout of pendrin and Na-Cl cotransporter (NCC) causes severe salt wasting, volume depletion, and renal failure. Proc Natl Acad Sci U S A 109: 13368–13373, 2012 [DOI] [PMC free article] [PubMed] [Google Scholar]
- 41.Amlal H, Soleimani M: Pendrin as a novel target for diuretic therapy. Cell Physiol Biochem 28: 521–526, 2011 [DOI] [PubMed] [Google Scholar]
- 42.van der Lubbe N, Jansen PM, Salih M, Fenton RA, van den Meiracker AH, Danser AH, Zietse R, Hoorn EJ: The phosphorylated sodium chloride cotransporter in urinary exosomes is superior to prostasin as a marker for aldosteronism. Hypertension 60: 741–748, 2012 [DOI] [PubMed] [Google Scholar]
- 43.McCormick JA, Yang CL, Zhang C, Davidge B, Blankenstein KI, Terker AS, Yarbrough B, Meermeier NP, Park HJ, McCully B, West M, Borschewski A, Himmerkus N, Bleich M, Bachmann S, Mutig K, Argaiz ER, Gamba G, Singer JD, Ellison DH: Hyperkalemic hypertension-associated cullin 3 promotes WNK signaling by degrading KLHL3. J Clin Invest 124: 4723–4736, 2014 [DOI] [PMC free article] [PubMed] [Google Scholar]
- 44.Saritas T, Borschewski A, McCormick JA, Paliege A, Dathe C, Uchida S, Terker A, Himmerkus N, Bleich M, Demaretz S, Laghmani K, Delpire E, Ellison DH, Bachmann S, Mutig K: SPAK differentially mediates vasopressin effects on sodium cotransporters. J Am Soc Nephrol 24: 407–418, 2013 [DOI] [PMC free article] [PubMed] [Google Scholar]
- 45.Terker AS, Zhang C, Erspamer KJ, Gamba G, Yang CL, Ellison DH: Unique chloride-sensing properties of WNK4 permit the distal nephron to modulate potassium homeostasis [published online ahead of print September 30, 2015]. Kidney Int 10.1038/ki.2015.289 [DOI] [PMC free article] [PubMed] [Google Scholar]
Associated Data
This section collects any data citations, data availability statements, or supplementary materials included in this article.


