

Abstract
Background and Purpose
Elevated serum uric acid (UA) is a risk factor for the development of kidney disease. Inhibitors of xanthine oxidase (XOi), an enzyme involved in UA synthesis, have protective effects at early stages of experimental diabetic nephropathy (DN). However, long‐term effects of XOi in models of DN remain to be determined.
Experimental Approach
The development of albuminuria, renal structure and molecular markers of DN were studied in type 2 diabetic Zucker obese (ZO) rats treated for 18 weeks with the XOi febuxostat and compared with vehicle‐treated ZO rats, ZO rats treated with enalapril or a combination of both agents, and lean Zucker rats without metabolic defects.
Results
Febuxostat normalized serum UA and attenuated the development of albuminuria, renal structural changes, with no significant effects on BP, metabolic control or systemic markers of oxidative stress (OS). Most of these actions were comparable with those of enalapril. Combination treatment induced marked decreases in BP and was more effective in ameliorating structural changes, expression of profibrotic genes and systemic OS than either monotherapy. Febuxostat attenuated renal protein expression of TGF‐ß, CTGF, collagen 4, mesenchymal markers (FSP1 and vimentin) and a tissue marker of OS nitrotyrosine. Moreover, febuxostat attenuated TGF‐ß‐ and S100B‐induced increased expression of fibrogenic molecules in renal tubular cells in vitro in UA‐free media in an Akt kinase‐dependent manner.
Conclusions and Implications
Febuxostat is protective and enhances the actions of enalapril in experimental DN. Multiple mechanisms might be involved, such as a reduction of UA, renal OS and inhibition of profibrotic signalling.
Abbreviations
- 8‐epi PGF2α
8‐isoprostane
- ACEI
ACE inhibitor
- α‐SMA
α‐smooth muscle actin
- BG
blood glucose
- CKD
chronic kidney disease
- Coll4
collagen IV
- CTGF
connective tissue growth factor
- DM2
type 2 diabetes
- ECM
extracellular matrix
- ENL
enalapril
- FBX
febuxostat
- FSP1/S100A4
fibroblast‐specific protein 1
- GFR
glomerular filtration rate
- GSS
glomerulosclerosis score
- HBA1c
glycosylated haemoglobin
- IHC
immunohistochemistry
- MS
metabolic syndrome
- NT
nitrotyrosine
- PAI‐I
plasminogen activator inhibitor‐I
- RAS
renin–angiotensin system
- RAGE
receptor for advanced glycosylation end products
- SAG
severely affected glomeruli
- TBARS
thiobarbituric acid reactive substances
- TIF
tubulointerstitial fibrosis
- TIFS
tubulointerstitial fibrosis score
- UA
uric acid
- UalbV
24 h urinary albumin excretion
- XO
xanthine oxidase
- XOi
xanthine oxidase inhibition/inhibitor
- ZL
Zucker lean
- ZO
Zucker obese
Tables of Links
| TARGETS | |
|---|---|
| Other protein targets a | Enzymes b |
| RAGE | Akt (PKB) |
| Angiotensin‐converting enzyme | |
| Xanthine dehydrogenase/oxidase |
These Tables list key protein targets and ligands in this article which are hyperlinked to corresponding entries in http://www.guidetopharmacology.org, the common portal for data from the IUPHAR/BPS Guide to PHARMACOLOGY (Southan et al., 2016) and are permanently archived in the Concise Guide to PHARMACOLOGY 2015/16 (a,bAlexander et al., 2015a, 2015b).
Introduction
In addition to its emerging roles in the pathophysiology of cardiovascular disease, metabolic syndrome (MS) and type 2 diabetes (DM2) (Cirillo et al., 2006; Johnson et al., 2013a), increases in serum concentrations of uric acid (UA) have been identified as a risk factor for the development and progression of chronic kidney disease (CKD) including nephropathy in both types of diabetes mellitus (Ficociello et al., 2010; Hovind et al., 2009; Jalal et al., 2010; Zoppini et al., 2012).
UA is generated from xanthine by xanthine oxidase (XO) as a final step in the metabolism of endogenous and exogenous purines. The XO inhibitor (XOi) allopurinol has been used for the treatment of hyperuricaemia and prevention of gout for decades. Reflecting the evidence showing hyperuricaemia as a risk factor for CKD (Ficociello et al., 2010; Hovind et al., 2009; Jalal et al., 2010; Zoppini et al., 2012), recently, we have investigated the effects of an XOi as a new nephroprotective treatment. The nephroprotective potential of XOi has been shown in various models of CKD (Kang et al., 2002; Kosugi et al., 2009; Omori et al., 2012; Ryu et al., 2013; Sanchez‐Lozada et al., 2008b; Sanchez‐Lozada et al., 2008c). Yet studies exploring the effects of XOi on the development of nephropathy in insulin‐resistant states and DM have been sparse and focused mainly on early stages of this disorder (Kosugi et al., 2009; Sanchez‐Lozada et al., 2008b). It remains to be determined whether favourable effects of XOi will translate into long‐term kidney protection in diabetes.
In parallel, some studies exploring the nephroprotective potential of XOi in patients with kidney disease have indicated that this treatment can be beneficial as it slows down the progression of CKD (Goicoechea et al., 2010; Siu et al., 2006). However, recent meta‐analysis of interventional studies with allopurinol (Bose et al., 2014) has shown that the data on effects of UA‐lowering therapy on renal outcomes are still insufficient, and it remains unclear whether long‐term XOi has beneficial effects on proteinuria, loss of glomerular filtration rate (GFR) and progression to end‐stage renal disease (Bose et al., 2014).
In this context, more studies are needed to elucidate the potential of XOi in the treatment of DN. To address this issue, we studied the long‐term effects of the more recently introduced XOi febuxostat on the development and progression of proteinuria as well as on structural and molecular markers of DN in vivo in experimental DM2. In addition, we conducted experiments exploring effects of febuxostat on molecular markers of fibrosis and fibrogenic signalling in renal cells stimulated in vitro by the components of diabetic milieu.
The results indicate that treatment with febuxostat has long‐term nephroprotective effects in experimental DM2 and enhances the protective effects of renin–angiotensin system (RAS) inhibitors in the diabetic kidney. Multiple mechanisms might contribute to the beneficial actions of febuxostat in the diabetic kidney, including those related to a reduction in serum UA levels and attenuation of renal peroxynitrite formation. Moreover, febuxostat possesses antifibrotic effects in vitro, which are independent of changes in extracellular UA levels and attributable to inhibition of profibrotic signalling via the kinase Akt.
Methods
In vivo studies
Rat model of DM2 and nephropathy
The studies were performed in male Zucker obese (ZO, fa/fa; Charles River, Wilmington, MA, USA) rats. The evolution of metabolic changes due to an autosomal recessive mutation of the fa‐gene, encoding the leptin receptor, resulting in hyperphagia, obesity, and hyperlipidaemia, IR, hyperinsulinaemia, impaired glucose tolerance, and slowly progressive increases in blood glucose (BG) levels (Ionescu et al., 1985; Kasiske et al., 1992; Phillips et al., 1996); as well as renal structural changes and molecular markers of nephropathy in ZO rats have been well characterized (Chander et al., 2004; Coimbra et al., 2000; Figarola et al., 2008; Kasiske et al., 1985). Age‐matched Zucker lean (ZL) rats without metabolic defects served as controls.
Animal welfare
The animals were housed with a light‐dark cycle of 12 h each, and with free access to food (standard chow) and water. All experiments were carried out with the approval of and in accordance with the regulations of the Portland VA Medical Center IACUC Committee and are reported in compliance with the ARRIVE guidelines (Kilkenny et al., 2010; McGrath & Lilley, 2015).
Study design
The treatment was initiated in 10‐week‐old ZO rats. The rats were randomly selected to receive the following treatments: febuxostat [ZO‐FBX, n = 12, 5 mg·kg−1 body wt (bwt) in drinking water after dissolution by sonication in 0.05 N NaOH; Sanchez‐Lozada et al., 2008b; 2008c] or drinking water vehicle alone (ZO‐VE, n = 12), supplemented with 0.6 mg·kg−1 of NaCl to maintain a salt concentration corresponding to that of the febuxostat‐containing water. An additional group of ZO rats received ‘late’ intervention (ZO‐FBXlate, n = 12) starting at week 10 of the follow up (20 weeks of age). The ZO‐FBX and ZO‐VE rats were compared with animals treated with the ACE inhibitor (ACEI) enalapril (ZO‐ENL, n = 12, 10 mg·kg−1·day−1), an established treatment for DN. Furthermore, the effects of the combination of febuxostat (5 mg·kg−1) and enalapril (10 mg·kg−1·day−1) were also evaluated in ZO animals (ZO‐FBX/ENL, n = 12). The results of structural and molecular analyses were also compared with vehicle‐treated age‐matched ZL rats (ZL‐VE, n = 10).
The treatment in ZO‐FBX, ZO‐ENL and combination groups was maintained for 18 weeks and 8 weeks in the late FBX treatment group. BG and awake systolic BP (SBP) (tail plethysmography) (Anderson et al., 2010) were measured at 6 week intervals together with 24 h urinary albumin excretion (UalbV), using metabolic cages. Following the last measurements in metabolic cages, the animals were anaesthetized and blood samples were obtained from the abdominal aorta for biochemical analyses [glycosylated haemoglobin (HBA1c), serum triglyceride and UA concentrations, and markers of systemic oxidative stress]. The kidneys were then harvested, partitioned and processed for histological evaluation, immunohistochemistry (IHC), western blotting and mRNA expression studies targeting molecular markers of DN and key signalling events involved in the pathophysiology of the disorder.
Renal structural analysis
Structural analyses were performed as previously described (Komers et al., 2011; Raij et al., 1984). Glomerulosclerosis score (GSS) was determined on periodic acid Schiff‐stained paraffin sections using a scale ranging from 0 to 4 for normal (0), 1 = 25% sclerosis, 2 = 50% sclerosis, 3 = 75% sclerosis and 4 = 100% sclerosis. On average, 200 glomeruli were evaluated per rat. Glomeruli with scores of 3 and 4 were considered to be severely affected. The proportion of severely affected glomeruli (SAG) per section was determined for each kidney. The measurements of tubulointerstitial fibrosis score (TIFS) were performed on Masson's Trichrome‐stained sections. The 100‐square grid was applied at low magnification (50×) on consecutive microscopic cortical fields. The number of squares containing stained fibrous tissue or atrophic tubules was recorded for each field and averaged for each kidney. Eighteen fields were evaluated for each kidney. All structural analyses were conducted in a blind manner on unidentified sections.
In vitro studies
Cell culture
Rat proximal tubule epithelial cells (NRK‐52E; American Tissue Culture Collection, Rockville, MD, USA) were maintained in DMEM (Life Technologies, Carlsbad, CA, USA) supplemented to 25 mM glucose with 10% fetal bovine serum.
Treatments
Serum‐deprived NRK were cultured and stimulated with TGF‐β (2 ng·mL−1; R&D Systems, Minneapolis, MA, USA) or with the receptor for advanced glycosylation end‐products (RAGE) ligand S100B (10 μg·mL−1, Calbiochem‐Millipore, Billerica, MA, USA) for prespecified periods of time (details provided in figure legends) alone or after 30 min pretreatment with (100 nM). The febuxostat concentration used in these experiments is based on published concentrations far exceeding K i values for purified bovine milk XO, indicating inhibition of both the oxidized and reduced forms of XO, but no significant effects on the activities of enzymes of purine and pyrimidine metabolism (Takano et al., 2005). After completion of study periods, the cells were collected, homogenized and processed for further analyses by immunoblotting. All in vitro studies were performed at least in triplicate.
General methods
Immunoblotting and IHC
The kidney cortical samples or cells were homogenized, processed and analysed by immunoblotting as previously described (Komers et al., 2006; Komers et al., 2011), using primary antibodies raised against TGF‐ß (1:600; Cell Signaling, Beverly, MA, USA), connective tissue growth factor (CTGF, 1:800; Santa Cruz, Santa Cruz, CA, USA), collagen IV (Coll4, 1:1500; Abcam, Cambridge, MA, USA), fibronectin (1:1000; Sigma, St. Louis, MO, USA), fibroblast‐specific protein 1 (FSP1/S100A4, 1:2500; Abcam), α‐smooth muscle actin (α‐SMA, 1:500; Abcam), vimentin (1:600; Santa Cruz), phospho‐Smad3 (1:500; Cell Signaling), total Smad3 (Cell Signaling), phospho Ser473 Akt (1:500; Cell Signaling), total Akt (Cell Signaling) and nitrotyrosine (NT, 1:500; Santa Cruz) followed by HRP‐conjugated secondary antibodies (Pierce, Rockford, IL, USA). Visualization, loading control and image analysis were accomplished as described previously (Komers et al., 2006). The same antibodies directed against FSP1, vimentin, α‐SMA and nitrotyrosine were used for IHC, as well as anti‐ED‐1 antibody (1:100; Santa Cruz) on formalin‐fixed, paraffin‐embedded kidney sections and processed as previously described (Komers et al., 2006). ED‐1 positive cells, as a marker of macrophage infiltration, were counted in 10 consecutive microscopic fields (×100) and data presented as a mean ± SEM per field.
Isolation of total RNA, synthesis of cDNA and quantitative real‐time PCR
RNA was extracted from frozen tissue fragments using trizol reagent (Invitrogen, Carlsbad, CA, USA) as per the manufacturer's protocol. To synthesize cDNA, 400 ng of trizol‐extracted total RNA was reverse transcribed with 200 units MMLV reverse transcriptase (Invitrogen) and oligo‐DT primers in 20 mL reactions. RT reactions were diluted 100‐fold with water prior to use in qPCR (Komers et al., 2013). The PCR reactions were done in 384‐well plates 2.0 μL final volume (1.0 μL cDNA template and 1.0 μL master mix, Bioline, Taunton, MA, USA) on ABI7900HT Real Time PCR system (40 cycles, annealing temperature 60°C for all primers) (ABI Biotechnology, Eldersburg, MD, USA). All PCR reactions were run in quadruplicates. mRNA levels are represented as ratios to ß‐actin transcript calculated as differences from their respective average cycle threshold (Ct) values, deltaCt. The gene‐specific primers Coll4, fw, are as follows: CACTATGAAAACCGTAAAGTGCCTTA, rev: GCAAACAGAGGCCAACGAA; Fibronectin, fwd: GGTCTGGGATCAAAGGGAAA, rev: CGCTCTTGGGTACTACCATT; CTGF, fw: GACAGCTTGTGGCAAGTGAA, rev: TCGATGGTGTTTGGAGTTTG; plasminogen activator inhibitor‐I (PAI‐I), fw: GCTCCTGGTCAACCACCTTA, rev: TGGAGATGTAACGGATGCAG; FSP1, fw: AGGACAGACGAAGCTGCATT, rev: CTCACAGCCAACATGGAAGA; vimentin, fw: ACTTCTCAGCACCACGATGA, rev: CTTTTGGGGGTGTCAGTTGT; ß‐actin, fw: CTCTGAACCCTAAGGCCAAC, rev: GACCAGAGGCATACAGGGAC.
Measurements of UA and xanthine
Serum UA and xanthine concentrations were measured by HPLC as previously described (Cooper et al., 2006) using HPLC column Synergi 4u Hydro‐RP 80A, 250 × 4.6 mm and guard column SecurityGuard Guard Cartridge from Phenomenex (Torrance, CA, USA). Standards and samples were diluted 1:5 with 47 mM KH2PO4, filtered through Centrifree YM‐30 filters and injected (50 μL) onto an HPLC column.
Biochemical methods
Serum creatinine concentrations were measured by spectrophotometric assay (Bioviosion, Mountain View, CA, USA). Urinary albumin concentrations were determined using the Nephrat kit (Exocell, Philadelphia, PA, USA). HBA1c was determined by affinity column chromatography (Glyco‐Gel B; Pierce Chemical). Thiobarbituric acid reactive substances (TBARS; Cayman Chemical, Ann Arbor, MI, USA) (Yagi, 1998) and 8‐isoprostane (8‐epi PGF2α; Cayman Chemical) (Morrow et al., 1995) concentrations were analysed by elisa according to the manufacturer's instructions. Blood glucose was measured using a reflectance meter (One Touch II; Lifescan, Milpetas, CA, USA).
Statistical analysis
The data and statistical analysis comply with the recommendations on experimental design and analysis in pharmacology (Curtis et al., 2015). Data are expressed as means ± SEM and analysed by ANOVA with Newman–Keuls multiple comparison post test. Statistical significance was defined as P < 0.05. The post hoc test was performed only if P < 0.05, and there was no significant inhomogeneity of variance. Urinary albumin excretion was not normally distributed and therefore analysed after logarithmic transformation and expressed as geometric means ×/÷ tolerance factor.
Results
Physical and metabolic parameters in Zucker lean (ZA) and ZO rats
As summarized in Table 1, all ZO rats demonstrated increases in body weight and renal hypertrophy, moderate hyperglycaemia and increases in HBA1c and serum triglyceride concentrations as compared with lean animals. None of these parameters were influenced by treatment with febuxostat, enalapril or their combination. Treatment with febuxostat normalized UA in all treated groups and resulted in reciprocal increase in xanthine concentrations. In ZO‐ENL, UA and xanthine concentrations remained comparable with those in ZO‐VE rats.
Table 1.
Physical and metabolic parameters after completion of the study
| Group | bwt (g) | RKW (g) | RKW/bwt (g· 100 g−1 bwt) | BG (mM) | HBA1c (%) | TG (mM) | UA (μM) | Xanthine (μM) |
|---|---|---|---|---|---|---|---|---|
| ZL‐VE | 389 ± 10 | 1.2 ± 0.1 | 0.32 ± 0.01 | 4.0 ± 0.3 | 3.2 ± 0.1 | 5.2 ± 1.2 | 29 ± 1 | 16 ± 1 |
| ZO‐VE | 459 ± 13a | 2.0 ± 0.1a | 0.44 ± 0.02a | 16.2± 1.5a | 4.9 ± 0.2a | 26.6 ± 2.4a | 58 ± 12ab | 15 ± 1 |
| ZO‐FBX | 458 ± 23a | 1.9 ± 0.1a | 0.42 ± 0.02a | 17.7 ± 1.1a | 4.9 ± 0.2a | 29.5 ± 1.2b | 31 ± 3 | 48 ± 7c |
| ZO‐FBXlate | 440 ± 15a | 2.0 ± 0.2a | 0.46 ± 0.03a | 18.0± 1.0a | 5.0 ± 0.2a | 26.2 ± 1.0a | 25 ± 2 | 49 ± 3c |
| ZO‐ENL | 454 ± 22a | 1.8 ± 0.1a | 0.40 ± 0.02a | 17.5 ± 1.4a | 5.2 ± 0.2a | 29.2 ± 2.0a | 63 ± 4ab | 19 ± 1 |
| ZO‐FBX + ENL | 464 ± 14a | 2.0 ± 0.1a | 0.44 ± 0.03a | 16.0 ± 1.6a | 5.2 ± 0.2a | 25.5 ± 1.5a | 29 ± 2 | 45 ± 4c |
There were 10 animals in the ZL‐VE group and 12 animals in each ZO group.
RKW, right kidney wt; LKW, left kidney wt; TG, triglycerides.
P < 0.05 versus ZL‐VE.
P < 0.05 versus FBX‐treated rats (ZO‐FBX, ZO‐FBXlate, ZO‐FBX + ENL).
P < 0.05 versus rats not receiving FBX.
Effects of febuxostat, enalapril and their combination on BP, UalbV, renal structural parameters and gene expression
At baseline, there were no differences in SBP among the groups of rats. Figure 1 shows mean treatment‐induced changes in SBP from baseline in individual groups of rats. At week 12, SBP responses in enalapril‐treated animals (both in monotherapy and in combination with febuxostat) were different from ZO‐VE. At the end of the follow up, SBP responses in ZO‐ENL were different from ZO‐VE and ZO‐FBXlate, whereas ZO rats receiving febuxostat and enalapril combination demonstrated different responses as compared with other groups of rats except the ZO‐ENL counterparts. The means of SBP in individual groups at baseline and at subsequent study time points are presented in the Supporting Information Fig. S1.
Figure 1.
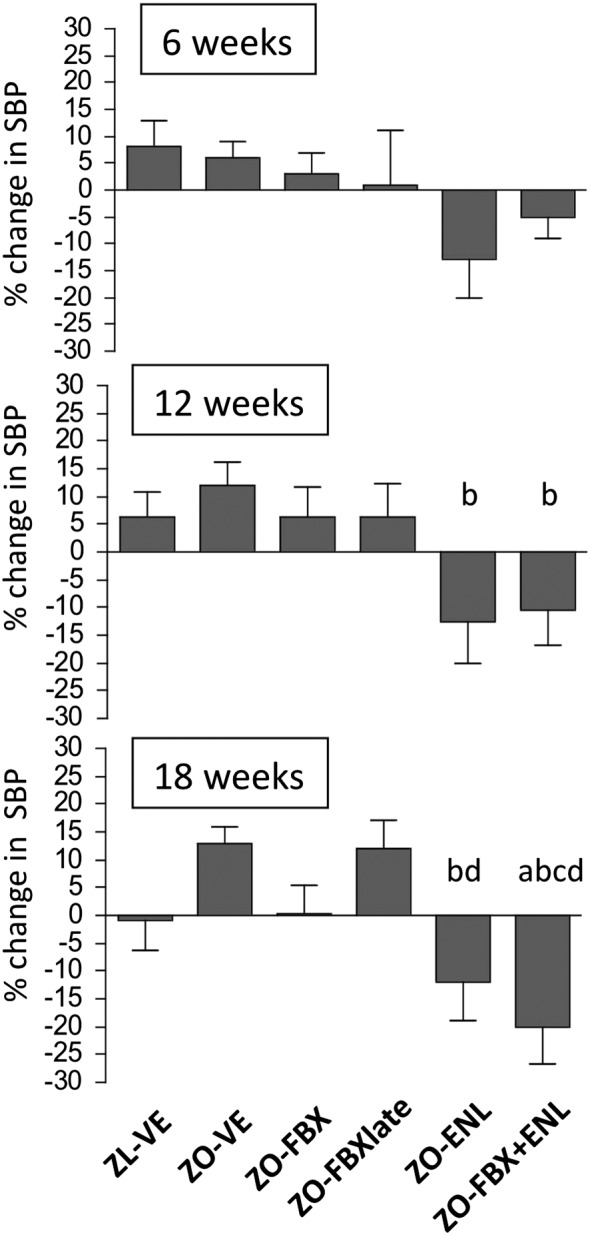
Treatment‐induced changes in SBP. Graphs show % changes in SBP in individual groups of rats at different study time points as compared with baseline. There were 10 animals in ZL‐VE group and 12 animals in each ZO group. a P < 0.05 versus ZL‐VE; b P < 0.05 versus ZO‐VE; c P < 0.05 versus ZO‐FBX; d P < 0.05 versus ZO‐FBXlate.
As shown in Figure 2, UalbV progressively increased in ZO‐VE rats. This increase in UalbV was attenuated by all treatments including the febuxostat, albeit not when administered later in the course of the disease. There were no statistically significant differences in UalbV between the ZO‐FBX, ZO‐ENL and the ZO‐FBX + ENL groups of rats. Serum creatinine concentrations, determined at the end of the follow up, were elevated in ZO‐VE rats as compared with lean controls (ZL‐VE: 78 ± 9 vs. ZO‐VE: 143 ± 9 μM, P < 0.05). All treatments resulted in a decrease in S‐Cr, albeit only the rats receiving FBX + ENL combination displayed a significant S‐Cr reduction compared with untreated ZO rats (ZO‐FBX: 116 ± 10, ZO‐FBXlate: 119 ± 13, ZO‐ENL: 110 ± 13, ZO‐FBX + ENL: 90 ± 6; P < 0.05, ZO‐FBX + ENL vs. ZO‐VE)
Figure 2.
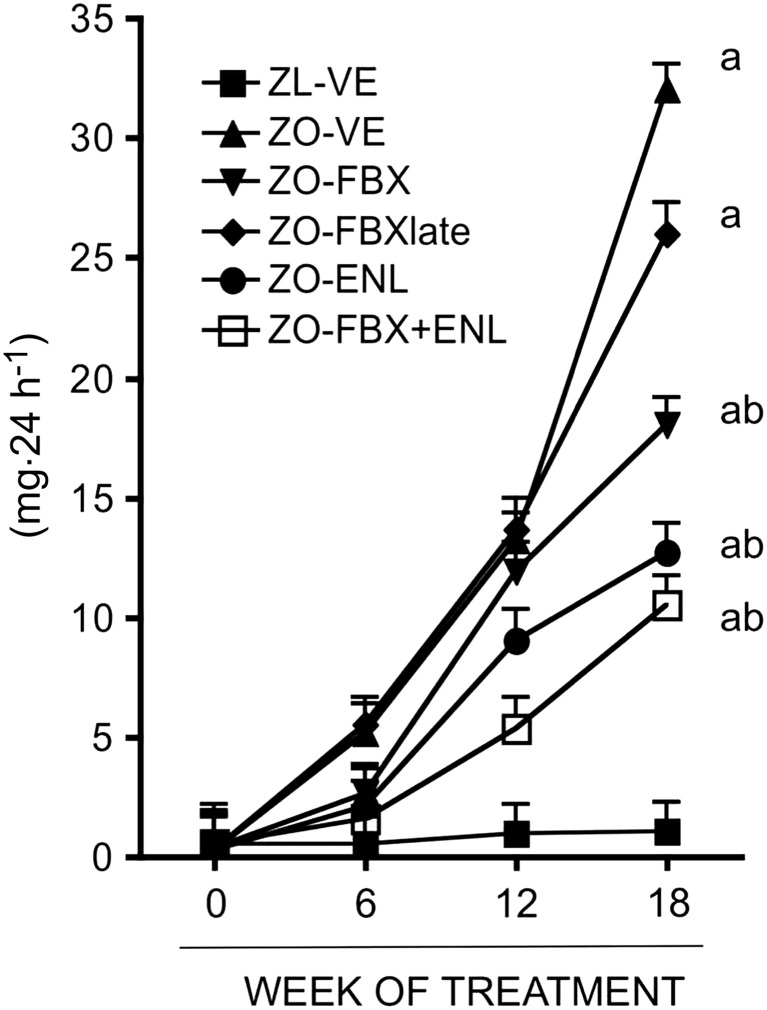
Effect of febuxostat, enalapril and their combination on urinary albumin excretion. Data are expressed as geometric means ×/÷ tolerance factor. Statistically significant differences between the groups were detected at week 18. There were 10 animals in ZL‐VE group and 12 animals in each ZO group. a P < 0.05 versus ZL‐VE; b P < 0.05 versus ZO‐VE.
Compared with their lean counterparts, ZO‐VE developed advanced GS and TIF, as determined by increases in GSS and TIFS as well as higher proportion of SAG (Figure 3). Treatment with febuxostat attenuated both the development of GS (GSS: P < 0.05; SAG: P < 0.05 vs. ZO‐VE) and TIF (P < 0.05). The delayed treatment with febuxostat was also effective at reducing GS and TIF scores, albeit the proportion of SAG in ZO‐FBXlate was not statistically lower as compared with that in ZO‐VE rats. The monotherapy with enalapril also significantly ameliorated the development of GS and TIF in ZO rats (P < 0.05 vs. ZO‐VE; Figure 3). Some of these effects of enalapril were more prominent as compared with those of febuxostat‐treated animals (GSS: P < 0.05 vs. ZO‐FBX, P < 0.05 vs. ZO‐FBXlate; SAG: P < 0.05 vs. ZO‐FBXlate; TIFS: P < 0.05 vs. ZO‐FBX, P < 0.05 vs. ZO‐FBXlate). The combination of both agents had similar beneficial effects on GS characteristics and TIF as the monotherapy with enalapril (Figure 3), being more prominent than in febuxostat‐treated animals. However, the TIFS was, in ZO‐FBX + ENL rats, lower than that in all other groups of ZO rats including the ZO‐ENL and was not different from that in ZL rats.
Figure 3.
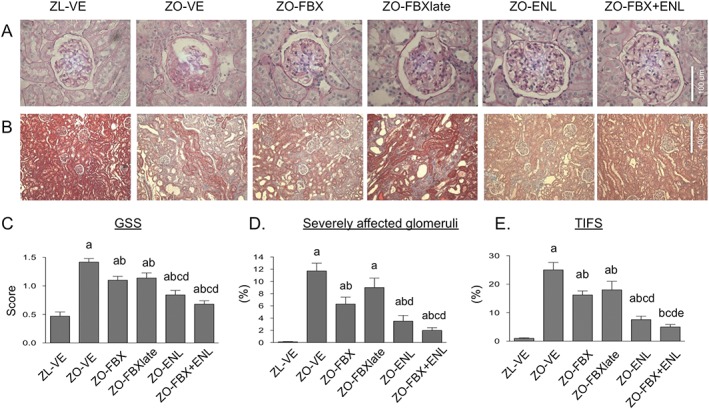
Analysis of GSS, % of severely affected glomeruli (SAG) and TIFS. (A) Representative microphotographs of glomeruli stained with periodic acid Schiff with different degrees of glomerular sclerosis (GS) and (B) interstitial regions stained with Trichrome showing areas of various degrees of interstitial fibrosis and tubular atrophy in individual groups of rats. (C) Bar graph presentation of quantitative evaluation of GSS, (D) % of SAG and (E) TIFS. There were 10 animals in ZL‐VE group and 12 animals in each ZO group. a P < 0.05 versus ZL‐VE; b P < 0.05 versus ZO‐VE; c P < 0.05 versus ZO‐FBX; d P < 0.05 versus ZO‐FBXlate; e P < 0.05 versus ZO‐EN.
Consistent with histological findings, this study shows that ZO‐VE rats displayed increased mRNA expression of the selected genes associated with TIF (Coll4, fibronectin, PAI‐I, FSP1 and vimentin) (Table 2), albeit the increase in CTGF mRNA did not reach statistical significance. Treatment with febuxostat resulted in lower FSP1 mRNA expression as compared with untreated ZO‐VE. This effect was also apparent in rats with delayed febuxostat treatment. A reduction in FSP1 mRNA was also detected in ZO‐ENL, in addition to a reduction in PAI‐I. Vimentin mRNA was lower in febuxostat‐treated animals as compared with ZO‐ENL. Importantly, the combination treatment was effective in reducing mRNA expression of all selected profibrotic genes as compared with ZO‐VE and in some cases (fibronectin, CTGF, PAI‐I and vimentin) compared with febuxostat or enalapril monotherapies (Table 2).
Table 2.
Expression of profibrotic genes in ZL and ZO rats
| Gene | Rat group | |||||
|---|---|---|---|---|---|---|
| ZL‐VE | ZO‐VE | ZO‐FBX | ZO‐FBXlate | ZO‐ENL | ZO‐FBX + ENL | |
| Coll4 | 0.305±0.037 | 0.503 ± 0.068a | 0.351 ± 0.036 | 0.425 ± 0.042 | 0.373 ± 0.025 | 0.300 ± 0.050b |
| Fibronectin | 0.026 ± 0.003 | 0.074 ± 0.006a | 0.065 ± 0.008a | 0.077 ± 0.007a | 0.059 ± 0.009a | 0.044 ± 0.002a b d |
| CTGF | 0.383 ± 0.034 | 0.490 ± 0.054 | 0.389 ± 0.033 | 0.406 ± 0.044 | 0.529 ± 0.055 | 0.192 ± 0.034b e |
| PAI‐I | 0.009 ± 0.002 | 0.027 ± 0.005a | 0.024 ± 0.003a | 0.028 ± 0.004a | 0.016 ± 0.002b c d | 0.008 ± 0.001b c d |
| FSP1 | 0.083 ± 0.018 | 0.185 ± 0.035b | 0.104 ± 0.011d | 0.137 ± 0.014c | 0.122 ± 0.008c | 0.095 ± 0.008d |
| Vimentin | 0.239 ± 0.057 | 0.605 ± 0.094a | 0.397 ± 0.054d e | 0.783 ± 0.108a | 0.632 ± 0.057a | 0.376 ± 0.025b d e |
mRNA level of a given gene in each sample was normalized to ß‐actin transcript. Explanation of abbreviations is in the text. There were 10 animals in ZL‐VE group and 12 animals in each ZO group.
P < 0.05 versus ZL‐VE.
P < 0.05 versus ZO‐VE.
P < 0.05 versus ZO‐FBX.
P < 0.05 versus ZO‐FBXlate; ep < 0.05 versus ZO‐ENL.
Impact of febuxostat on renal protein expression and localization of markers and mediators of diabetic glomerulosclerosis and TIF
We next determined the impact of febuxostat on renal protein expression of established mediators and markers of GS and TIF. Moreover, these analyses gave us an opportunity to compare the effects of febuxostat with those of enalapril and determine possible differences between the two interventions.
Immunoblot analysis of profibrotic factors and extracellular matrix (ECM) proteins showed increases in renal abundance of TGF‐ß, CTGF and Coll4 (Figure 4) in ZO‐VE as compared with lean controls. Increases in these parameters were reduced to a similar extent by both febuxostat and enalapril treatments. Further analyses determined renal cortical abundance and localization of mesenchymal markers that are being expressed during the development of TIF (Kalluri, 2009; Ren and Duffield, 2013). As shown in Figure 5, vimentin and FSP1 (also known as S100A4) were elevated in ZO‐VE as compared with ZL‐VE rats. These changes were ameliorated in both febuxostat‐ and enalapril‐treated animals. Vimentin immunoreactivity in ZL‐VE was localized only in glomeruli and renal vessels. In addition to glomerular localization of vimentin, observed in all groups of rats, ZO‐VE displayed abundant tubulointerstitial immunoreactivity of this protein, which was less apparent in both febuxostat‐ and enalapril‐treated diabetic kidneys (Figure 5). FSP1 immunoreactivity was barely detectable in ZL‐VE kidney sections. In contrast, ZO‐VE rats demonstrated accumulations of FSP1‐positive cells in the cortical interstitium (Figure 5), frequently associated with areas of tubular atrophy and surrounding fibrosis. Both treatments were associated with lower number of vimentin‐ and FSP1‐positive cells in tubulointerstitial compartment. There were no differences in renal cortical α‐SMA abundance between the ZL and ZO rats when analysed by immunoblotting. Yet IHC showed that in addition to vascular structures, vehicle‐treated ZO rats displayed tubulointerstitial immunoreactivity of α‐SMA. This phenomenon was not detected in ZO‐FBX or ZO‐ENL animals, suggesting the effects of treatments in non‐vascular compartments.
Figure 4.
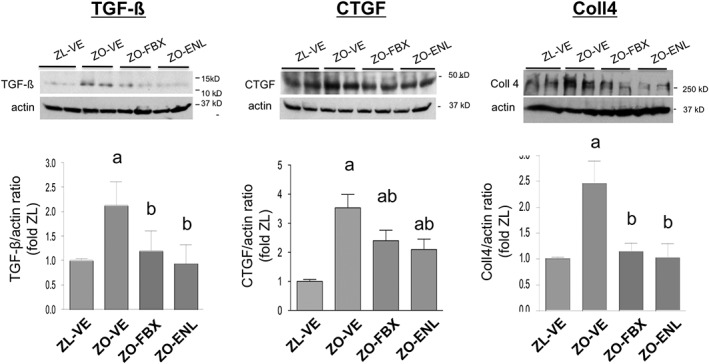
Renal protein expression of TGF‐β, CTGF and Coll4. TGF‐β (A), CTGF (B) and Coll4 (C) protein expression was analysed by immunoblotting in renal cortical homogenates. Renal homogenates from randomly selected six animals from each group were used. The upper insets show representative blots in ZL‐VE (lanes 1–2) and ZO‐VE (lanes 3–4) rats and in ZO‐FBX (lanes 5–6) or ZO‐ENL (lanes 7–8) rats. The graphs show densitometric analysis of western blots. Febuxostat and enalapril were both effective in reducing diabetes‐induced increases in renal TGF‐ß and CTGF expression and reduced abundance of Coll4. The data are presented as mean ± SEM of protein/actin ratios. a P < 0.05 versus ZL‐VE; b P < 0.05 versus ZO‐VE.
Figure 5.
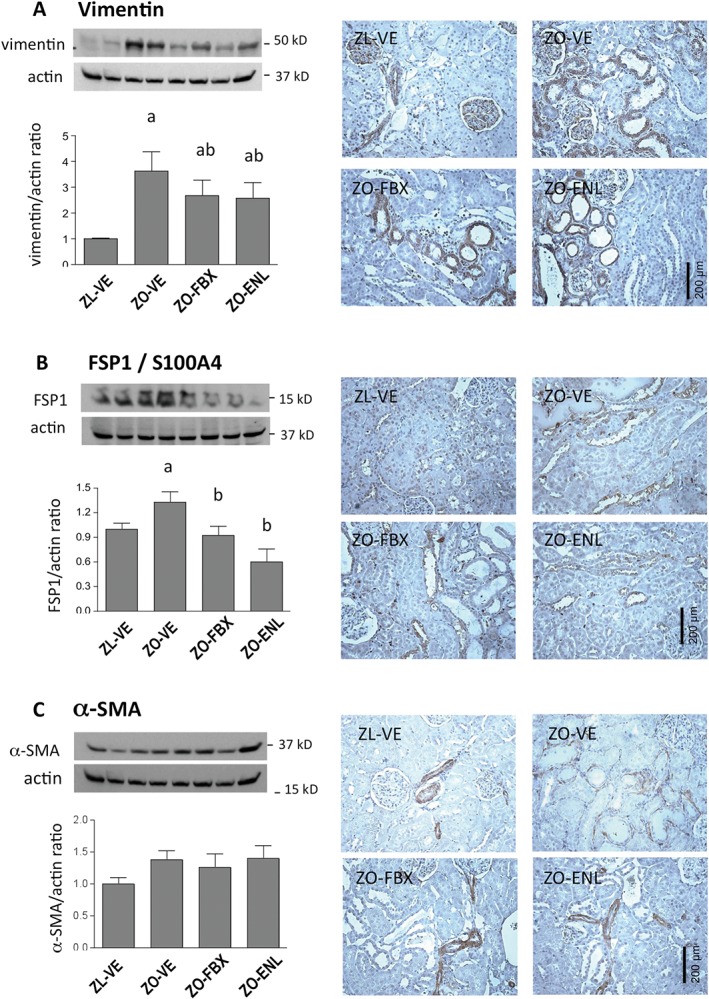
Immunohistochemical expression and localization of mesenchymal markers in renal cortex. Vimentin (A), FSP1/S100A4 (B) and α‐SMA (C) protein expression was analysed by immunoblotting in renal cortical homogenates (n = 6 each group). The graphs show densitometric analysis of western blots. The upper insets show representative blots of vimentin FSP1 and α‐SMA in ZL‐VE (lanes 1‐2) and ZO‐VE (lanes 3‐4) rats and in ZO‐FBX (lanes 5–6) or ZO‐ENL (lanes 7–8) rats. Data are presented as protein/actin ratios. Right panels show corresponding representative microphotographs (×200) of immunohistochemical localization of these proteins. a P < 0.05 versus ZL‐VE; b P < 0.05 versus ZO‐VE.
Effect of febuxostat on systemic and tissue markers of oxidative stress and renal inflammation
Serum levels of TBARS (Yagi, 1998) and 8‐epi PGF2α (Morrow et al., 1995), which reflect peroxynitrite formation (Ferraro et al., 2003; White et al., 1994) and have been linked to enhanced XO activity (Gao et al., 2008; Khadour et al., 2002), were elevated in ZO‐VE rats and remained unchanged by monotherapies with febuxostat and enalapril (Figure 6A, B). By contrast, treatment with FBX + ENL combination near‐normalized serum concentrations of these markers. NT has been used as a marker of tissue nitrosylated products and a fingerprint of local production of peroxynitrite (Chander et al., 2004; Xia and Zweier, 1997), which could be in part attributable to actions of XO (Bagi et al., 2002; Zweier et al., 1994). Immunoblotting showed increased abundance of NT in ZO‐VE (Figure 6C), which was significantly reduced by treatment with both febuxostat and enalapril, the latter being more effective than febuxostat. In all groups of rats, NT immunoreactivity was detected in some glomeruli and occasional endothelia of intertubular capillaries. However, tubular and interstitial NT immunoreactivity was detectable only in ZO‐VE and to a lesser degree in ZO‐FBX rats, whereas ZO‐ENL displayed a pattern akin to lean rats (Figure 6D).
Figure 6.
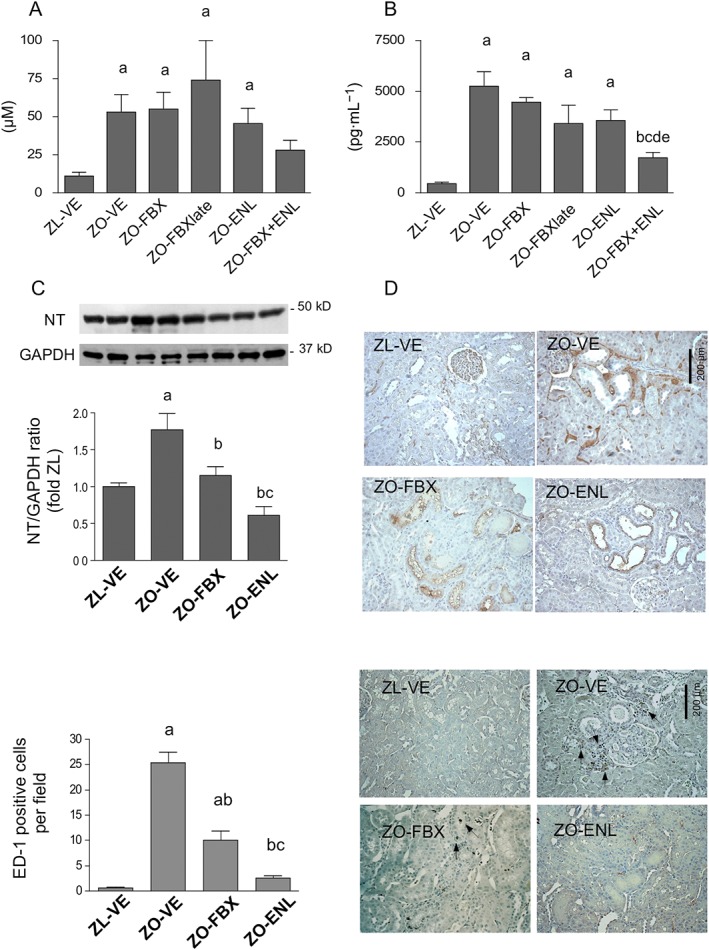
Systemic and renal markers of oxidative stress. TBARS (A) and 8‐epi PGF2α (B) were measured in serum as markers of the systemic oxidative stress by elisa. Immunoblotting of renal cortical homogenates was used to determine abundance of NT (C) as a marker of protein nitrosylation in kidney tissue (n = 6 each group). The upper insets show representative blots of NT and a loading control GAPDH in ZL‐VE (lanes 1–2) and ZO‐VE (lanes 3–4) rats and in ZO‐FBX (lanes 5–6) and ZO‐ENL (lanes 7–8) groups. The graphs show densitometric analysis of western blots. Data are presented as protein/GAPDH ratios. (D) Renal immunohistochemical localization of NT in these groups of rats. (E and F) Mean numbers of ED‐1 positive cells (arrows) per microscopic field and representative images in the same groups of rats. a P < 0.05 versus ZL‐VE; b P < 0.05 versus ZO‐VE; c P < 0.05 versus ZO‐FBX; d P < 0.05 versus ZO‐FBXlate; e P < 0.05 versus ZO‐ENL.
Number of ED‐1‐positive cells, determined as a measure of macrophage infiltration, was markedly elevated in ZO‐VE rats and reduced by both febuxostat and enalapril treatment (Figure 6E, F). Treatment with enalapril was more effective than febuxostat in reducing macrophage infiltration.
Effect of febuxostat on profibrotic signalling in vitro
Further studies were conducted to evaluate whether the antifibrotic actions of febuxostat detected in vivo could be reproduced in vitro in a more controlled environment. Rat renal tubular cells (NRK) were stimulated with TGF‐ß or the RAGE ligand S100B with and without pretreatment with febuxostat. As depicted in Figure 7, febuxostat attenuated TGF‐ß‐ and S100B‐induced increases in CTGF, fibronectin and α‐SMA protein expression.
Figure 7.
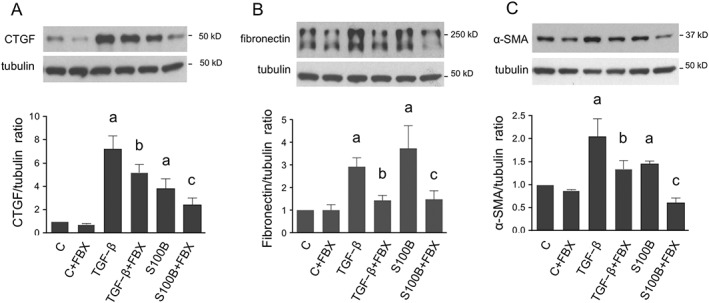
Effect of FBX on markers of fibrosis in renal tubular cells in vitro. Serum‐deprived NRK cells cultured in UA‐free media were stimulated with TGF‐β (2 ng·mL−1) or with RAGE ligand S100B (10 μg·mL−1) for 48 h alone or after 30 min pretreatment with FBX (100 nM) and compared with unstimulated cells with (C‐FBX) or without FBX treatment as time controls (designed as C). CTGF (A), fibronectin (B) and α‐SMA (C) were analyzed by western blot. The order of lanes corresponds to conditions in bar graphs. a P < 0.05 versus C; b P < 0.05 versus TGF‐β; c P < 0.05 versus S100B.
As shown in Figure 8A, pretreatment with febuxostat had no impact on TGF‐ß‐induced Ser423/425 phosphorylation of its major signalling effector, Smad3. Analysis of renal cortical homogenates (Figure 8B) was in accord with these in vitro findings; ZO‐VE rats displayed increased Smad3 phosphorylation as compared with lean counterparts, which was normalized by treatment with enalapril, but not with febuxostat. There were no differences between the groups in total Smad3 abundance.
Figure 8.
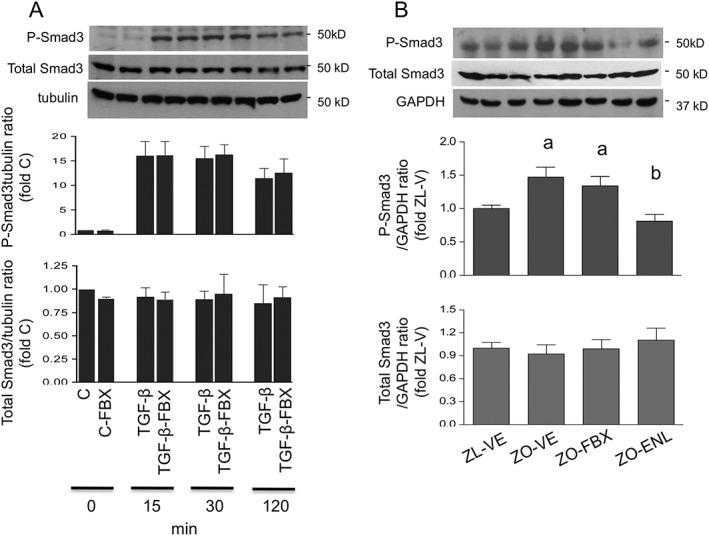
Effect of febuxostat on TGF‐β‐induced Smad3 phosphorylation. (A) Smad3 Ser423/425 phosphorylation (P‐Smad3) and total Smad3 were determined by immunoblotting in serum‐deprived NRK cells stimulated with TGF‐β for 15, 30 and 120 min in the presence or absence of FBX and compared with unstimulated controls. Upper insets show representative blots of Smad3 and tubulin used as the loading control. The order of lanes corresponds to conditions in bar graphs. (B) The same technique was used for analysis of renal cortical P‐Smad3 and total Smad3 protein expression in ZL and ZO rats (n = 6 each group). The upper insets show representative Smad3 blots and GAPDH loading control in ZL‐VE (lanes 1–2) and ZO‐VE (lanes 3–4) rats and in ZO‐FBX (lanes 5–6) or ZO‐ENL (lanes 7–8) rats. The graphs show densitometric analysis of western blots. a P < 0.05 versus ZL‐VE; b P < 0.05 versus ZO‐VE.
Further experiments focused on possible effects of febuxostat on Smad‐independent pathways of TGF‐ß signalling. Akt has been implicated in this process (Lan and Du, 2014). Stimulation of NRK cells with TGF‐ß induced rapid Ser473 Akt phosphorylation in NRK cells, which was attenuated by pretreatment with febuxostat (Figure 9A). Since RAGE stimulation has been also shown to activate Akt (Arcuri et al., 2005; Leclerc et al., 2007), we also evaluated whether the effects of febuxostat can be observed in cells stimulated with S100B. Similar to TGF‐ß‐stimulated cells, febuxostat attenuated S100B‐induced Akt (Figure 9B). Parallel analysis of renal cortical homogenates from ZL and ZO rats confirmed DM‐induced Akt phosphorylation and its reduction by treatment with febuxostat. This effect was not, however, observed in ZO rats treated with enalapril (Figure 9C).
Figure 9.
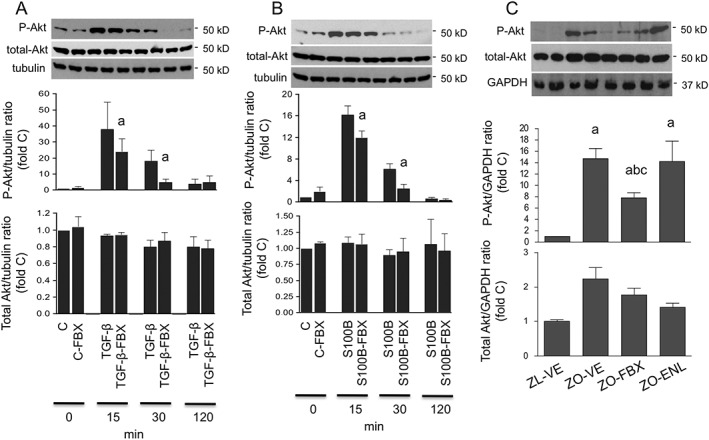
Effect of febuxostat on Akt phosphorylation. Serum‐deprived NRK cells were stimulated with TGF‐β (A) or S100B (B) for 15, 30 and 120 min in the presence or absence of FBX and compared with unstimulated cells (abbreviated as C). Ser473 phosphorylation (P‐Akt) and total Akt were determined by immunoblotting. Upper insets show representative blots of Akt and tubulin loading control. The order of lanes corresponds to conditions in bar graphs. a P < 0.05 versus TGF‐β‐ or S100B‐stimulated counterparts without FBX treatment. (C) The same technique was used for analysis of renal cortical P‐Akt and total Akt protein expression in ZL and ZO rats (n = 6 each group). The upper insets show representative Akt blots and GAPDH loading control in ZL‐VE (lanes 1–2) and ZO‐VE (lanes 3–4) rats and in ZO‐FBX (lanes 5–6) or ZO‐ENL (lanes 7–8) rats. The graphs show densitometric analysis of western blots. a P < 0.05 versus ZL‐VE; b P < 0.05 versus ZO‐VE; c P < 0.05 versus ZO‐ENL.
Discussion
The treatment with febuxostat attenuated the development of proteinuria and renal structural changes in ZO rats with DM2. These effects of febuxostat were independent of major risk factors for initiation and progression of DN, such as metabolic as well as BP control. Consistent with beneficial effects in renal architecture, febuxostat reduced renal expression of some prosclerotic/profibrotic genes and attenuated the abundance of protein markers and mediators of renal fibrosis and GS.
Only a few studies have thus far evaluated the effects of XOi in models of MS and DM2. Sanchez‐Lozada et al., (2008b) reported that the treatment with febuxostat decreased BP, glomerular capillary pressure and afferent arteriolar hypertrophy in insulin‐resistant fructose‐fed rats, findings consistent with nephroprotective effects. Renal structural analysis or measurements of proteinuria were not performed in that study. In another report, allopurinol reduced albuminuria in db/db mice (Kosugi et al., 2009) together with renal immunohistochemical reactivity of TGF‐ß, osteopontin and collagen III. In addition, allopurinol prevented the development of tubular dilation in db/db mice, used as a marker of tubular injury. Our present observations are in accord with these reports but extend these findings to show that a spectrum of beneficial effects of XOi found previously at early stages of nephropathy in MS and/or DM2 can be translated into long‐term nephroprotection.
These complex actions of an XOi interfering with the development of TIF and GS on both the structural and molecular levels have not been thus far described in experimental DM. An effect on fibrogenesis is particularly important since the development of TIF is the major driving force of a progressive decline in GFR at the later stages of kidney diseases (Diamond and Anderson, 1990). Previous studies have indicated antifibrotic actions of XOi in non‐diabetic context. In rats, oxonic acid‐induced hyperuricaemia stimulated expression of mesenchymal markers in renal tubular cells after a relatively short period of time (6–7 weeks) (Ryu et al., 2013). These changes were ameliorated by the treatment with allopurinol, which also led to a significant reduction in serum UA levels. Similarly, allopurinol ameliorated TIF in rats with unilateral ureteral obstruction (Omori et al., 2012) and in the rat remnant kidney model (Sanchez‐Lozada et al., 2008c).
Hyperuricaemia can trigger spectrum mechanisms, which are relevant for the pathophysiology of DN, such as haemodynamic changes leading to increased glomerular pressure and structural changes in afferent arterioles (Sanchez‐Lozada et al., 2008a), endothelial dysfunction with reduced bioavailability of NO (Gersch et al., 2008; Hu et al., 2009; Sanchez‐Lozada et al., 2008a), activation of RAS (Corry et al., 2008; Mazzali et al., 2002) and a variety of pro‐oxidant, inflammatory and fibrogenic actions (Hu et al., 2012; Ryu et al., 2013; Sanchez‐Lozada et al., 2008a; Yang et al., 2010). Consequently, as an XOi, febuxostat is most likely to exert its protective effects by lowering UA. Indeed, protective effects of febuxostat in the kidney were paralleled by normalization of UA levels in ZO rats without affecting established driving forces of DN such as hyperglycaemia or hyperlipidaemia.
Yet in addition to its role in UA synthesis, XO is an enzyme with dual function that contributes to the generation of ROS (Zweier et al., 1994) and secondarily to peroxynitrite formation (Bagi et al., 2002), one of the most powerful reactive species produced by the reaction of NO and superoxide radicals. Consequently, XO actions may contribute to renal pathophysiology via increases of the systemic or local nitrosative stress.
Treatment with febuxostat partially ameliorated the increases in renal NT abundance observed in ZO rats, in accord with the postulated impact of the drug on enhanced peroxynitrite formation in the kidney. A reduction in renal NT has been previously linked to nephroprotective actions of a variety of interventions, including XOi, in different models of kidney disease (DeRubertis et al., 2004; Omori et al., 2012; Onozato et al., 2002). In contrast, previously described beneficial renal effects of allopurinol in db/db mice were not associated with reductions of renal NT and other indicators of oxidative stress (Kang et al., 2002; Kosugi et al., 2009; Omori et al., 2012; Ryu et al., 2013; Sanchez‐Lozada et al., 2008b; 2008c). Longer treatment period, as applied in the present study, may be required for detection of this effect of XOi in the diabetic kidney, or as suggested by some studies in the non‐renal context, febuxostat may be more effective than allopurinol in its antioxidant efficacy (Malik et al., 2011; Tausche et al., 2014). Unlike tissue NT, treatment with febuxostat did not influence systemic markers of ROS generation, suggesting that XO is not the major source of the systemic production of ROS at least in this model of DM2. Yet some antioxidant potential could be inferred from its ability to enhance the antioxidant actions of an ACEI, discussed below. Altogether, a reduction of nitrosative stress could, in addition to UA lowering, contribute to the protective actions of febuxostat in the kidney. Adding complexity to this matter, hyperuricaemia per se has been implicated in oxidative stress, leading to early functional and molecular changes in the rat kidney (Sanchez‐Lozada et al., 2008a), and UA lowering could further enhance the antioxidant effects of the XOi.
We compared the nephroprotective potential of febuxostat with the ACEI enalapril, one of the established treatments for DN. As expected, monotherapy with enalapril had beneficial effects in ZO rat kidneys, and the data indicate that enalapril is more protective than febuxostat in diabetic kidney considering its more prominent impact on TIF, NT abundance and inflammatory infiltration. Yet other effects of febuxostat on major molecular markers of DN and fibrosis were comparable with those of enalapril. Importantly, the best therapeutic effect was observed in ZO rats treated with a combination of both agents as the kidney function was best preserved in this group and TIFS was reduced to a greater degree than achieved by both monotherapies. Superior effects of the combination were also apparent when we analysed the renal mRNA expression of profibrotic genes, up‐regulated in diabetic kidneys, and system markers of oxidative stress. Altogether, these observations suggest potentially clinically relevant additive nephroprotective effects of the combination as compared with both monotherapies. Of note, SBP was at the end of the follow up the lowest in the combination group, which could have contributed to superior nephroprotection. However, as shown in Figure 1, the effect of combined treatment on SBP was driven mainly by enalapril.
As the antifibrotic effects of febuxostat were prominent in this study, we embarked on in vitro studies in renal tubular cells to further evaluate these actions in a more controlled environment. In accord with in vivo observations, febuxostat attenuated TGF‐β‐stimulated production of CTGF, fibronectin and α‐SMA also in NRK cells. The results were reproduced in cells exposed to the RAGE ligand S100B selected as another component of the diabetic milieu. These findings suggest that febuxostat interferes with general mechanisms of fibroproduction in renal cells. Of note, these experiments were conducted in the UA‐free environment, suggesting that febuxostat can exert beneficial effects independently of changes in extracellular UA levels. We cannot exclude that these effects are mediated by suppression of intracellular UA. The importance of the reduction of intracellular UA has been previously emphasized (Johnson et al., 2013b).
Interestingly, febuxostat did not attenuate TGF‐β‐stimulated Smad3 phosphorylation in NRK cells. This lack of effect on Smad3 was then also detected in renal cortical homogenates from ZO‐FBX rats contrasting with the in vivo effect of enalapril. Akt has been implicated in Smad‐independent TGF‐β signalling (Lan and Du, 2014; Park et al., 2013), being involved in a number of pathophysiological processes in the diabetic kidney (Zdychova and Komers, 2005), including growth and fibrosis (Mariappan et al., 2007). Our previous studies in ZO rats (Zdychova et al., 2008) as well as studies by others in models of DM2 (Feliers et al., 2001) have shown enhanced renal Akt activity. In addition, Akt operates downstream of RAGE and can be stimulated with S100B (Arcuri et al., 2005; Leclerc et al., 2007). In contrast to Smad3, febuxostat attenuated TGF‐β‐induced Akt phosphorylation in NRK cells. Similar to TGF‐β stimulation, S100B led to marked Akt activation in NRK cells, which was attenuated by the pretreatment with febuxostat. This effect of febuxostat on Akt was in parallel observed in renal tissue in vivo in rats and contrasted with the lack of effect of enalapril. These data suggest another mechanism of febuxostat's action mediated via inhibition of renal Akt activation. Disparate effects on Smad3 and Akt activation represent the major difference between the actions of febuxostat and enalapril detected in this study and may help explain additive effects of both agents in the diabetic kidney.
Several caveats of this study should be pointed out. Quantitative analyses of protein/mRNA expression were performed in renal cortical homogenates and consequently do not provide renal cell‐ or compartment‐specific information. Moreover, beneficial effects of febuxostat on GS and proteinuria and possibly in renal endothelia combine molecular actions with a haemodynamic component (Sanchez‐Lozada et al., 2008d) and require appropriate study design involving measurements of glomerular haemodynamics.
In summary, treatment with febuxostat has long‐term nephroprotective effects in experimental type 2 DN. Moreover, febuxostat enhances the protective effects of RAS inhibitors. Multiple mechanisms might contribute to the beneficial actions of febuxostat in the diabetic kidney, including those related to a reduction in serum UA levels and attenuation of renal peroxynitrite formation. Moreover, febuxostat possesses antifibrotic effects in vitro independently of changes in extracellular UA levels and attributable to inhibition of profibrotic signalling via Akt. The findings in this study strongly support the rationale for a large clinical trial evaluating XOi in DN. New information in this field could be expected after the completion of the ongoing PERL trial (Maahs et al., 2013) in type 1 diabetic patients with nephropathy.
Author contributions
R.K. concieved the studies, planned the experiments, analysed the data, prepared the manuscript and performed image analyses. B.X. performed cell studies, rtPCR, western blotting, IHC and HPLC. T.T.O. was responsible for animal care and in vivo measurements as well as for selected western blot analyses and elisa. J.S. contributed selected western blot measurements and IHC and to data analysis preparation of the MS.
Conflict of interest
The authors declare no conflicts of interest.
Declaration of transparency and scientific rigour
This Declaration acknowledges that this paper adheres to the principles for transparent reporting and scientific rigour of preclinical research recommended by funding agencies, publishers and other organisations engaged with supporting research.
Supporting information
Figure S1 Effect of FBX, ENL and their combination on SBP. a P < 0.05 versus ZL‐VE; b P < 0.05 versus ZO‐VE; c P < 0.05 versus ZO‐FBX and/or ZO‐FBXlate; dp < 0.05 versus ZO‐ENL.
Supporting info item
Supporting info item
Acknowledgements
Parts of this work were presented at the Renal Week of the American Society of Nephrology in 2013. This work was sponsored by grant CCR‐FEB‐001 (R.K.) from Takeda Pharmaceuticals International, Inc., Deerfield, IL, USA.
Komers, R. , Xu, B. , Schneider, J. , and Oyama, T. T. (2016) Effects of xanthine oxidase inhibition with febuxostat on the development of nephropathy in experimental type 2 diabetes. British Journal of Pharmacology, 173: 2573–2588. doi: 10.1111/bph.13527.
References
- Alexander SP, Kelly E, Marrion N, Peters JA, Benson HE, Faccenda E et al. (2015a). The Concise Guide to PHARMACOLOGY 2015/16: overview. Br J Pharmacol 172: 5729–5743. [DOI] [PMC free article] [PubMed] [Google Scholar]
- Alexander SPH, Fabbro D, Kelly E, Marrion N, Peters JA, Benson HE et al. (2015b). The Concise Guide to PHARMACOLOGY 2015/16: Enzymes. Br J Pharmacol 172: 6024–6109. [DOI] [PMC free article] [PubMed] [Google Scholar]
- Anderson S, Chapman JG, Oyama TT, Komers R (2010). Effect of orchiectomy on renal function in control and diabetic rats with chronic inhibition of nitric oxide. Clin Exp Pharmacol Physiol 37: 19–23. [DOI] [PubMed] [Google Scholar]
- Arcuri C, Bianchi R, Brozzi F, Donato R (2005). S100B increases proliferation in PC12 neuronal cells and reduces their responsiveness to nerve growth factor via Akt activation. J Biol Chem 280: 4402–4414. [DOI] [PubMed] [Google Scholar]
- Bagi Z, Ungvari Z, Koller A (2002). Xanthine oxidase‐derived reactive oxygen species convert flow‐induced arteriolar dilation to constriction in hyperhomocysteinemia: possible role of peroxynitrite. Arterioscler Thromb Vasc Biol 22: 28–33. [DOI] [PubMed] [Google Scholar]
- Bose B, Badve SV, Hiremath SS, Boudville N, Brown FG, Cass A et al. (2014). Effects of uric acid‐lowering therapy on renal outcomes: a systematic review and meta‐analysis. Nephrol Dial Transplant 29: 406–413. [DOI] [PubMed] [Google Scholar]
- Chander PN, Gealekman O, Brodsky SV, Elitok S, Tojo A, Crabtree M et al. (2004). Nephropathy in Zucker diabetic fat rat is associated with oxidative and nitrosative stress: prevention by chronic therapy with a peroxynitrite scavenger ebselen. J Am Soc Nephrol 15: 2391–2403. [DOI] [PubMed] [Google Scholar]
- Cirillo P, Sato W, Reungjui S, Heinig M, Gersch M, Sautin Y et al. (2006). Uric acid, the metabolic syndrome, and renal disease. J Am Soc Nephrol 17: S165–S168. [DOI] [PubMed] [Google Scholar]
- Coimbra TM, Janssen U, Grone HJ, Ostendorf T, Kunter U, Schmidt H et al. (2000). Early events leading to renal injury in obese Zucker (fatty) rats with type II diabetes. Kidney Int 57: 167–182. [DOI] [PubMed] [Google Scholar]
- Cooper N, Khosravan R, Erdmann C, Fiene J, Lee JW (2006). Quantification of uric acid, xanthine and hypoxanthine in human serum by HPLC for pharmacodynamic studies. J Chromatogr B Analyt Technol Biomed Life Sci 837: 1–10. [DOI] [PubMed] [Google Scholar]
- Corry DB, Eslami P, Yamamoto K, Nyby MD, Makino H, Tuck ML (2008). Uric acid stimulates vascular smooth muscle cell proliferation and oxidative stress via the vascular renin–angiotensin system. J Hypertens 26: 269–275. [DOI] [PubMed] [Google Scholar]
- Curtis MJ, Bond RA, Spina D, Ahluwalia A, Alexander SP, Giembycz MA et al. (2015). Experimental design and analysis and their reporting: new guidance for publication in BJP. Br J Pharmacol 172: 3461–3471. [DOI] [PMC free article] [PubMed] [Google Scholar]
- DeRubertis FR, Craven PA, Melhem MF, Salah EM (2004). Attenuation of renal injury in db/db mice overexpressing superoxide dismutase: evidence for reduced superoxide–nitric oxide interaction. Diabetes 53: 762–768. [DOI] [PubMed] [Google Scholar]
- Diamond JR, Anderson S (1990). Irreversible tubulointerstitial damage associated with chronic aminonucleoside nephrosis. Amelioration by angiotensin I converting enzyme inhibition. Am J Pathol 137: 1323–1332. [PMC free article] [PubMed] [Google Scholar]
- Feliers D, Duraisamy S, Faulkner JL, Duch J, Lee AV, Abboud HE et al. (2001). Activation of renal signaling pathways in db/db mice with type 2 diabetes. Kidney Int 60: 495–504. [DOI] [PubMed] [Google Scholar]
- Ferraro B, Galli F, Frei B, Kingdon E, Canestrari F, Rice‐Evans C et al. (2003). Peroxynitrite‐induced oxidation of plasma lipids is enhanced in stable hemodialysis patients. Kidney Int 63: 2207–2213. [DOI] [PubMed] [Google Scholar]
- Ficociello LH, Rosolowsky ET, Niewczas MA, Maselli NJ, Weinberg JM, Aschengrau A et al. (2010). High‐normal serum uric acid increases risk of early declining renal function in type 1 diabetes: results of 6‐year follow‐up. Diabetes Care 33: 1337–1343. [DOI] [PMC free article] [PubMed] [Google Scholar]
- Figarola JL, Loera S, Weng Y, Shanmugam N, Natarajan R, Rahbar S (2008). LR‐90 prevents dyslipidaemia and diabetic nephropathy in the Zucker diabetic fatty rat. Diabetologia 51: 882–891. [DOI] [PubMed] [Google Scholar]
- Gao X, Zhang H, Belmadani S, Wu J, Xu X, Elford H et al. (2008). Role of TNF‐alpha‐induced reactive oxygen species in endothelial dysfunction during reperfusion injury. Am J Physiol Heart Circ Physiol 295: H2242–H2249. [DOI] [PMC free article] [PubMed] [Google Scholar]
- Gersch C, Palii SP, Kim KM, Angerhofer A, Johnson RJ, Henderson GN (2008). Inactivation of nitric oxide by uric acid. Nucleosides Nucleotides Nucleic Acids 27: 967–978. [DOI] [PMC free article] [PubMed] [Google Scholar]
- Goicoechea M, de Vinuesa SG, Verdalles U, Ruiz‐Caro C, Ampuero J, Rincon A et al. (2010). Effect of allopurinol in chronic kidney disease progression and cardiovascular risk. Clin J Am Soc Nephrol 5: 1388–1393. [DOI] [PMC free article] [PubMed] [Google Scholar]
- Hovind P, Rossing P, Tarnow L, Johnson RJ, Parving HH (2009). Serum uric acid as a predictor for development of diabetic nephropathy in type 1 diabetes: an inception cohort study. Diabetes 58: 1668–1671. [DOI] [PMC free article] [PubMed] [Google Scholar]
- Hu QH, Wang C, Li JM, Zhang DM, Kong LD (2009). Allopurinol, rutin, and quercetin attenuate hyperuricemia and renal dysfunction in rats induced by fructose intake: renal organic ion transporter involvement. Am J Physiol Renal Physiol 297: F1080–F1091. [DOI] [PubMed] [Google Scholar]
- Hu QH, Zhang X, Pan Y, Li YC, Kong LD (2012). Allopurinol, quercetin and rutin ameliorate renal NLRP3 inflammasome activation and lipid accumulation in fructose‐fed rats. Biochem Pharmacol 84: 113–125. [DOI] [PubMed] [Google Scholar]
- Ionescu E, Sauter JF, Jeanrenaud B (1985). Abnormal oral glucose tolerance in genetically obese (fa/fa) rats. Am J Physiol 248: E500–E506. [DOI] [PubMed] [Google Scholar]
- Jalal DI, Rivard CJ, Johnson RJ, Maahs DM, McFann K, Rewers M et al. (2010). Serum uric acid levels predict the development of albuminuria over 6 years in patients with type 1 diabetes: findings from the Coronary Artery Calcification in Type 1 Diabetes study. Nephrol Dial Transplant 25: 1865–1869. [DOI] [PMC free article] [PubMed] [Google Scholar]
- Johnson RJ, Nakagawa T, Sanchez‐Lozada LG, Shafiu M, Sundaram S, Le M et al. (2013a). Sugar, uric acid, and the etiology of diabetes and obesity. Diabetes 62: 3307–3315. [DOI] [PMC free article] [PubMed] [Google Scholar]
- Johnson RJ, Sanchez‐Lozada LG, Mazzali M, Feig DI, Kanbay M, Sautin YY (2013b). What are the key arguments against uric acid as a true risk factor for hypertension? Hypertension 61: 948–951. [DOI] [PubMed] [Google Scholar]
- Kalluri R (2009). EMT: when epithelial cells decide to become mesenchymal‐like cells. J Clin Invest 119: 1417–1419. [DOI] [PMC free article] [PubMed] [Google Scholar]
- Kang DH, Nakagawa T, Feng L, Watanabe S, Han L, Mazzali M et al. (2002). A role for uric acid in the progression of renal disease. J Am Soc Nephrol 13: 2888–2897. [DOI] [PubMed] [Google Scholar]
- Kasiske BL, Cleary MP, O'Donnell MP, Keane WF (1985). Effects of genetic obesity on renal structure and function in the Zucker rat. J Lab Clin Med 106: 598–604. [PubMed] [Google Scholar]
- Kasiske BL, O'Donnell MP, Keane WF (1992). The Zucker rat model of obesity, insulin resistance, hyperlipidemia, and renal injury. Hypertension 19: I110–I115. [DOI] [PubMed] [Google Scholar]
- Khadour FH, Panas D, Ferdinandy P, Schulze C, Csont T, Lalu MM et al. (2002). Enhanced NO and superoxide generation in dysfunctional hearts from endotoxemic rats. Am J Physiol Heart Circ Physiol 283: H1108–H1115. [DOI] [PubMed] [Google Scholar]
- Kilkenny C, Browne W, Cuthill IC, Emerson M, Altman DG (2010). Animal research: reporting in vivo experiments: the ARRIVE guidelines. Br J Pharmacol 160: 1577–1579. [DOI] [PMC free article] [PubMed] [Google Scholar]
- Komers R, Mar D, Denisenko O, Xu B, Oyama TT, Bomsztyk K (2013). Epigenetic changes in renal genes dysregulated in mouse and rat models of type 1 diabetes. Lab Invest 93: 543–552. [DOI] [PubMed] [Google Scholar]
- Komers R, Oyama TT, Beard DR, Tikellis C, Xu B, Lotspeich DF et al. (2011). Rho kinase inhibition protects kidneys from diabetic nephropathy without reducing blood pressure. Kidney Int 79: 432–442. [DOI] [PubMed] [Google Scholar]
- Komers R, Schutzer WE, Reed JF, Lindsley JN, Oyama TT, Buck DC et al. (2006). Altered endothelial nitric oxide synthase targeting and conformation and caveolin‐1 expression in the diabetic kidney. Diabetes 55: 1651–1659. [DOI] [PubMed] [Google Scholar]
- Kosugi T, Nakayama T, Heinig M, Zhang L, Yuzawa Y, Sanchez‐Lozada LG et al. (2009). Effect of lowering uric acid on renal disease in the type 2 diabetic db/db mice. Am J Physiol Renal Physiol 297: F481–F488. [DOI] [PMC free article] [PubMed] [Google Scholar]
- Lan A, Du J (2014). Potential role of Akt signaling in chronic kidney disease. Nephrol Dial Transplant 30: 385–394. [DOI] [PubMed] [Google Scholar]
- Leclerc E, Fritz G, Weibel M, Heizmann CW, Galichet A (2007). S100B and S100A6 differentially modulate cell survival by interacting with distinct RAGE (receptor for advanced glycation end products) immunoglobulin domains. J Biol Chem 282: 31317–31331. [DOI] [PubMed] [Google Scholar]
- Maahs DM, Caramori L, Cherney DZ, Galecki AT, Gao C, Jalal D et al. (2013). Uric acid lowering to prevent kidney function loss in diabetes: the preventing early renal function loss (PERL) allopurinol study. Curr Diab Rep 13: 550–559. [DOI] [PMC free article] [PubMed] [Google Scholar]
- Malik UZ, Hundley NJ, Romero G, Radi R, Freeman BA, Tarpey MM et al. (2011). Febuxostat inhibition of endothelial‐bound XO: implications for targeting vascular ROS production. Free Radic Biol Med 51: 179–184. [DOI] [PMC free article] [PubMed] [Google Scholar]
- Mariappan MM, Feliers D, Mummidi S, Choudhury GG, Kasinath BS (2007). High glucose, high insulin, and their combination rapidly induce laminin‐beta1 synthesis by regulation of mRNA translation in renal epithelial cells. Diabetes 56: 476–485. [DOI] [PubMed] [Google Scholar]
- Mazzali M, Kanellis J, Han L, Feng L, Xia YY, Chen Q et al. (2002). Hyperuricemia induces a primary renal arteriolopathy in rats by a blood pressure‐independent mechanism. Am J Physiol Renal Physiol 282: F991–F997. [DOI] [PubMed] [Google Scholar]
- McGrath JC, Lilley E (2015). Implementing guidelines on reporting research using animals (ARRIVE etc.): new requirements for publication in BJP. Br J Pharmacol 172: 3189–3193. [DOI] [PMC free article] [PubMed] [Google Scholar]
- Morrow JD, Frei B, Longmire AW, Gaziano JM, Lynch SM, Shyr Y et al. (1995). Increase in circulating products of lipid peroxidation (F2‐isoprostanes) in smokers. Smoking as a cause of oxidative damage. N Engl J Med 332: 1198–1203. [DOI] [PubMed] [Google Scholar]
- Omori H, Kawada N, Inoue K, Ueda Y, Yamamoto R, Matsui I et al. (2012). Use of xanthine oxidase inhibitor febuxostat inhibits renal interstitial inflammation and fibrosis in unilateral ureteral obstructive nephropathy. Clin Exp Nephrol 16: 549–556. [DOI] [PubMed] [Google Scholar]
- Onozato ML, Tojo A, Goto A, Fujita T, Wilcox CS (2002). Oxidative stress and nitric oxide synthase in rat diabetic nephropathy: Effects of ACEI and ARB. Kidney Int 61: 186–194. [DOI] [PubMed] [Google Scholar]
- Park JT, Kato M, Yuan H, Castro N, Lanting L, Wang M et al. (2013). FOG2 protein down‐regulation by transforming growth factor‐beta1‐induced microRNA‐200b/c leads to Akt kinase activation and glomerular mesangial hypertrophy related to diabetic nephropathy. J Biol Chem 288: 22469–22480. [DOI] [PMC free article] [PubMed] [Google Scholar]
- Phillips MS, Liu Q, Hammond HA, Dugan V, Hey PJ, Caskey CJ et al. (1996). Leptin receptor missense mutation in the fatty Zucker rat. Nat Genet 13: 18–19. [DOI] [PubMed] [Google Scholar]
- Raij L, Azar S, Keane W (1984). Mesangial immune injury, hypertension, and progressive glomerular damage in Dahl rats. Kidney Int 26: 137–143. [DOI] [PubMed] [Google Scholar]
- Ren S, Duffield JS (2013). Pericytes in kidney fibrosis. Curr Opin Nephrol Hypertens 22: 471–480. [DOI] [PubMed] [Google Scholar]
- Ryu ES, Kim MJ, Shin HS, Jang YH, Choi HS, Jo I et al. (2013). Uric acid‐induced phenotypic transition of renal tubular cells as a novel mechanism of chronic kidney disease. Am J Physiol Renal Physiol 304: F471–F480. [DOI] [PubMed] [Google Scholar]
- Sanchez‐Lozada LG, Soto V, Tapia E, Avila‐Casado C, Sautin YY, Nakagawa T et al. (2008a). Role of oxidative stress in the renal abnormalities induced by experimental hyperuricemia. Am J Physiol Renal Physiol 295: F1134–F1141. [DOI] [PMC free article] [PubMed] [Google Scholar]
- Sanchez‐Lozada LG, Tapia E, Bautista‐Garcia P, Soto V, Avila‐Casado C, Vega‐Campos IP et al. (2008b). Effects of febuxostat on metabolic and renal alterations in rats with fructose‐induced metabolic syndrome. Am J Physiol Renal Physiol 294: F710–F718. [DOI] [PubMed] [Google Scholar]
- Sanchez‐Lozada LG, Tapia E, Soto V, Avila‐Casado C, Franco M, Wessale JL et al. (2008c). Effect of febuxostat on the progression of renal disease in 5/6 nephrectomy rats with and without hyperuricemia. Nephron Physiol 108: 69–78. [DOI] [PubMed] [Google Scholar]
- Sanchez‐Lozada LG, Tapia E, Soto V, Avila‐Casado C, Franco M, Zhao L et al. (2008d). Treatment with the xanthine oxidase inhibitor febuxostat lowers uric acid and alleviates systemic and glomerular hypertension in experimental hyperuricaemia. Nephrol Dial Transplant 23: 1179–1185. [DOI] [PubMed] [Google Scholar]
- Siu YP, Leung KT, Tong MK, Kwan TH (2006). Use of allopurinol in slowing the progression of renal disease through its ability to lower serum uric acid level. Am J Kidney Dis 47: 51–59. [DOI] [PubMed] [Google Scholar]
- Southan C, Sharman JL, Benson HE, Faccenda E, Pawson AJ, Alexander SP et al. (2016). The IUPHAR/BPS Guide to PHARMACOLOGY in 2016: towards curated quantitative interactions between 1300 protein targets and 6000 ligands. Nucl Acids Res 44: D1054–D1068. [DOI] [PMC free article] [PubMed] [Google Scholar]
- Takano Y, Hase‐Aoki K, Horiuchi H, Zhao L, Kasahara Y, Kondo S et al. (2005). Selectivity of febuxostat, a novel non‐purine inhibitor of xanthine oxidase/xanthine dehydrogenase. Life Sci 76: 1835–1847. [DOI] [PubMed] [Google Scholar]
- Tausche AK, Christoph M, Forkmann M, Richter U, Kopprasch S, Bielitz C et al. (2014). As compared to allopurinol, urate‐lowering therapy with febuxostat has superior effects on oxidative stress and pulse wave velocity in patients with severe chronic tophaceous gout. Rheumatol Int 34: 101–109. [DOI] [PubMed] [Google Scholar]
- White CR, Brock TA, Chang LY, Crapo J, Briscoe P, Ku D et al. (1994). Superoxide and peroxynitrite in atherosclerosis. Proc Natl Acad Sci U S A 91: 1044–1048. [DOI] [PMC free article] [PubMed] [Google Scholar]
- Xia Y, Zweier JL (1997). Superoxide and peroxynitrite generation from inducible nitric oxide synthase in macrophages. Proc Natl Acad Sci U S A 94: 6954–6958. [DOI] [PMC free article] [PubMed] [Google Scholar]
- Yagi K (1998). Simple assay for the level of total lipid peroxides in serum or plasma. Methods Mol Biol 108: 101–106. [DOI] [PubMed] [Google Scholar]
- Yang Z, Xiaohua W, Lei J, Ruoyun T, Mingxia X, Weichun H et al. (2010). Uric acid increases fibronectin synthesis through upregulation of lysyl oxidase expression in rat renal tubular epithelial cells. Am J Physiol Renal Physiol 299: F336–F346. [DOI] [PubMed] [Google Scholar]
- Zdychova J, Kazdova L, Pelikanova T, Lindsley JN, Anderson S, Komers R (2008). Renal activity of Akt kinase in obese Zucker rats. Exp Biol Med (Maywood) 233: 1231–1241. [DOI] [PubMed] [Google Scholar]
- Zdychova J, Komers R (2005). Emerging role of Akt kinase/protein kinase B signaling in pathophysiology of diabetes and its complications. Physiol Res 54: 1–16. [DOI] [PubMed] [Google Scholar]
- Zoppini G, Targher G, Chonchol M, Ortalda V, Abaterusso C, Pichiri I et al. (2012). Serum uric acid levels and incident chronic kidney disease in patients with type 2 diabetes and preserved kidney function. Diabetes Care 35: 99–104. [DOI] [PMC free article] [PubMed] [Google Scholar]
- Zweier JL, Broderick R, Kuppusamy P, Thompson‐Gorman S, Lutty GA (1994). Determination of the mechanism of free radical generation in human aortic endothelial cells exposed to anoxia and reoxygenation. J Biol Chem 269: 24156–24162. [PubMed] [Google Scholar]
Associated Data
This section collects any data citations, data availability statements, or supplementary materials included in this article.
Supplementary Materials
Figure S1 Effect of FBX, ENL and their combination on SBP. a P < 0.05 versus ZL‐VE; b P < 0.05 versus ZO‐VE; c P < 0.05 versus ZO‐FBX and/or ZO‐FBXlate; dp < 0.05 versus ZO‐ENL.
Supporting info item
Supporting info item