Significance
The default mode network (DMN) has been suggested to support a variety of internal-state functions in human. Because preclinical models can be used in translational studies of neuropsychiatric disorders, investigations of the DMN in these models may aid the understanding of both physiology and pathophysiology of the human DMN. To our knowledge, this is the first study to investigate the constituents and functional implications of the rat DMN. We provide empirical evidence that the rat DMN is composed of highly connected anatomical and functional subnetworks, which show differential modulation in association with age-related cognitive dysfunction. These findings provide a framework to further explore the physiological basis and behavioral significance of the rodent DMN.
Keywords: default mode network, functional connectivity, modularity, rat brain, aging
Abstract
The default mode network (DMN) has been suggested to support a variety of self-referential functions in humans and has been fractionated into subsystems based on distinct responses to cognitive tasks and functional connectivity architecture. Such subsystems are thought to reflect functional hierarchy and segregation within the network. Because preclinical models can inform translational studies of neuropsychiatric disorders, partitioning of the DMN in nonhuman species, which has previously not been reported, may inform both physiology and pathophysiology of the human DMN. In this study, we sought to identify constituents of the rat DMN using resting-state functional MRI (rs-fMRI) and diffusion tensor imaging. After identifying DMN using a group-level independent-component analysis on the rs-fMRI data, modularity analyses fractionated the DMN into an anterior and a posterior subsystem, which were further segregated into five modules. Diffusion tensor imaging tractography demonstrates a close relationship between fiber density and the functional connectivity between DMN regions, and provides anatomical evidence to support the detected DMN subsystems. Finally, distinct modulation was seen within and between these DMN subcomponents using a neurocognitive aging model. Taken together, these results suggest that, like the human DMN, the rat DMN can be partitioned into several subcomponents that may support distinct functions. These data encourage further investigation into the neurobiological mechanisms of DMN processing in preclinical models of both normal and disease states.
The default mode network (DMN) of the brain, first demonstrated in humans (1) and then in nonhuman primates (2) and rodents (3–5), contains a set of distributed brain regions that are approximately analogous across the species. Anatomically, the human DMN includes medial prefrontal cortex (mPFC), anterior cingulate cortex (ACC), posterior cingulate cortex (PCC) and precuneus, bilateral inferior parietal cortex, temporal cortex, and hippocampus (HIPP) (6, 7). The human DMN is thought to support a variety of self-referential functions, including recollection and imagination, conceptual processing, and autobiographical memory (6, 8, 9). A reduction of DMN’s activity (or deactivation) has been conceptualized as the suppression of brain activity responsible for processing introspective thinking and planning. In so doing, it supports the processing of events external to the individual, including such executive functions as working memory (10). Compared with healthy individuals, various neurological and psychiatric disorders including schizophrenia (11), Alzheimer’s disease (12), autism (13), and addiction (14, 15) have been linked to DMN dysregulation.
Based on distinct responses to various cognitive tasks and functional connectivity architecture, the human DMN has been fractionated using both graph theory (16) and independent-component analysis (ICA) methods (17) into a set of midline common core regions (covering mPFC/ACC and PCC) and two subsystems, a medial temporal lobe (MTL) subsystem and a dorsal mPFC (dmPFC) subsystem. The midline core regions interact with both subsystems and have been suggested to support processes involving self-reference, affective decision, and autobiographic information (16, 18, 19), whereas the MTL and dmPFC subsystems appear functionally distinct. The amygdala and HIPP in the MTL subsystem are associated with emotional processes and memory (16, 19, 20), whereas the ventral mPFC (vmPFC) and ACC components are involved in motivation, reward, and cognitive modulation of affect (19). In the dmPFC subsystem, the temporoparietal junction and anterior middle temporal sulcus are associated with language and social cognition (19). Cumulative evidence has suggested that such DMN parcellation might reflect functional hierarchy and segregation within the network (16, 19–21).
The majority of studies on DMN’s structure and function have been conducted in humans, whereas the DMN architecture in preclinical models is much less known. Because rodents have been widely used as preclinical models of various neuropsychiatric diseases, a thorough understanding of the rodent DMN and its relevant functions would be of particular importance for both interpreting rodent resting-state functional MRI (rs-fMRI) data and translating findings between animal models and humans.
In this study, we examined the architecture of rat DMN using modularity analysis of rs-fMRI data and associated this with the underlying structural connectivity obtained with diffusion tensor imaging (DTI) tractography. To identify the possible functional significance of the parcellated DMN components, we used an experimental manipulation in a separate group of rats, a model of age-related memory impairment.
Results
Subnetworks of DMN Revealed by Modularity Analysis.
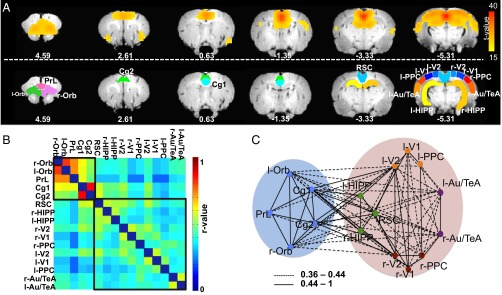
Using group-level ICA (gICA), we first identified the putative DMN (Fig. 1A) based on its spatial distribution consistent with that previously described (3). This ICA component includes the orbital cortex (Orb), prelimbic cortex (PrL), cingulate cortex (Cg1 and Cg2), retrosplenial cortex (RSC), HIPP, auditory/temporal association cortex (Au/TeA), posterior parietal cortex (PPC), and primary/secondary visual cortex (V1/V2). We then manually defined 16 anatomical regions of interests (ROIs) (Fig. 1A) within the DMN from a rat stereotaxic atlas (22), which were then used as nodes to construct resting-state functional connectivity (rsFC) matrices. After averaging matrices across animals, the group-level DMN was thresholded at two connection densities (83% and 20%) (see SI Methods for details) and separately subjected to modularity analysis. At the 83% density, when the DMN is densely connected, modularity analysis identified an anterior and a posterior subnetwork (Fig. 1B). The anterior subnetwork included the Cg1, Cg2, PrL, and Orb, whereas the posterior subnetwork included RSC, HIPP (CA1), V1, V2, PPC, and Au/TeA. At a 20% density where the DMN became loosely connected, it was partitioned into five modules (Fig. 1C). Although the anterior subnetwork remained unchanged, the posterior subnetwork split into four modules: RSC-HIPP including RSC and bilateral CA1; left PPC-visual including left V1, V2, and PPC; right PPC-visual including right V1, V2, and PPC; and Au/TeA including bilateral Au/TeA.
Fig. 1.
(A, Upper) Components of the DMN identified from gICA. (Lower) Anatomical definitions of ROIs manually drawn within the putative DMN: auditory/temporal association cortex (Au/TeA), cingulate cortex (Cg), hippocampus formation (HIPP), orbital cortex (Orb), posterior parietal cortex (PPC), prelimbic cortex (PrL), retrosplenial cortex (RSC), association visual cortex (V1 and V2). Distance from bregma (in millimeters) is labeled below each slice. Overlapping regions between the ICA-driven DMN mask (Upper) and anatomical ROIs (Lower) were set as nodes in the modularity analyses. (B) Resting-state functional connectivity matrix from 16 DMN nodes. Black squares outline two subnetworks based upon modularity analysis thresholded at 83% connection density, which includes an anterior and a posterior subnetwork. (C) Five modules were detected from modularity analysis at 20% connection density, including the frontal module (blue dots), the RSC-HIPP module (green dots), the right and left PPC-visual module (dark red and orange dots), and the Au/TeA module (purple dots). The blue and pink filled circles show the anterior and posterior subnetworks, respectively.
Functional and Structural Connectivity Between DMN Modules.
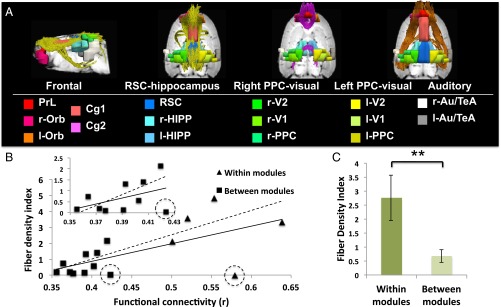
The tractography results revealed three main interconnecting tracts in the DMN (Fig. 2A): (i) the cingulum connecting the anterior, RSC-HIPP, and left and right PPC-visual modules; (ii) a left and right superior frontal-parietal fasciculus connecting all five modules; and (iii) body and splenium of the corpus callosum interconnecting, respectively, the left and right frontal cortex in the anterior module and the left and right PPC-visual modules. Furthermore, averaged rsFC within and between the five DMN modules correlated significantly with their fiber density index (r = 0.64, P < 0.05) (Fig. 2B), suggesting a strong association between structural and functional connectivity. Two mismatches between low fiber connectivity strength but high functional connectivity were found between left and right PPC-visual modules and within the Au/TeA module, which likely resulted from difficulties in tracing crossing fibers from the diffusion images (23, 24). The correlation between structural and functional connectivity across all modules was significantly enhanced (r = 0.87, P < 0.001) after excluding these outliers. When looking at the between-module connectivity only, structural and functional connectivity showed similar correlation as well (r = 0.44, P = 0.1), which became significant after dropping the “outlier,” that is, the pair of left and right PPC-visual modules (r = 0.73, P < 0.05). Furthermore, in individual rats, positive correlations between functional and structural connectivity among DMN components were also found (mean ± SD, r = 0.34 ± 0.22) especially after dropping the outlier (mean ± SD, r = 0.47 ± 0.20). Finally, the structural connectivity exhibited significantly higher within-module connectivity than between-module connectivity (Fig. 2C).
Fig. 2.
(A) Mean DTI-based tractography results across rats. Three major fiber tracks, including the frontoparietal fasciculus (orange fiber), the corpus callosum (purple fiber), and the cingulate tract (yellow fiber) were identified that connect the regions within and between the five identified DMN modules. Regional definitions are as in Fig. 1. (B) Correlation between functional connectivity and fiber bundle strength within and between DMN modules (solid line, r = 0.64, P < 0.05). The triangles represent the connections within modules and squares indicate the connections between modules. The circled data points denote two outliers that show low fiber connections but high functional connectivity, one between the left and right PPC-visual module (square with dotted circle) and the other within the Au/TeA module (triangle with dotted circle). After excluding these two outliers, correlations between structural and functional connectivity increased (dotted line, r = 0.87, P < 0.001). (Inset) Expanded the scale of the structural and functional connectivity between modules, which correlate moderately (solid line, r = 0.44, P = 0.1) and significantly after removing the outlier point (dotted line, r = 0.73, P < 0.05). (C) The mean fiber density index within modules are significantly higher than those between modules (**P < 0.01).
Aging-Related Cognitive Dysfunction Modulates Functional Connectivity Between DMN Subnetworks.
Spatial learning in the Morris water maze provides a framework for evaluating the functional significance of age-related disruptions in spontaneous interactions within the DMN. A group of young adult (6–7 mo) and a group of aged (24–25 mo) male rats were tested on a standardized spatial version of the Morris water maze task. Aged rats were subsequently subdivided into two groups based on their performance on the task [a learning index (LI) was calculated for each animal as the weighted average proximity to the escape location (in centimeters) during several probe trials interleaved throughout the 8-day protocol; a low LI indicates searching near the platform position and better memory]. Aged animals with comparable LI performance as young (Y) rats were classified as aged-unimpaired (AU) (LI range = 165–230, mean ± SEM = 205 ± 5.31, n = 10), whereas the aged-impaired (AI) group exhibited higher LI scores than either the Y or the AU animals (AI, LI range = 251–330, mean ± SEM = 277 ± 7.01, n = 11).
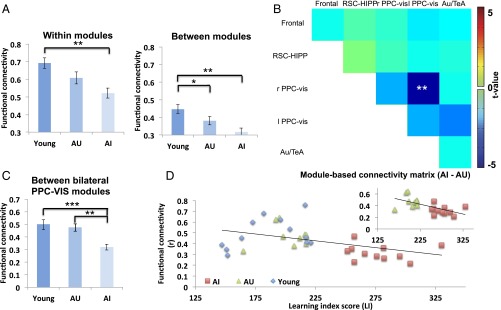
The Y group exhibited significantly greater average functional connectivity compared with the AI group within modules as well as compared with both the AU and AI groups between modules (Fig. 3A). In contrast, no significant changes were found in the average functional connectivity within/between DMN modules when comparing AI to AU rats (Fig. 3A), although a trend of lower functional connectivity in AI rats was observed. Nevertheless, cognitive dysfunction-related changes in DMN connectivity were found between the bilateral PPC-visual subnetworks, which were significantly reduced in the AI compared with the AU (Fig. 3B) and the Y groups (Fig. 3C). Furthermore, the functional connectivity between left and right PPC-visual modules correlated significantly with LI score (Fig. 3D) across Y, AU, and AI rats (r = 0.44, P < 0.05), and correlated even more strongly across aged animals (r = 0.62, P < 0.005).
Fig. 3.
(A) The averaged functional connectivity within the five DMN modules was significantly less in the aged-impaired (AI) compared with the young (Y) group. The averaged functional connectivity between the five DMN modules was significantly less in the AI and AU groups compared with the Y group (one-way ANOVA, F test = 8.19, P < 0.005). (B) The functional connectivity between left and right PPC-visual modules was significantly reduced between the AI and the AU rats. (C) The connectivity between left and right PPC-visual modules was significant reduced in the AI compared with the AU and Y groups (one-way ANOVA, F test = 10.5, P < 0.005). (D) The functional connectivity between left and right PPC-visual modules was significantly negatively correlated with LI score across Y, AU, and AI rats (r = 0.44, P < 0.05). (Inset) After excluding young rats, the correlations increased across AU and AI rats (r = 0.62, P < 0.005). *P < 0.05, **P < 0.01, ***P < 0.001, corrected.
Reproducibility of DMN Subnetworks.
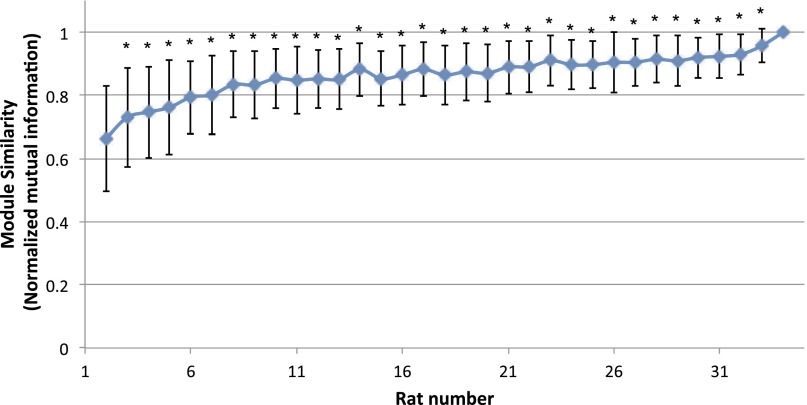
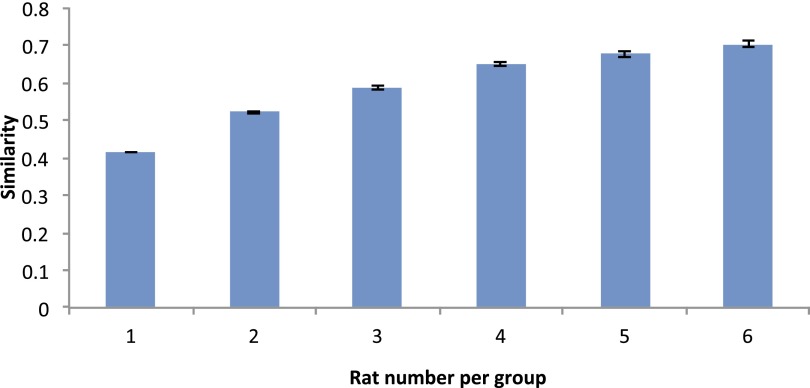
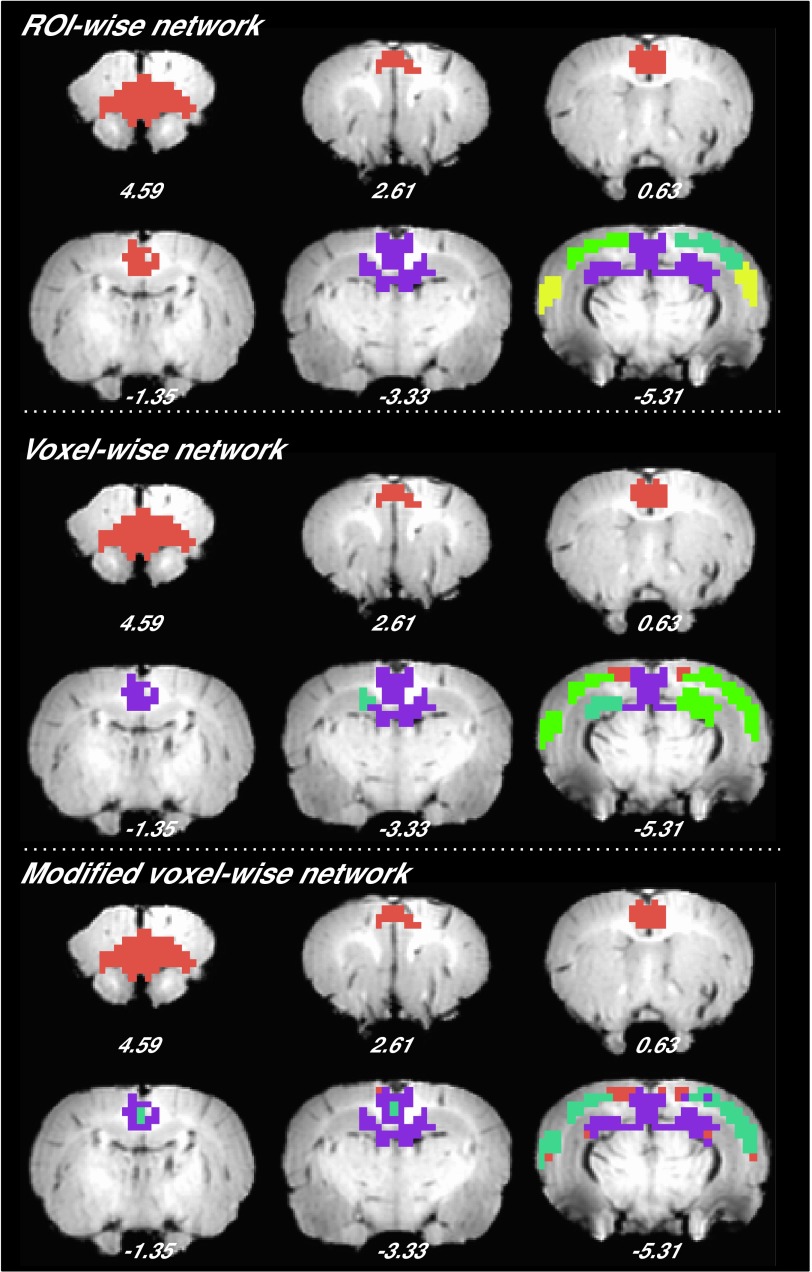
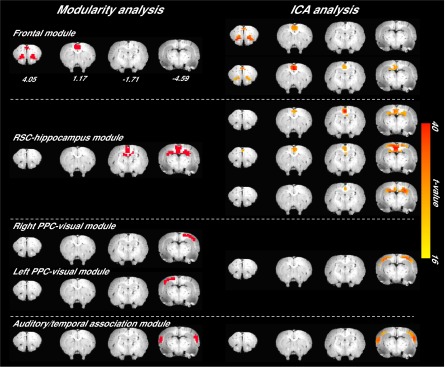
Finally, we performed four validation analyses to evaluate the reproducibility of the subnetwork structure of the DMN. First, we reran the modular analysis on DMN networks generated from a randomly selected subgroup of rats, consisting of 2–33 rats from the original cohort (each random selection was repeated 100 times). Normalized mutual information (NMI), which measures similarity between two sets of partitions (25), was greater than 0.7 (P < 0.05 against randomized distribution) between the resultant DMN subnetwork patterns and the one we obtained in the main analyses above (Fig. S1). We next performed the stability analysis on nonoverlapping subsets of the animals, with the number of rats in these subsets ranging from one through six. The similarity was 0.41 for one rat per set and monotonically increased to 0.67 for five rats per set (Fig. S2). These results indicate similar DMN modular structure across rats. Second, the entire modular analysis was repeated for the DMN networks using rs-fMRI scans from 11 rats acquired ∼2 wk and 3 mo after the original dataset was collected. Compared with the DMN partition obtained from the initial scan session, the similarity was high for DMN networks obtained at both 2 wk (0.93, P < 0.001 against randomized distribution) and 3 mo (0.73, P < 0.05 against randomized distribution) apart. The similarity of functional connectivity matrix was 0.96 at 2 wk and 0.95 at 3 mo. We further computed within-subject similarity scores for both DMN partitions and functional connectivity matrices from individual rats. The average similarity of modularity between two sets of partitions (25) was 0.37 ± 0.37 (mean ± SD) for the 2-wk separation and 0.30 ± 0.36 (mean ± SD) for the 3-mo separation. The similarity of functional connectivity matrix was 0.75 ± 0.10 (mean ± SD) for the 2-wk separation and 0.72 ± 0.12 (mean ± SD) for the 3-mo separation. These results indicate that a high stability across time exists in functional connectivity matrix at both single-subject and group levels, and in modularity at a group level, with a moderate number of subjects. The within-subject modularity stability might be improved by longer scanning (higher signal-to-noise ratio) and improved modularity algorithms (less random processes). Third, to assess whether the network size (number of nodes) of the DMN would impact the modular detection results, we constructed a voxelwise network of the DMN and found a similar modular structure as that obtained from our ROI-wise DMN (Fig. S3). Moreover, given that local connections may arise from shared nonphysiological signals from nearby voxels, we removed the short-distance connections (<1.3 mm) from the voxelwise DMN network. The resultant modified voxelwise DMN network exhibited a highly similar modular structure with the nonmodified voxelwise DMN (NMI = 0.6, P = 0.001) (Fig. S3). Finally, by using gICA as an alternative parcellation approach, we replicated a similar pattern of DMN subcomponents as those obtained from modularity analysis (Fig. S4).
Fig. S1.
The reproducibility of DMN subnetworks derived from different number of rats. Modular analysis was conducted on DMN networks generated from randomly selected subgroups consisting of 2–33 rats from the original cohort (each random selection was repeated 100 times). The normalized mutual information (NMI), which measures similarity between two sets of partitions, was computed between the resultant DMN subnetwork patterns and the one we obtained using the original 34 rats (*P < 0.05).
Fig. S2.
The reproducibility of DMN subnetworks derived from nonoverlapping subsets of rats. Modular analysis was conducted on DMN networks generated from randomly selected, nonoverlapping subsets consisting of one through six rats per subsets. The result showed that the mean similarity of these subsets ranged from 0.41 (one rat per set) monotonically to 0.67 (six rats per set).
Fig. S3.
The DMN parcellation from ROI-wise, voxelwise, and modified voxelwise network, in which the different colors indicate different modules.
Fig. S4.
The DMN subcomponents from modularity analysis (Left) and gICA (Right).
SI Methods
Animal Preparation.
For MRI scans, animals were anesthetized with a combination of isoflurane (Piramal Critical Care) and dexmedetomidine hydrochloride (Webster Veterinary Supply), in a protocol based on our previous study (3). For Sprague–Dawley (SD) rats, following a 0.03 mg/kg, subcutaneous, bolus injection, dexmedetomidine was continuously infused at 0.015 mg⋅kg−1⋅h−1 and isoflurane was gradually reduced from 2% to 0.5%. Rats were secured in an animal holder with a bite bar. In addition, for Long–Evans (LE) rats, following a 0.015 mg/kg, subcutaneous, bolus injection, dexmedetomidine was continuously infused at 0.01 mg⋅kg−1⋅h−1 and isoflurane was reduced from 2% to 0.5%. Core body temperature was maintained at 37 ± 0.5 °C with a water-circulating heating pump. Heart rate, respiration rate, and blood oxygenation levels were continuously monitored using a noninvasive pulse oximetry attached to the animal’s hindfoot (Starr Life Sciences). Spontaneous respiration rate typically ranged from 70 to 85 breaths per min at the time of resting-state data acquisition. Functional MRI (fMRI) data were collected at ∼90 min after the initiation of dexmedetomidine infusion, at which time the blood oxygen level-dependent (BOLD) signal was maximally stable (3).
Before imaging to explore cognitive dysfunction-induced modulation within the DMN, aged rats were trained on a standardized, 8-day Morris water maze (MWM) protocol to assess hippocampal spatial memory. The fMRI scanning session was conducted under twilight anesthesia ∼1 mo following behavioral testing.
MWM Task.
Hippocampal spatial learning and memory were assessed using a standardized version of the MWM described in ref. 58. Briefly, the protocol consisted of distributed training with a hidden escape platform maintained in a fixed location (three trials per day for 8 consecutive days), interspersed with probe trials (last trial every other day; four probe trials total). Spatial memory was assessed on the basis of a learning index (LI), calculated for each rat as its weighted average of proximity (in centimeters) to the hidden escape location across probe trials (58). This measure is optimized for documenting individual differences in memory, and aged animals were classified as either aged-unimpaired or aged-impaired for animals with scores greater than 250. The day after completing the spatial protocol, rats were tested on a one-session, hippocampus-independent cued version of the MWM. Only animals that performed normally were included in the imaging experiments.
Image Acquisition.
MRI data were acquired using a Bruker Biospin 9.4-T scanner (Bruker Medizintechnik) with a quadrature receiver coil and birdcage volume transmit coil. High-resolution anatomical images were acquired using a rapid acquisition with relaxation enhancement (RARE) sequence [repetition time (TR) = 2,500 ms; field-of-view (FOV) = 32 × 32 mm2; slice thickness = 1 mm; slice number = 23]. Diffusion tensor imaging (DTI) data were acquired using a diffusion-weighted echo-planar imaging (EPI) sequence (TR = 6,000 ms; 19 slices; b value = 0, 1,000, and 2,000 s/mm2; TE = 47 ms; matrix size = 96 × 96; FOV = 30 × 30 mm2; 30 directions; and two averages). Two resting-state fMRI (rs-fMRI) scans were acquired using a T2*-weighted EPI sequence (TE = 15 ms; TR = 1,000 ms; FOV = 30 × 30 mm2; matrix size = 64 × 64; slice thickness = 1 mm; slice number = 13; time points = 520). Animals were anesthetized with a combination of isoflurane and dexmedetomidine hydrochloride, previously documented to preserve BOLD coupling (3, 59).
For aged rats, high-resolution T2-weighted anatomical images were acquired first, using a RARE sequence (TR = 2,000 ms; TE = 50 ms; RARE factor = 8). Two rs-fMRI scans were acquired using a T2*-weighted EPI sequence (TE = 15 ms; TR = 1,000 ms; FOV = 35 × 35 mm2; matrix size = 64 × 64; slice thickness = 1 mm; slice number = 15; time points = 300).
Image Preprocessing.
fMRI image preprocessing.
fMRI data were preprocessed using AFNI (57). For resting and forepaw stimulation fMRI data, preprocessing steps included discarding the first 10 volumes, slice timing correction, motion correction, and spatial smoothing (full width at half-maximum, 0.6 mm). The fMRI images were aligned to their corresponding T2-weighted images, and then normalized to a common 3D space aligned with a rat stereotaxic atlas (3). To improve the accuracy of spatial normalization across rats, fMRI data from each rat were further aligned to the group-averaged fMRI images. Finally, the normalized images were linearly detrended and the six-parameters motion curves were regressed. For rs-fMRI data, each time series was bandpass filtered (0.01 < f < 0.5 Hz).
DTI image preprocessing and tractography.
DTI data preprocessing was performed using AFNI. After correcting for eddy current-induced distortions, the five B0 images were averaged and aligned to their corresponding T1 image, normalized to a stereotaxic atlas, and finally to the group-averaged B0 images. Concatenation of these transformation parameters was then applied to all DTI images for spatial normalization. DTI tractography was performed using a diffusion toolkit using the fiber assignment by continuous tracking (FACT) algorithm (60).Twenty-five seeds were started in each voxel. Fiber tracking was stopped when the fiber reached a voxel with a fractional anisotropy value lower than 0.15 or when the average angle of its eigenvector deviated more than 35° from the main diffusion direction of the neighboring voxels.
Image Analyses.
ICA network analysis.
All rs-fMRI data (two rs-fMRI scans in 34 SD rats) were used to generate brain network components using a group-level independent component analysis (gICA) (MELODIC; FSL). The number of components was set to 15, 20, and 30 and we chose to use the DMN map from the 15-components ICA because higher components number splits the DMN into smaller components. The spatial distributions of individual components were identified using dual regression (17), and one-sample t test was performed to generate the group component maps.
Anatomical ROIs within DMN.
We used gICA to decompose brain components and to identify the DMN in a manner similar to that in our previous report (3). We next manually defined 16 anatomical ROIs (Fig. 1A) within the DMN from a rat stereotaxic atlas (22). The overlapped regions from the anatomical ROIs and gICA-based DMN network were chosen as nodes for network analysis.
Modularity analysis.
To further identify subnetworks in the DMN, we used graph theory-based modularity analysis. For each SD rat, we extracted the time course from each of the 16 preselected nodes (Fig. 1B), and computed the Pearson correlation between every pair of the nodes to form a correlation matrix. Correlation coefficients were converted into Fisher’s z values before applying algebraic and statistical operations. This step resulted in a 16 × 16 matrix for each rat, where matrix elements represented the rsFC strength between pairs of nodes. Next, rsFC matrices were averaged across all rats to produce a mean rsFC matrix. Previous studies have shown that, with a sparser network (i.e., reduced connection density), modularity analysis may produce more refined modules, which yields a hierarchical modular structure across connection densities. Therefore, in the current study, we tried to explore the decomposition of the DMN at two extreme connection densities; one may give modular structure at the highest hierarchy when the DMN is densely connected, and the other may obtain partitions at the lowest hierarchy when the DMN is sparsely connected. The former connection density was set to 83.3% to keep only the significant correlations (P < 0.0001, Bonferroni corrected), whereas the latter connection density was determined as 20% to discard as many connections as possible while keeping that there are no isolated nodes in the DMN.
Modules refer to groups of nodes that are highly connected with each other but less connected with other nodes in a network. The modularity Q quantifies the efficacy of partitioning a network into modules by evaluating the difference between the actual number of intramodule connections and the expected number for the same modules in a randomized network (61). The objective of a modular detection procedure is to find a specific partition that maximizes the modularity Q. Newman's spectral algorithm (62) was used for modular detection. To examine whether the real network has significantly higher modularity than the random graphs, we randomized the original network with preserved strength distribution (63) 1,000 times and calculated the mean μ and SD σ of those modularity values. We compared the modularity Q of the real network to those values:
which measures how many SDs the real modularity is above the mean for the random graph.
Functional and structural connectivity within and between DMN modules.
For each rat, we computed the within-module connectivity by averaging functional correlations across all pairs of anatomical ROIs within each DMN module. We also computed the between-module connectivity by averaging functional correlations across anatomical ROIs between each pair of DMN modules.
To evaluate possible age-related influences on functional connectivity within and between DMN modules, we computed within- and between-module connectivity. The functional connectivity within and between DMN subnetworks were evaluated and compared with the LI in MWM task across aged rats.
Furthermore, to investigate the structural substrate of functional connectivity between DMN subnetworks, we analyzed structural connectivity within and between the DMN ROIs based on DTI tractography. For each individual fiber tractographic dataset, we counted the fibers passing through any pair of anatomical ROIs within DMN and combined the individual interconnecting tracts across rats. Structural connectivity within and between each DMN module were computed as fiber density by dividing the total fiber bundle by the number of rats and number of voxels within the corresponding modules (64).
Reproducibility of DMN subnetworks.
To evaluate the reproducibility of parcellation of DMN networks, we reexamined its subcomponents under six conditions in SD rats: (i) using different number of rats from the original cohort, and further using nonoverlapping subsets of rats ranging from 1 rat per set through 6 rats per set; (ii) using rs-fMRI scans of a subgroup of 11 rats obtained 2 wk or 3 mo after the initial scans, at both group and individual levels; (iii) using rsFC network constructed at voxelwise level with/without short-distance connections controlled; and (iv) using ICA analysis as an alternative parcellation approach.
Specifically, as for the first validation analysis, first, we randomly selected 2–33 rats from the total 34 rats, and each selection was repeated 100 times. Modularity analysis was rerun for ROI-wise DMN networks (connection density = 20%) constructed from the subgroups of each selection. We further performed the stability analysis on nonoverlapping subsets of the subjects, by randomly assigning all rats into 5–34 subsets, with one to six rats included in each subset. The regroup procedure was repeated for 100 times. For the second validation, a subgroup of 11 rats was scanned on both 2 wk and 3 mo after the initial scans. At group level, the modularity analysis was conducted on each scan day. Partitions of the DMN from the validation analysis were compared with that obtained in the main analysis. Similarity between partitions was estimated using information-theoretic measure, normalized mutual information (NMI) (25). We computed NMI for DMN partitions between first scan and the other two scans. The similarity of averaged functional connectivity matrix on each scan day was also estimated between first scan and the other two scans. At the individual level, we conducted modularity analysis for every single rat on each scan day. We then computed NMI for DMN partitions between its own first scan and the other two scans for every individual rat. In addition, we also computed within-subject spatial correlation of functional connectivity matrix of DMN to compare the connectivity matrices between scans for each rat. For the third validation analysis, we generated weighted group-averaged voxelwise network by averaging the subject-specific networks, which were computed as pairwise temporal correlations among voxels within the DMN mask, and then thresholded using a connection density of 20%. A modified voxelwise network was then created by setting the short-distance connections (<1.3 mm) to zero. To test whether the local connections would bias the modular structure of DMN, the modified and unmodified voxelwise networks were subjected to modularity analysis, respectively.
To evaluate the significant level of similarity, the original partition was reshuffled 100,000 times, yielding an empirical null distribution. A P value was then computed by determining the percentage of the computed null distribution that exceeded the empirically obtained value.
Finally, partitions of the DMN from gICA analysis were compared with that we obtained in the main analysis. Base on the DMN mask created from whole-brain gICA analysis, all rs-fMRI data (two rs-fMRI scans in 34 rats) were further used to generate DMN components using a group-level independent component analysis with the number of components set to 7. For comparison, the spatial distributions of individual components were identified using dual regression, and one-sample t test was performed to generate the group component maps (Fig. S4).
Discussion
Using graph theory-based modularity analysis, we investigated the constituents and organization of the resting-state DMN in anesthetized rats. Analyses indicated that the rat DMN could be parcellated into two subsystems, which were further segregated into five modules. Functional connectivity between the regions within the DMN was tightly associated with white matter fiber connections between corresponding regions based upon DTI tractography. We further assessed the potential modulation of the rat DMN following a model of age-related cognitive dysfunction, and observed distinct modulation within and between specific DMN subsystems.
Organization of the Rat DMN.
Our modularity analysis showed that the rat DMN exhibits prominent community structural organization and can be decomposed into subnetworks based on functional connectivity strength. The analysis partitioned the DMN into an anterior subnetwork containing a frontal module and a posterior subnetwork that was further decomposed into four modules (RSC-HIPP, left and right PPC-visual, and Au/TeA modules).
Structures in the frontal module (Orb, PrL, Cg1, and Cg2) belong to the architectonic subdivision of “orbital medial prefrontal cortex” (OMPFC) identified in rats and monkeys based on axonal tracing and in humans based on neuroimaging studies (26, 27). These brain structures as a whole receive highly processed sensory afferents, provide cortical influence over visceral functions, and participate in high-level cognitive and emotional processes (27).
The posterior DMN subnetwork was partitioned into RSC-HIPP, bilateral PPC-visual, and bilateral Au/TeA modules. The RSC in the RSC-HIPP module is located at a crossroad between the hippocampal formation and areas in the neocortex. Although the RSC is connected primarily to the rostrodorsal hippocampal formation, the caudal parts of the RSC are connected with caudoventral areas of the hippocampal formation. The elaborate connections between the RSC and the hippocampal formation suggest that this projection provides a prominent pathway by which the HIPP processes information related to learning, memory, and emotional behavior (28). The PPC, characterized by multimodal sensory projections that reciprocally connect with the frontal association cortex, has strong connections with visual areas (29–31). PPC and visual association cortex share functional attributes as well as corticocortical connections with medial agranular cortex and orbital cortex (32). It has been suggested that the role of PPC is to use visual sensory input to help guide movements (29). Taken together, the modular architecture of the rodent DMN suggests networks that support efficient neuronal processing by integrating multimodal sensory and affective information to guide behavior in response to dynamic environmental contingencies (3).
Structural Evidence for DMN Organization.
To provide structural evidence in support of its functional organization, we explored the correlation between structural (DTI tractography) and functional connectivity within the DMN, which has been previously demonstrated for both local and global connections (33–35). Three well-known white matter tracts, the cingulum, the frontoparietal fasciculus, and the body and genu of corpus callosum, were identified interconnecting both within and between DMN regions. For example, the cingulum bundle connected regions of PrL, Cg1, and Cg2, whereas the genu of corpus callosum interconnected the lateralized Orb regions within the frontal module. Second, the three fiber tracts also interconnected regions between different DMN modules. Specifically, the cingulum mainly connected regions of PrL, Cg1, and Cg2 in the frontal module and RSC-HIPP module and visual areas in the bilateral PPC-visual modules, which is consistent with previous tracing studies in rats demonstrating reciprocal projections between cingulate and hippocampal formation (36, 37) and visual cortices (38). The frontoparietal fasciculus bundle connected between Orb regions within the frontal module and regions in the bilateral PPC-visual and Au/TeA modules, which once again is in line with traditional tracing studies in demonstrating that orbital areas provide efferent connections to posterior parietal and Au/TeA cortices (29, 31, 39, 40). The body of the corpus callosum provides interhemisphere connections between the left and right PPC-visual modules, which has been confirmed in extensive tracing studies (41). Furthermore, according to the Allen Mouse Brain Connectivity Atlas (42), anterograde viral tracer demonstrates that the retrosplenial cortex is structurally connected with several DMN-related regions including Cg, orbital area, prelimbic area, PPC, visual area, auditory area, and HIPP (CA1). In addition, using the Allen mouse brain-wide axonal projection matrix and resting-state functional connectivity MRI, a recent study demonstrated the presence of a putative DMN in the mouse brain both structurally and functionally (4). Our results are also consistent with previous diffusion imaging studies in humans showing that the fiber tracts of the cingulum, superior frontal-occipital fasciculus (comparable to the frontoparietal fasciculus tract in rats), and the corpus callosum form the major direct neuroanatomical inks among DMN regions (43).
The existence of these fiber tracts provides anatomical support for direct neuronal communications within and between the identified DMN subnetworks, as most of the DMN regions/modules were directly interconnected by these fiber pathways. Indeed, our results show that the microstructural organization (i.e., fiber density) of these tracts correlates positively with the level of functional connectivity within and between DMN subnetworks, that is, if two regions are anatomically connected by a denser bundle of fiber tracts, they tend to be more synchronized in their functional dynamics at rest. Similar observations have been reported in human studies showing a direct linkage between white matter organization and functional connectivity within the DMN (44). Notably, observation of greater density of fibers interconnecting within-module regions than those between modules provides direct structural support for the modular organization of DMN as revealed by its functional connectivity.
It is worth mentioning that, although the tractography-derived anatomical connectivity seems to be spatially correlated with its corresponding functional connectivity, the anatomical connectivity only accounted for a very small part of the individual variations in functional connectivity among DMN subnetworks (r = −0.08 ± 0.15). On the other hand, we replicated the findings of significant spatial correlation between structural and functional connectivity among DMN components in individual rats. The lack of intersubject correlation, but existence of intraspatial correlation in individuals, suggests sizable variations of structural and/or functional connectivity across rats measured by DTI and rs-fMRI. Such variations could be due to intrinsic differences in structural/functional connectivity across animals and/or caused by limitations in imaging measurements (e.g., variations in anesthesia-induced physiological conditions affecting fMRI signal; variations in image distortions affecting DTI signal).
Modulation of DMN Connectivity as a Function of Age-Related Cognitive Dysfunction.
In addition to acting as an “alerting system” to monitor ongoing environmental perturbations, the DMN has also been implicated in higher cognitive functions, involving interactions with such key components as the mPFC, ACC, and RSC. In support of this hypothesis, we examined potential alterations in DMN processing across three groups of behaviorally characterized rats. Compared with healthy young animals, aged rats showed decreased average functional connectivity within and/or between the five identified DMN modules, which is consistent with reports in human aging studies for both cognitively normal (45, 46) and Alzheimer’s disease cases (12, 47, 48), suggesting that age-related cognitive dysfunction is reflected in impaired DMN functional connectivity. Furthermore, when considering aged rats characterized by their behavioral differences in spatial learning and memory (i.e., AI vs. AU groups), AI rats demonstrated significantly decreased functional connectivity in the bilateral PPC-visual modules compared with the age-matched cognitively intact cohort (AU). This weaker bilateral PPC-visual interactions was predictive of poorer spatial memory performance, consistent with the critical role of the PPC in spatial-related processes, such as navigation, spatial attention, and memory (49).
Technical Limitations.
Several technical issues need to be considered when interpreting our data. First, data were obtained under anesthesia to both maintain stable physiological conditions and to limit head movement. The resting-state fMRI signal in rats, as in other species (50, 51), appears to be anesthetic dependent (52, 53). However, Grandjean et al. (51) suggested that the combined use of medetomidine and isoflurane maintains strong correlations within both cortical and subcortical structures in mice. We also reported (3, 51) that the combination of low-dose isoflurane and dexmedetomidine maintains both stable sedation and signal coupling across repeated fMRI experiments. Nevertheless, we cannot rule out the possibility that MRI signals were affected by anesthesia. Second, the imaging resolution in this study was 500 × 500 μm2 with a slice thickness of 1 mm, which limits our ability to differentiate the boundaries between small, spatially close structures. For this same reason, we cannot rule out the possibility that the statistical map covering dorsal HIPP may have resulted from a partial volume effect from retrosplenial dysgranular cortex/retrosplenial granular cortex. Future high-resolution studies are needed to clarify this anatomical uncertainty.
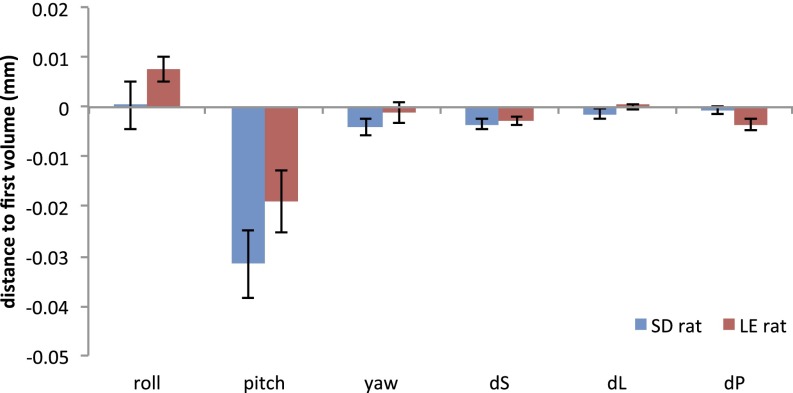
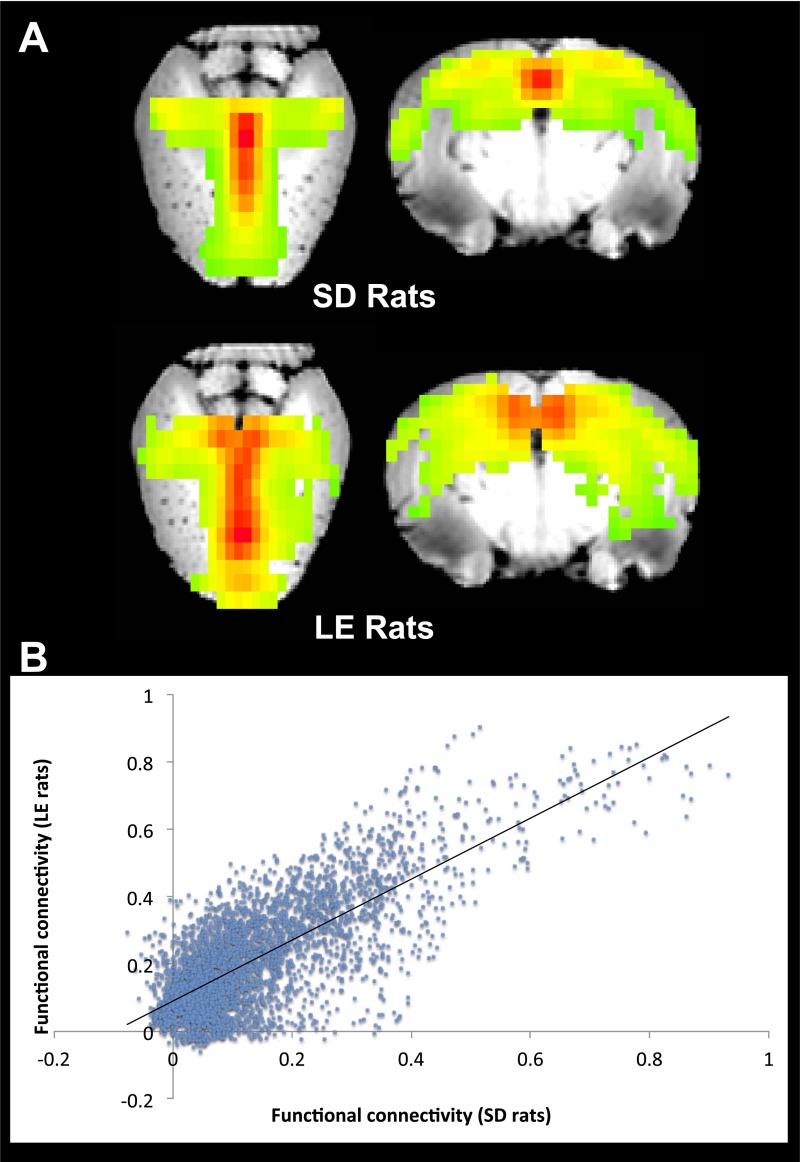
Finally, in this study, we included data from two different strains of rats. To effectively assess the effects of learning and memory on the DMN in rats, Long–Evans (LE) rats were used in the age-related cognitive dysfunction experiment, whereas Sprague–Dawley (SD) animals were used for all other experiments. A previous study indicated that these two strains have different sensitivity to anesthesia (54). However, anesthetic doses were adjusted herein to ensure that respiration and cardiac rates were maintained within normal ranges. We selected LE rats as (i) variability in the cognitive outcome of aging in LE rats has proven to be robustly coupled with a wide variety of neurobiological signatures, from gene expression to neural system analyses (55); and (ii) work in this model has established translational validity and successfully predicts the neurocognitive response to intervention in human aging (56). In this study, no significant head motion between SD and young LE rats (Fig. S5) was found, and the DMN reconstructed from the young group of LE rats also showed high spatial similarity compared with the DMN from SD rats (Fig. S6). These results indicate the consistency in functional signal between LE and SD rats.
Fig. S5.
Head motion parameters in six directions, which included the rotation about the inferior–superior (roll), right–left (pitch), and anterior–posterior (yaw) axis and the displacement in the superior (dS), left (dL), and posterior direction (dP). The results indicate that there was no significant difference in head motion parameters between SD and young group of LE rats.
Fig. S6.
(A) The DMN from 15-components ICA analysis in SD and young group of LE rats. (B) Functional connectivity among DMN structures correlated significantly (r = 0.76, P < 0.0001) between SD and young group of LE rats.
In summary, our results revealed that the rat DMN can be functionally parsed into five subcomponents. Distinct modulation within and between these DMN subcomponents was demonstrated during neurodegenerative, age-related cognitive dysfunction. These results demonstrate that the rat DMN, like its human analog, can be parcellated into anatomically and functionally distinct subcomponents. Together, our findings on the rat DMN and its organization provide a platform to explore the physiological basis and behavioral functions of this prominent, large-scale network.
Methods
Animal Preparation.
Thirty-four male SD rats (Charles River Laboratories) were used in these experiments. Rats weighed 275 ± 25 g upon arrival and were housed two per cage with ad libitum access to food and water. To explore potential age-related modulation within the DMN, a second dataset of 12 young adult (6–8 mo) and 21 aged (24–26 mo) male LE rats (Charles River Laboratories) was used. For the SD rats, following a 0.03 mg/kg, subcutaneous, bolus injection, dexmedetomidine was continuously infused at 0.015 mg⋅kg−1⋅h−1 and isoflurane was gradually reduced from 2% to 0.5%. The anesthetic regime for the LE rats was quite similar, with a 0.015 mg/kg, subcutaneous, bolus injection of dexmedetomidine that was followed by a continuous infusion of 0.01 mg⋅kg−1⋅h−1; isoflurane was reduced from 2% to 0.5%. These anesthetic doses were empirically determined to ensure their respiratory and cardiac rates were in the normal ranges. Rats were secured in an animal holder with a bite bar. All animal procedures were approved by the Animal Care and Use Committees of the National Institute on Drug Abuse and National Institute on Aging Intramural Research Program. For detailed scan preparation, see SI Methods.
Image Acquisition.
MRI data were acquired using a Bruker Biospin 9.4-T scanner with a quadrature receiver coil and birdcage volume transmit coil. High-resolution anatomical images, DTI, two rs-fMRI series were acquired in the SD rats. High-resolution anatomical images and two rs-fMRI series were acquired in the LE rats. For detailed experiment design and acquisition parameters, see SI Methods.
Image Analyses.
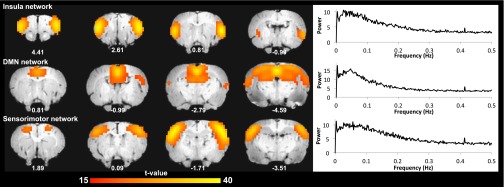
Both fMRI and DTI images were preprocessed using the Analysis of Functional Neuroimaging (AFNI) software package (57). Note that we used a relative wider filtering band (0.01–0.5 Hz) than that normally used in human rs-fMRI data processing, based on the observation that the frequency range where the major power of the rat rs-fMRI data resided was much wider than the typically observed 0.01–0.1-Hz range in human data (Fig. S7). Detailed data analysis is further described in SI Methods.
Fig. S7.
The frequency distribution from three brain network time courses. The frequency range where the major power of the rat rs-fMRI data resided was much wider than the typically observed 0.01–0.1-Hz range in human data (P < 0.001).
DMN ROIs were identified based on gICA analysis and anatomical atlas. To identify subnetworks of the DMN, we performed graph theory-based modularity analysis on the group-averaged functional connectivity matrix of DMN regions. This matrix was subsequently thresholded using the following: (i) 83% connection density to keep only the significant correlations (P < 0.0001, Bonferroni corrected), and (ii) 20% connection density, to keep only the strongest connections while ensuring at least 95% of the network nodes were connected. Within- and between-module connectivity was defined as the average of functional correlations across ROI pairs within or between the identified DMN subnetworks. For details, see SI Methods.
To investigate underlying structural substrates of functional connectivity, we analyzed structural connectivity within and between the DMN ROIs based on DTI tractography in the SD rats. For details, see SI Methods.
Acknowledgments
This study was supported by the Intramural Research Programs of the National Institute on Drug Abuse and National Institute on Aging, National Institutes of Health, and a grant from the Food and Drug Administration Center for Tobacco Products.
Footnotes
The authors declare no conflict of interest.
This article is a PNAS Direct Submission.
This article contains supporting information online at www.pnas.org/lookup/suppl/doi:10.1073/pnas.1601485113/-/DCSupplemental.
References
- 1.Raichle ME, et al. A default mode of brain function. Proc Natl Acad Sci USA. 2001;98(2):676–682. doi: 10.1073/pnas.98.2.676. [DOI] [PMC free article] [PubMed] [Google Scholar]
- 2.Vincent JL, et al. Intrinsic functional architecture in the anaesthetized monkey brain. Nature. 2007;447(7140):83–86. doi: 10.1038/nature05758. [DOI] [PubMed] [Google Scholar]
- 3.Lu H, et al. Rat brains also have a default mode network. Proc Natl Acad Sci USA. 2012;109(10):3979–3984. doi: 10.1073/pnas.1200506109. [DOI] [PMC free article] [PubMed] [Google Scholar]
- 4.Stafford JM, et al. Large-scale topology and the default mode network in the mouse connectome. Proc Natl Acad Sci USA. 2014;111(52):18745–18750. doi: 10.1073/pnas.1404346111. [DOI] [PMC free article] [PubMed] [Google Scholar]
- 5.Schwarz AJ, et al. Anti-correlated cortical networks of intrinsic connectivity in the rat brain. Brain Connect. 2013;3(5):503–511. doi: 10.1089/brain.2013.0168. [DOI] [PMC free article] [PubMed] [Google Scholar]
- 6.Buckner RL, Andrews-Hanna JR, Schacter DL. The brain’s default network: Anatomy, function, and relevance to disease. Ann N Y Acad Sci. 2008;1124:1–38. doi: 10.1196/annals.1440.011. [DOI] [PubMed] [Google Scholar]
- 7.Biswal B, Yetkin FZ, Haughton VM, Hyde JS. Functional connectivity in the motor cortex of resting human brain using echo-planar MRI. Magn Reson Med. 1995;34(4):537–541. doi: 10.1002/mrm.1910340409. [DOI] [PubMed] [Google Scholar]
- 8.Binder JR, et al. Conceptual processing during the conscious resting state. A functional MRI study. J Cogn Neurosci. 1999;11(1):80–95. doi: 10.1162/089892999563265. [DOI] [PubMed] [Google Scholar]
- 9.Spreng RN, Mar RA, Kim AS. The common neural basis of autobiographical memory, prospection, navigation, theory of mind, and the default mode: A quantitative meta-analysis. J Cogn Neurosci. 2009;21(3):489–510. doi: 10.1162/jocn.2008.21029. [DOI] [PubMed] [Google Scholar]
- 10.Anticevic A, Repovs G, Shulman GL, Barch DM. When less is more: TPJ and default network deactivation during encoding predicts working memory performance. Neuroimage. 2010;49(3):2638–2648. doi: 10.1016/j.neuroimage.2009.11.008. [DOI] [PMC free article] [PubMed] [Google Scholar]
- 11.Whitfield-Gabrieli S, et al. Hyperactivity and hyperconnectivity of the default network in schizophrenia and in first-degree relatives of persons with schizophrenia. Proc Natl Acad Sci USA. 2009;106(4):1279–1284. doi: 10.1073/pnas.0809141106. [DOI] [PMC free article] [PubMed] [Google Scholar]
- 12.Greicius MD, Srivastava G, Reiss AL, Menon V. Default-mode network activity distinguishes Alzheimer’s disease from healthy aging: Evidence from functional MRI. Proc Natl Acad Sci USA. 2004;101(13):4637–4642. doi: 10.1073/pnas.0308627101. [DOI] [PMC free article] [PubMed] [Google Scholar]
- 13.Kennedy DP, Redcay E, Courchesne E. Failing to deactivate: Resting functional abnormalities in autism. Proc Natl Acad Sci USA. 2006;103(21):8275–8280. doi: 10.1073/pnas.0600674103. [DOI] [PMC free article] [PubMed] [Google Scholar]
- 14.Sutherland MT, McHugh MJ, Pariyadath V, Stein EA. Resting state functional connectivity in addiction: Lessons learned and a road ahead. Neuroimage. 2012;62(4):2281–2295. doi: 10.1016/j.neuroimage.2012.01.117. [DOI] [PMC free article] [PubMed] [Google Scholar]
- 15.Lerman C, et al. Large-scale brain network coupling predicts acute nicotine abstinence effects on craving and cognitive function. JAMA Psychiatry. 2014;71(5):523–530. doi: 10.1001/jamapsychiatry.2013.4091. [DOI] [PMC free article] [PubMed] [Google Scholar]
- 16.Andrews-Hanna JR, Reidler JS, Sepulcre J, Poulin R, Buckner RL. Functional-anatomic fractionation of the brain’s default network. Neuron. 2010;65(4):550–562. doi: 10.1016/j.neuron.2010.02.005. [DOI] [PMC free article] [PubMed] [Google Scholar]
- 17.Zuo XN, et al. Reliable intrinsic connectivity networks: Test-retest evaluation using ICA and dual regression approach. Neuroimage. 2010;49(3):2163–2177. doi: 10.1016/j.neuroimage.2009.10.080. [DOI] [PMC free article] [PubMed] [Google Scholar]
- 18.Qin P, Northoff G. How is our self related to midline regions and the default-mode network? Neuroimage. 2011;57(3):1221–1233. doi: 10.1016/j.neuroimage.2011.05.028. [DOI] [PubMed] [Google Scholar]
- 19.Amft M, et al. Definition and characterization of an extended social-affective default network. Brain Struct Funct. 2015;220(2):1031–1049. doi: 10.1007/s00429-013-0698-0. [DOI] [PMC free article] [PubMed] [Google Scholar]
- 20.Robin J, et al. Functional connectivity of hippocampal and prefrontal networks during episodic and spatial memory based on real-world environments. Hippocampus. 2015;25(1):81–93. doi: 10.1002/hipo.22352. [DOI] [PubMed] [Google Scholar]
- 21.Kiviniemi V, et al. Functional segmentation of the brain cortex using high model order group PICA. Hum Brain Mapp. 2009;30(12):3865–3886. doi: 10.1002/hbm.20813. [DOI] [PMC free article] [PubMed] [Google Scholar]
- 22.Lu H, et al. Registering and analyzing rat fMRI data in the stereotaxic framework by exploiting intrinsic anatomical features. Magn Reson Imaging. 2010;28(1):146–152. doi: 10.1016/j.mri.2009.05.019. [DOI] [PMC free article] [PubMed] [Google Scholar]
- 23.Basser PJ, Pajevic S, Pierpaoli C, Duda J, Aldroubi A. In vivo fiber tractography using DT-MRI data. Magn Reson Med. 2000;44(4):625–632. doi: 10.1002/1522-2594(200010)44:4<625::aid-mrm17>3.0.co;2-o. [DOI] [PubMed] [Google Scholar]
- 24.Wakana S, Jiang H, Nagae-Poetscher LM, van Zijl PC, Mori S. Fiber tract-based atlas of human white matter anatomy. Radiology. 2004;230(1):77–87. doi: 10.1148/radiol.2301021640. [DOI] [PubMed] [Google Scholar]
- 25.Meilă M. Comparing clusterings—an information based distance. J Multivar Anal. 2007;98(5):873–895. [Google Scholar]
- 26.An X, Bandler R, Ongür D, Price JL. Prefrontal cortical projections to longitudinal columns in the midbrain periaqueductal gray in macaque monkeys. J Comp Neurol. 1998;401(4):455–479. [PubMed] [Google Scholar]
- 27.Ongür D, Price JL. The organization of networks within the orbital and medial prefrontal cortex of rats, monkeys and humans. Cereb Cortex. 2000;10(3):206–219. doi: 10.1093/cercor/10.3.206. [DOI] [PubMed] [Google Scholar]
- 28.Wyss JM, Van Groen T. Connections between the retrosplenial cortex and the hippocampal formation in the rat: A review. Hippocampus. 1992;2(1):1–11. doi: 10.1002/hipo.450020102. [DOI] [PubMed] [Google Scholar]
- 29.Kolb B, Walkey J. Behavioural and anatomical studies of the posterior parietal cortex in the rat. Behav Brain Res. 1987;23(2):127–145. doi: 10.1016/0166-4328(87)90050-7. [DOI] [PubMed] [Google Scholar]
- 30.Miller MW, Vogt BA. Direct connections of rat visual cortex with sensory, motor, and association cortices. J Comp Neurol. 1984;226(2):184–202. doi: 10.1002/cne.902260204. [DOI] [PubMed] [Google Scholar]
- 31.Reep RL, Chandler HC, King V, Corwin JV. Rat posterior parietal cortex: Topography of corticocortical and thalamic connections. Exp Brain Res. 1994;100(1):67–84. doi: 10.1007/BF00227280. [DOI] [PubMed] [Google Scholar]
- 32.Chandler HC, King V, Corwin JV, Reep RL. Thalamocortical connections of rat posterior parietal cortex. Neurosci Lett. 1992;143(1-2):237–242. doi: 10.1016/0304-3940(92)90273-a. [DOI] [PubMed] [Google Scholar]
- 33.Grayson DS, et al. Structural and functional rich club organization of the brain in children and adults. PLoS One. 2014;9(2):e88297. doi: 10.1371/journal.pone.0088297. [DOI] [PMC free article] [PubMed] [Google Scholar]
- 34.Schwarz AJ, Gozzi A, Bifone A. Community structure and modularity in networks of correlated brain activity. Magn Reson Imaging. 2008;26(7):914–920. doi: 10.1016/j.mri.2008.01.048. [DOI] [PubMed] [Google Scholar]
- 35.Tovar-Moll F, et al. Structural and functional brain rewiring clarifies preserved interhemispheric transfer in humans born without the corpus callosum. Proc Natl Acad Sci USA. 2014;111(21):7843–7848. doi: 10.1073/pnas.1400806111. [DOI] [PMC free article] [PubMed] [Google Scholar]
- 36.Swanson LW, Cowan WM. An autoradiographic study of the organization of the efferent connections of the hippocampal formation in the rat. J Comp Neurol. 1977;172(1):49–84. doi: 10.1002/cne.901720104. [DOI] [PubMed] [Google Scholar]
- 37.Meibach RC, Siegel A. Thalamic projections of the hippocampal formation: Evidence for an alternate pathway involving the internal capsule. Brain Res. 1977;134(1):1–12. doi: 10.1016/0006-8993(77)90921-0. [DOI] [PubMed] [Google Scholar]
- 38.Vogt BA, Miller MW. Cortical connections between rat cingulate cortex and visual, motor, and postsubicular cortices. J Comp Neurol. 1983;216(2):192–210. doi: 10.1002/cne.902160207. [DOI] [PubMed] [Google Scholar]
- 39.Reep RL, Corwin JV, King V. Neuronal connections of orbital cortex in rats: Topography of cortical and thalamic afferents. Exp Brain Res. 1996;111(2):215–232. doi: 10.1007/BF00227299. [DOI] [PubMed] [Google Scholar]
- 40.Paperna T, Malach R. Patterns of sensory intermodality relationships in the cerebral cortex of the rat. J Comp Neurol. 1991;308(3):432–456. doi: 10.1002/cne.903080310. [DOI] [PubMed] [Google Scholar]
- 41.Olavarria J, van Sluyters RC. Axons from restricted regions of the cortex pass through restricted portions of the corpus callosum in adult and neonatal rats. Brain Res. 1986;390(2):309–313. doi: 10.1016/s0006-8993(86)80241-4. [DOI] [PubMed] [Google Scholar]
- 42.Kuan L, et al. Neuroinformatics of the Allen Mouse Brain Connectivity Atlas. Methods. 2015;73:4–17. doi: 10.1016/j.ymeth.2014.12.013. [DOI] [PubMed] [Google Scholar]
- 43.van den Heuvel MP, Mandl RC, Kahn RS, Hulshoff Pol HE. Functionally linked resting-state networks reflect the underlying structural connectivity architecture of the human brain. Hum Brain Mapp. 2009;30(10):3127–3141. doi: 10.1002/hbm.20737. [DOI] [PMC free article] [PubMed] [Google Scholar]
- 44.van den Heuvel M, Mandl R, Luigjes J, Hulshoff Pol H. Microstructural organization of the cingulum tract and the level of default mode functional connectivity. J Neurosci. 2008;28(43):10844–10851. doi: 10.1523/JNEUROSCI.2964-08.2008. [DOI] [PMC free article] [PubMed] [Google Scholar]
- 45.Andrews-Hanna JR, et al. Disruption of large-scale brain systems in advanced aging. Neuron. 2007;56(5):924–935. doi: 10.1016/j.neuron.2007.10.038. [DOI] [PMC free article] [PubMed] [Google Scholar]
- 46.Damoiseaux JS, et al. Reduced resting-state brain activity in the “default network” in normal aging. Cereb Cortex. 2008;18(8):1856–1864. doi: 10.1093/cercor/bhm207. [DOI] [PubMed] [Google Scholar]
- 47.Damoiseaux JS, Prater KE, Miller BL, Greicius MD. Functional connectivity tracks clinical deterioration in Alzheimer’s disease. Neurobiol Aging. 2012;33(4):828.e19–828.e30. doi: 10.1016/j.neurobiolaging.2011.06.024. [DOI] [PMC free article] [PubMed] [Google Scholar]
- 48.Brier MR, et al. Loss of intranetwork and internetwork resting state functional connections with Alzheimer’s disease progression. J Neurosci. 2012;32(26):8890–8899. doi: 10.1523/JNEUROSCI.5698-11.2012. [DOI] [PMC free article] [PubMed] [Google Scholar]
- 49.Torrealba F, Valdés JL. The parietal association cortex of the rat. Biol Res. 2008;41(4):369–377. [PubMed] [Google Scholar]
- 50.Barttfeld P, et al. Signature of consciousness in the dynamics of resting-state brain activity. Proc Natl Acad Sci USA. 2015;112(3):887–892. doi: 10.1073/pnas.1418031112. [DOI] [PMC free article] [PubMed] [Google Scholar]
- 51.Grandjean J, Schroeter A, Batata I, Rudin M. Optimization of anesthesia protocol for resting-state fMRI in mice based on differential effects of anesthetics on functional connectivity patterns. Neuroimage. 2014;102(Pt 2):838–847. doi: 10.1016/j.neuroimage.2014.08.043. [DOI] [PubMed] [Google Scholar]
- 52.Liu X, Zhu XH, Zhang Y, Chen W. The change of functional connectivity specificity in rats under various anesthesia levels and its neural origin. Brain Topogr. 2013;26(3):363–377. doi: 10.1007/s10548-012-0267-5. [DOI] [PMC free article] [PubMed] [Google Scholar]
- 53.Hutchison RM, Hutchison M, Manning KY, Menon RS, Everling S. Isoflurane induces dose-dependent alterations in the cortical connectivity profiles and dynamic properties of the brain’s functional architecture. Hum Brain Mapp. 2014;35(12):5754–5775. doi: 10.1002/hbm.22583. [DOI] [PMC free article] [PubMed] [Google Scholar]
- 54.Russell GB, Graybeal JM. Differences in anesthetic potency between Sprague-Dawley and Long-Evans rats for isoflurane but not nitrous oxide. Pharmacology. 1995;50(3):162–167. doi: 10.1159/000139278. [DOI] [PubMed] [Google Scholar]
- 55.Fletcher BR, Rapp PR. Normal neurocognitive aging. In: Weiner IB, Nelson RJ, Mizumori S, editors. Handbook of Psychology. Vol 3. Wiley; New York: 2012. pp. 643–664. [Google Scholar]
- 56.Bakker A, et al. Reduction of hippocampal hyperactivity improves cognition in amnestic mild cognitive impairment. Neuron. 2012;74(3):467–474. doi: 10.1016/j.neuron.2012.03.023. [DOI] [PMC free article] [PubMed] [Google Scholar]
- 57.Cox RW, Hyde JS. Software tools for analysis and visualization of fMRI data. NMR Biomed. 1997;10(4-5):171–178. doi: 10.1002/(sici)1099-1492(199706/08)10:4/5<171::aid-nbm453>3.0.co;2-l. [DOI] [PubMed] [Google Scholar]
- 58.Gallagher M, Burwell R, Burchinal M. Severity of spatial learning impairment in aging: Development of a learning index for performance in the Morris water maze. Behav Neurosci. 1993;107(4):618–626. doi: 10.1037//0735-7044.107.4.618. [DOI] [PubMed] [Google Scholar]
- 59.Williams KA, et al. Comparison of alpha-chloralose, medetomidine and isoflurane anesthesia for functional connectivity mapping in the rat. Magn Reson Imaging. 2010;28(7):995–1003. doi: 10.1016/j.mri.2010.03.007. [DOI] [PMC free article] [PubMed] [Google Scholar]
- 60.Mori S, Crain BJ, Chacko VP, van Zijl PC. Three-dimensional tracking of axonal projections in the brain by magnetic resonance imaging. Ann Neurol. 1999;45(2):265–269. doi: 10.1002/1531-8249(199902)45:2<265::aid-ana21>3.0.co;2-3. [DOI] [PubMed] [Google Scholar]
- 61.Newman ME. Analysis of weighted networks. Phys Rev E Stat Nonlin Soft Matter Phys. 2004;70(5 Pt 2):056131. doi: 10.1103/PhysRevE.70.056131. [DOI] [PubMed] [Google Scholar]
- 62.Newman ME. Modularity and community structure in networks. Proc Natl Acad Sci USA. 2006;103(23):8577–8582. doi: 10.1073/pnas.0601602103. [DOI] [PMC free article] [PubMed] [Google Scholar]
- 63.Maslov S, Sneppen K. Specificity and stability in topology of protein networks. Science. 2002;296(5569):910–913. doi: 10.1126/science.1065103. [DOI] [PubMed] [Google Scholar]
- 64.Honey CJ, et al. Predicting human resting-state functional connectivity from structural connectivity. Proc Natl Acad Sci USA. 2009;106(6):2035–2040. doi: 10.1073/pnas.0811168106. [DOI] [PMC free article] [PubMed] [Google Scholar]


