Significance
The asymmetric organization of cellular membranes is a critical determinant of cell and tissue physiology. Phospholipid flippases are principle regulators of this membrane asymmetry, and understanding their mechanics will be important for determining how deficiencies of these enzymes lead to several different diseases. The current study has identified a key structural mechanism for the exclusion of sphingomyelin as a flippase substrate. Understanding how these unique enzymes recognize and transport substrates can direct pharmacologic and therapeutic strategies for medical applications. Finally, the specificity of this designer enzyme represents a unique opportunity to modulate membrane biology intentionally through directed perturbations in phospholipid asymmetry.
Keywords: sphingomyelin, P4-ATPase, membrane asymmetry, directed evolution
Abstract
Phospholipid flippases in the type IV P-type ATPase (P4-ATPases) family establish membrane asymmetry and play critical roles in vesicular transport, cell polarity, signal transduction, and neurologic development. All characterized P4-ATPases flip glycerophospholipids across the bilayer to the cytosolic leaflet of the membrane, but how these enzymes distinguish glycerophospholipids from sphingolipids is not known. We used a directed evolution approach to examine the molecular mechanisms through which P4-ATPases discriminate substrate backbone. A mutagenesis screen in the yeast Saccharomyces cerevisiae has identified several gain-of-function mutations in the P4-ATPase Dnf1 that facilitate the transport of a novel lipid substrate, sphingomyelin. We found that a highly conserved asparagine (N220) in the first transmembrane segment is a key enforcer of glycerophospholipid selection, and specific substitutions at this site allow transport of sphingomyelin.
The asymmetry of the membrane bilayer is a fundamental feature of the eukaryotic plasma membrane (1). Phospholipid (PL) species such as phosphatidylserine (PS), phosphatidylinositol (PI), and phosphatidylethanolamine (PE) dominate the cytofacial leaflet, whereas phosphatidylcholine (PC) and various sphingolipids (SLs) populate the exofacial leaflet (2, 3). Organelle membrane asymmetry has proven more difficult to study, and the precise distribution of PLs is still unclear; however, evidence suggests that the organelles of the secretory and endocytic pathways also exhibit asymmetric membranes. For example, PS is initially enriched in the luminal leaflet of the endoplasmic reticulum (ER) but flips to the cytofacial leaflet at the trans-Golgi network (4). This asymmetric membrane architecture has been demonstrated to affect membrane curvature (5–8), secretory function (6, 9–16), membrane polarization (17), and intra- and intercellular signaling (17–20).
PL flippases in the type IV P-type ATPase family (P4-ATPases) help establish membrane asymmetry by using ATP to transport specific glycerophospholipids (GPLs) from the luminal/exofacial to the cytofacial leaflet of the membrane (21, 22). P4-ATPases have been implicated in a host of diverse diseases such as hepatic cholestasis (23–25), aberrant lymphocyte development (26, 27), anemia (27, 28), hearing loss (29), neurologic disease (30–32), and diabetes (33). Eukaryotic organisms express several P4-ATPases that have different subcellular localizations, tissue specificities, and substrate preferences (34). Understanding the substrate preferences of these enzymes and the physical means of substrate discrimination is important for understanding their role in membrane biology, development, and disease.
The P-type ATPase family shares a conserved enzyme architecture that can be separated into four primary domains: the actuator (A), the nucleotide-binding (N), the phosphorylation (P), and the transmembrane (TM) domains (35). P4-ATPase substrate selection and translocation are coordinated entirely by the TM domain, which is composed of 10 membrane-spanning helices and several short perimembranous loops (36). The yeast P4-ATPases Dnf1, Dnf2, and Drs2 and the mammalian P4-ATPase ATP8A2 use conserved residues within TM segments 1, 2, 3, 4, and 5 to determine substrate selection and transport (36–41). Single-residue substitutions, such as ATP8A2I364S, ATP8A2K867A, Dnf1F213S, Dnf1T254A, Dnf1D258E, Dnf1N550S, and Dnf1Y618F, have the ability to change PL selection and transport. For example, Dnf1 normally transports PC and PE, but gain-of-function mutations have been isolated that allow Dnf1 to transport PS (36, 38, 39). Thus, the mechanism of substrate discrimination by P4-ATPases is starting to emerge. However, only PLs containing a glycerol backbone (sn-1,2-glycerophospholipids) are known to be endogenous substrates of these flippases (42–45), and no P4-ATPases have been demonstrated to transport SLs. These findings imply that the enzyme binds and selects not only the headgroup and fatty acyl chains but also the glycerol backbone; however, the mechanism these enzymes use to select the backbone was unknown until now.
We have determined how a P4-ATPase discriminates and selects its GPL substrate through the directed evolution of a sphingomyelin (SM) flippase. The yeast P4-ATPase Dnf1 normally recognizes PC and PE but does not transport SM efficiently even though SM and PC have the same phosphocholine headgroup (36, 39, 46). We reasoned that a screen for Dnf1 gain-of-function mutations that allowed SM transport could identify residues important for backbone selection. Because budding yeast do not produce SM, but instead synthesize SLs containing a phosphoinositol headgroup, we anticipated that these Dnf1 variants would not perturb the growth of the cells. We have engineered a yeast P4-ATPase that recognizes and translocates a fluorescently tagged SM. This SM flippase is derived from Dnf1 with two substitutions, one in TM1 and a second at TM5. These backbone-selective substitutions cluster near, but are independent of, previously identified residues that influence substrate transport, headgroup coordination, and acyl-chain occupancy.
Results
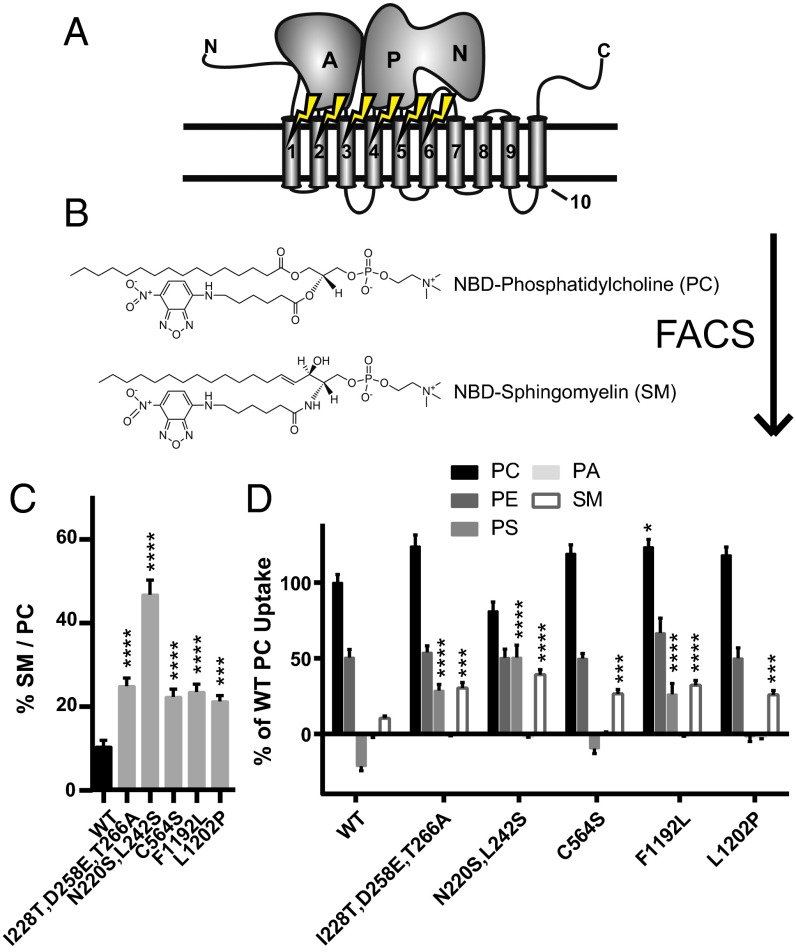
Two independent but related sites specify substrate translocation at the cytofacial (entry gate) and exofacial/luminal (exit gate) aspects of the TM domain in yeast P4-ATPases (39). These two sites are composed of clustered residues capable of selectively influencing substrate translocation depending on PL headgroup or acyl chain occupancy; however, no mutations at these sites substantially change the preference for GPL versus SL substrates. To determine the primary structural components regulating the selection of the glycerol backbone, we leveraged three previously generated libraries of Dnf1 mutations (38, 39). These plasmid-linked libraries were created in a dnf1,2,3∆drs2∆ background (lacking four of the five yeast flippases) using error-prone PCR-based mutagenesis of TM1–2, TM3–4, and TM5–6 (Fig. 1A). Collectively, these libraries represent ∼6,000 mutations targeted to ∼250 codons.
Fig. 1.
The FACS SM+ screen identifies substitutions throughout TM1, -2, -3, and -5 of Dnf1 that are capable of increasing NBD-SM transport. (A) The first six TM segments were mutagenized by error-prone PCR and selected through FACS for their ability to transport NBD-SM. (B) NBD-SM differs from NBD-PC only in its sphingosine backbone. (C) Five substitutions that double the preference of Dnf1 for NBD-SM were isolated. (D) Measurements of alternative NBD-labeled PLs demonstrate substrate specificity in the SM+ alleles. Negative values occur when the uptake of vector-only control NBD-PL is greater than the uptake of experimental samples. n ≥ 9 ± SEM for all data. Comparisons to WT ratio or substrate uptake were made with one-way ANOVA using Tukey’s post hoc analysis; *P < 0.05; ***P < 0.001; ****P < 0.0001.
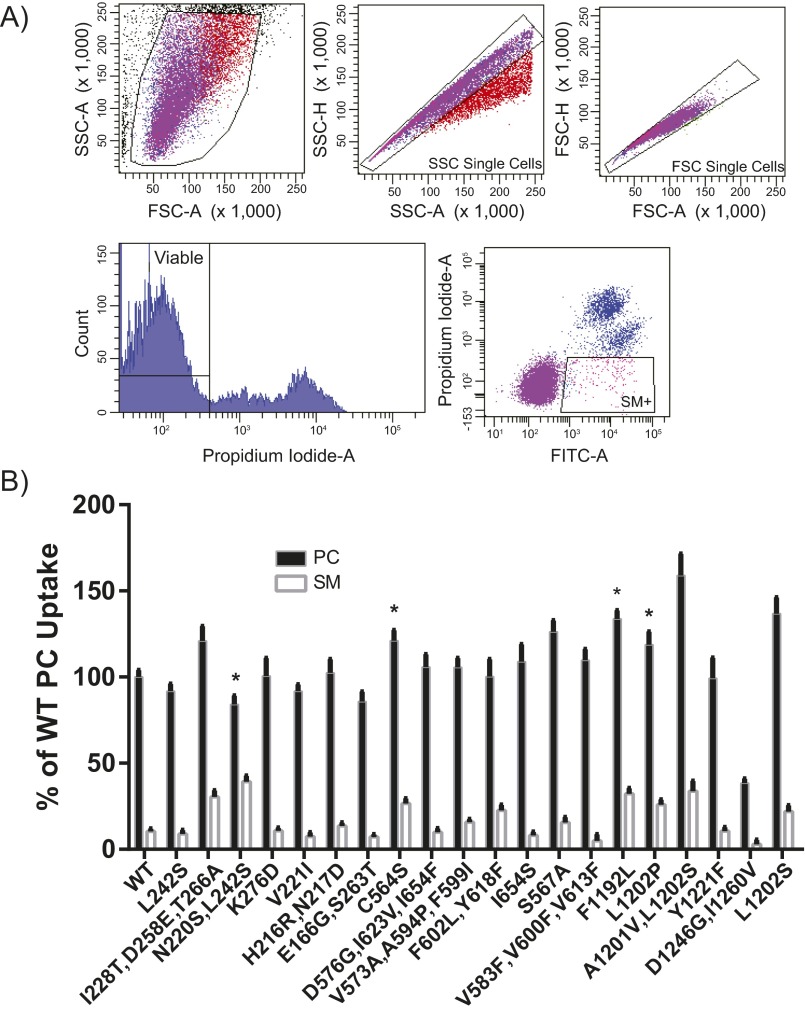
PC and SM are structurally similar PLs (Fig. 1B); each contains a choline headgroup, a phosphate, and discrete acyl chains. The primary chemical difference between these two molecules is the backbone (glycerol versus sphingosine). PLs with a fluorescent 7-nitro-2-1,3-benzoxadiazol-4-yl (NBD) label attached to a C6 acyl chain were administered to cells expressing the Dnf1 mutants, and fluorescence was measured using an established protocol (39); substrate transport is represented by an increase in cellular fluorescence (FITC signal). The mutant libraries were examined for increased NBD-SM uptake and sorted twice via FACS (Fig. S1A). Sorted populations were plated for clonal isolation, and plasmids were extracted for validation (SM+) (Fig. S1B).
Fig. S1.
The FACS SM+ screen identifies substitutions through TM1, -2, -3, -4, and -5 that are capable of increasing NBD-SM transport. (A) Dnf1 mutant libraries were gated to select viable, single-cell populations for sorting. Cells containing the top ∼1% of the FITC signal were sorted and cultured. (B) The first-generation hits from the FACS SM+ screen reveal several alleles capable of translocating SM. Several of the SM+ alleles bore substitutions at the same position (e.g., L1202P and L1202S), whereas others were characterized by identical substitutions from different codon changes (e.g., C564S); these observations support previous assertions regarding the complexity of this mutagenesis library (39). n ≥ 9, ± SEM; the asterisk indicates single or double Dnf1 mutants that doubled SM preference relative to WT (see Fig. 1C).
Plasmids derived from the screen were sequenced and transformed into a naive dnf1,2∆ genetic background. Validation studies of the SM+ clonal strains assessed and compared NBD-PC and NBD-SM uptake (Fig. S1B). Briefly, these assays involve the administration of the fluorescent lipid, its back-extraction from the exofacial leaflet, and cellular fluorescence measurements of lipid uptake. Fluorescence values obtained from vector-only controls were subtracted from the experimental samples to normalize for background uptake. PC is the primary WT Dnf1 substrate; therefore its fluorescence is set to 100% signal, and all other lipid uptake is presented relative to WT PC (Materials and Methods).
The ability to transport NBD-SM was the principle basis of the screen; however, the aim of the study was to identify residues capable of altering the substrate preference of Dnf1. A ratiometric analysis of substrate transport is an alternative method for examining substrate preference. Transport ratios normalize substrate uptake to a known benchmark, thereby mitigating potential false positives that could arise through a general increase in substrate transport without a change in specificity. The preferred substrate of Dnf1 is PC; therefore we examined SM/PC ratios in our SM+ collection. Five mutant Dnf1 proteins demonstrated a greater than twofold increase in SM preference relative to WT (Fig. 1C). Among these five hits, Dnf1N220S,L242S displayed the greatest SM preference (Fig. 1C) because of its substantially increased NBD-SM transport combined with a reduction in NBD-PC uptake (Fig. 1D). Examinations of additional NBD-PLs, PE, PS, and phosphatidic acid (PA), indicated that several of these new positions were also influencing headgroup coordination (Fig. 1D). None of the variants recognized NBD-PA, and most of the variants transported NBD-PE at levels similar to WT Dnf1. However, several of the Dnf1 mutants displayed a substantial increase in NBD-PS uptake. These observations were not unexpected; the proximity of the substrate backbone and headgroup make it likely that perturbations of substrate selection at one point in the enzyme may influence binding and coordination at a secondary position. Locating the SM+ substitutions on a topology diagram of Dnf1 (Fig. S2) highlights an interesting correlation: Cytofacial mutations tended to increase PS transport (Fig. 1D). These data agree with previous studies that have demonstrated that the cytofacial aspect of TMs 1–4 are a major determinant of PS headgroup selection in Dnf1 and Drs2 (36, 38, 39).
Fig. S2.
Topology plot of the top SM-permissive substitutions in TM1–6 of Saccharomyces cerevisiae Dnf1. The cytofacial N220S and F1192L substitutions exhibited increased uptake of NBD-PS, but the exofacial/luminal C564S and L1202P did not influence NBD-PS transport.
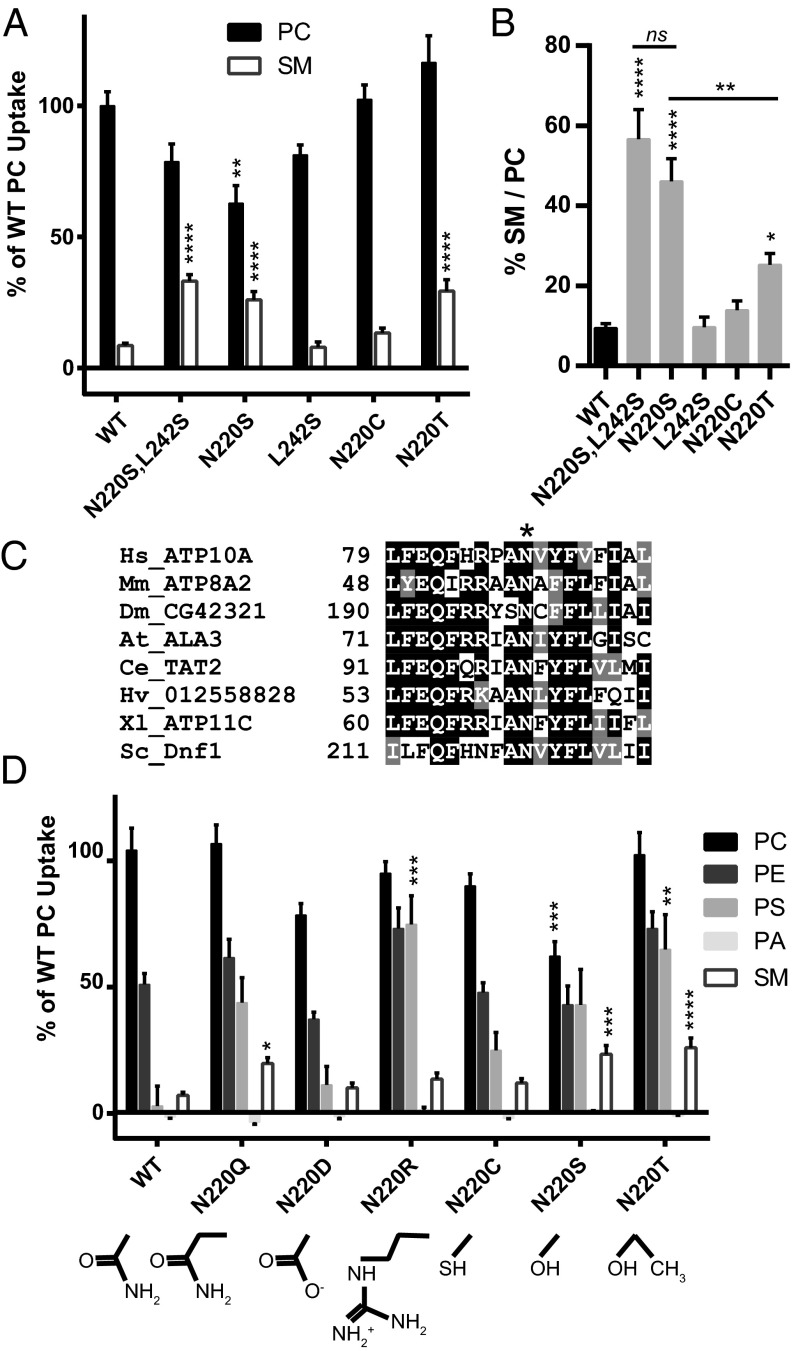
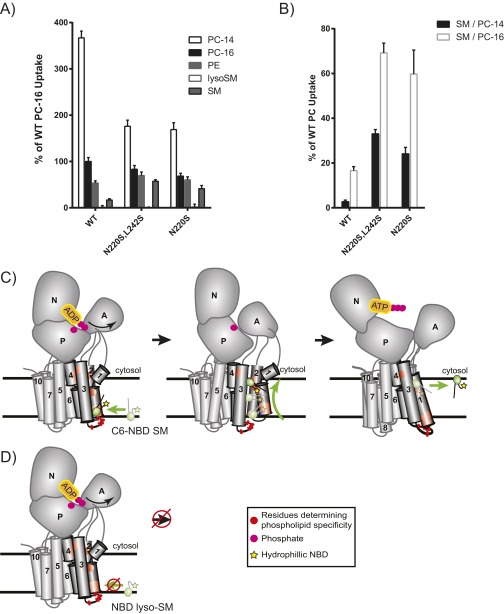
Dnf1N220S,L242S is composed of substitutions at the cytofacial (N220S) and luminal/exofacial (L242S) aspects of the TM domain, and we sought to determine if one of these residues was dominant in the selection and transport of NBD-SM. Single-substitution alleles were generated for each mutation and were examined as described above. Measurements of NBD-SM transport demonstrate that the selection of and preference for NBD-SM is largely retained in the Dnf1N220S single mutant (Fig. 2 A and B). Examinations of alternative acyl chain lengths for the PC and SM substrates revealed no changes in these preferences and established that the substrate could not be accommodated if the NBD group was placed on the long-chain base (Fig. S3).
Fig. 2.
Hydroxyl, but not sulfhydryl, substitutions at the highly conserved N220 are sufficient for SM translocation. (A and B) A serine at position N220 increases NBD-SM selection (A) and preference (B). (C) An alignment of diverse P4-ATPase sequences from mammals to fungi indicates conservation of N220. (D) Substrate transport measurements of alternative biochemical substitutions at position 220 demonstrate the coordination of backbone and headgroup selection. n ≥ 3 for PA examinations, and n ≥ 9 ± SEM for all remaining data. Comparisons to WT ratio or substrate uptake were made with one-way ANOVA using Tukey’s post hoc analysis; *P < 0.05; **P < 0.01; ***P < 0.001; ****P < 0.0001.
Fig. S3.
N220S substrate preference is not attributed to differences in substrate solubility or the length of the sn1 acyl position and long-chain base, and is unable to transport NBD-lyso-SM. When measuring SM selection and preference, we were concerned that our observations might be influenced by differences in substrate solubility in NBD-PC and NBD-SM. Differences in solubility would be predicted to alter substrate administration, incorporation into the plasma membrane, and ultimately accessibility to the P4-ATPase. Additionally, the sphingosine backbone carries a trans double bond at position 4. This trans double bond could alter the positioning of the long-chain base within the substrate-binding pocket of the enzyme, thereby influencing the ability to discriminate the length of this base. We measured the uptake of two different NBD-PC substrates with sn1 acyl-chain lengths of 14 and 16 carbons, respectively. Dnf1WT was found to take up PC-14 better than PC-16, as was consistent with its increased solubility. We also tested whether the location of the NBD label on the SM substrate was critical to its transport. Previous work has shown that the yeast Dnf1 enzyme is preferentially a lyso-PL transporter, suggesting that the Dnf1 enzyme recognizes the sn2 C6-NBD GPLs as it would lyso-PLs (38). We examined a lyso-SM substrate with an NBD label at the distal end of the sphingosine chain and found that this substrate could not be recognized by the SM+ mutants. These results likely suggest that the hydrophilic NBD group snorkels up to the aqueous interface of the membrane and perturbs lateral recognition of the lyso-SM substrate by Dnf1. (A) We found that Dnf1N220S,L242S and Dnf1N220S did not enhance the selection of a more soluble NBD-PC containing a shorter sn1 acyl chain but instead reduced the selection of PC-14 similar to that of PC-16. Additionally, the SM+ mutants were unable to recognize NBD-lyso-SM with a fluorophore attached to the distal end of the sphingosine chain. (B) Dnf1N220S,L242S and Dnf1N220S also increased the preference for NBD-SM when normalized to PC-14 and PC-16, suggesting that differences in discriminating substrate solubility or the length of the sn1/long-chain base acyl chain were not responsible for the observed increase in NBD-SM uptake. n ≥ 6 ± SEM. (C) We predict that the C-6 NBD PLs, like the natural substrates, are recognized laterally at the luminal/exofacial aspect of the P4-ATPase between TMs 1, 3, and 4. The PL then is transported through the enzyme and membrane bilayer as a function of ATP catalysis and is released from the P4-ATPase exit gate at the cytofacial aspect of the membrane. (D) Conversely, lyso-SM with the hydrophilic NBD label on the distal end of the long-chain base is predicted to cause the hydrophobic tail to snorkel up to the aqueous interface of the membrane (59), thereby preventing lateral recognition of the substrate at the entry gate.
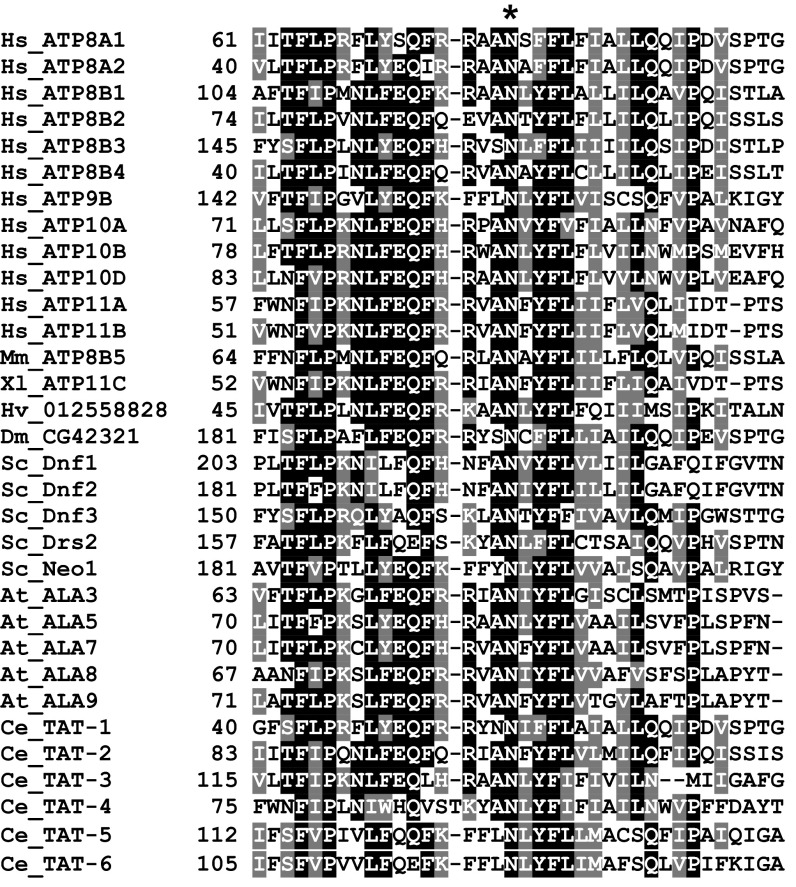
An alignment of diverse P4-ATPase sequences illustrates the identical conservation of asparagine at position 220 of TM1 (Fig. 2C and Fig. S4), suggesting that this residue may be a conserved mechanism for selection of the substrate’s glycerol backbone. Conservative substitutions demonstrated the functional nuances of the N220S mutation. Exchanging the serine hydroxyl for a cysteine sulfhydryl in Dnf1N220C failed to recapitulate the NBD-SM selection and preference phenotypes (Fig. 2 A and B), whereas Dnf1N220T retained the selection of (Fig. 2A), but not preference for (Fig. 2B), NBD-SM. Additional substitutions at the 220 position revealed enhanced NBD-PS transport with nearly any mutation (Fig. 2D). Collectively, these data indicate that the N220 side chain is involved in a complex substrate-binding pocket and, when changed to a hydroxyl, has the ability to select the sphingosine backbone.
Fig. S4.
A detailed ClustalW sequence alignment around Dnf1 N220. The asterisk demonstrates identity across species and P4-ATPases at this position. Sequence accession numbers are listed in SI Materials and Methods.
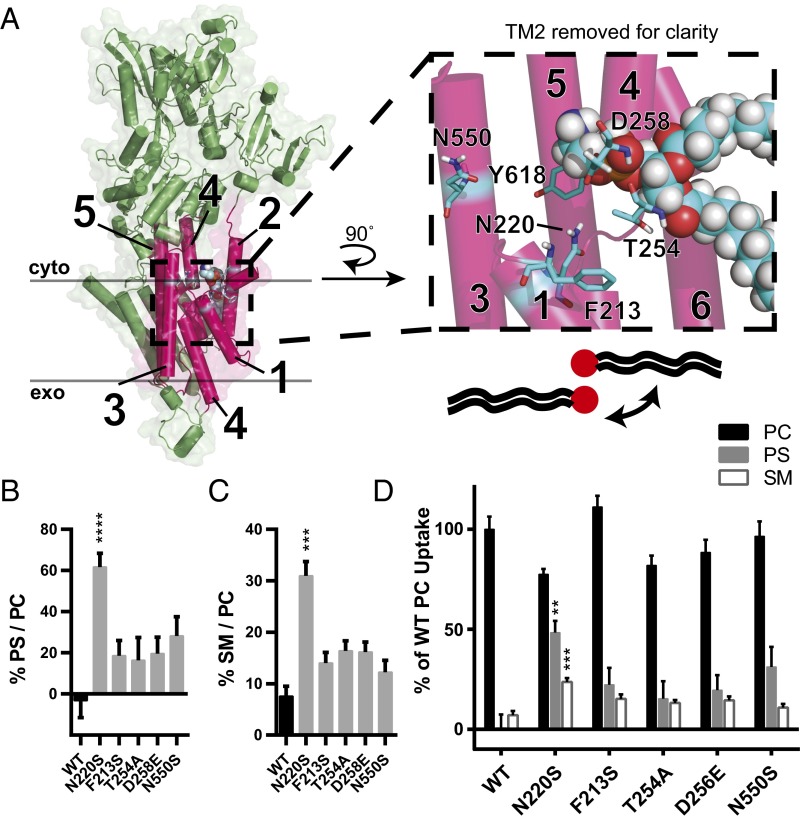
The ability for N220S to influence sphingosine backbone and PS headgroup selection suggested that this residue may be positioned near the previously defined cytofacial “exit gate” of the Dnf1 enzyme. To determine where the N220 residue may be located relative to headgroup-selective residues, we modeled Dnf1 onto a crystal structure of the sarco/endoplasmic reticulum calcium ATPase (SERCA) (PDB ID code 3W5D) (47). This structure of SERCA, a P2-ATPase, was chosen because of its predicted structural homology with the P4-ATPase family. Additionally, the 3W5D structure of SERCA was cocrystallized with an ordered PE near the analogous exit gate of Dnf1 (Fig. 3A, Inset). The coordination of PE at this position has been seen in several crystallography studies of SERCA and is proposed to be a conserved binding site involved in modulating Ca2+ transport (48, 49).
Fig. 3.
Predicted N220 positioning suggests that substrate backbone and acyl chains are coordinated by TM1 and TM3. (A) Homology model of Dnf1 (PDB ID code 3W5D) with TM 1–6 shown as pink cylinders, the rest of the protein colored green, surface shown, and key residues represented in stick form and colored by element. PE was modeled in the site as crystallized in 3W5D, shown in spheres and colored by element. PM boundaries are indicated. This orientation suggests that the PL headgroup is coordinated by TM2 and TM4, with the substrate backbone and acyl chains protruding between TM2, -4, and -6 (cartoon PL with red headgroup). (Inset) A 90° rotated and enlarged view of the PE site with TM2 removed for clarity. None of the TM2 or TM3 residues alter backbone preference, indicating that the substrate may be oriented in a 180° turn, with the headgroup still between TM2 and TM4 but with the backbone and acyl chains projecting past TM1 and TM3, respectively. (This proposal is illustrated by the cartoon PL and expanded upon with subsequent modeling in Fig. 4A.) (B) Exit gate substitutions F213S, T254A, D258E, and N550S increase PS preference over that of WT. (C) Exit gate substitutions F213S, T254A, D258E, and N550S do not recapitulate the SM preference of N220S. (D) PC, PS, and SM transport of exit gate mutants and N220S. n ≥ 9 ± SEM for all NBD transport data. Comparisons to WT ratio or substrate uptake were made with one-way ANOVA using Tukey’s post hoc analysis; **P < 0.01; ***P < 0.001; ****P < 0.0001.
In the Dnf1 homology model, PE was placed into the site at which it was bound in SERCA (47) with the side chains relaxed for energy minimization. The headgroup of PE in the Dnf1 (PDB ID code 3W5D) model is predicted to be in close proximity to previously identified exit gate residues F213, T254, D25, N550, and Y618 (38, 39) with N220 clustered nearby (Fig. 3A, Inset). The juxtaposition of N220 near the exit gate and its influence on NBD-PS transport led us to question whether N220 may have a primary influence on backbone specificity or a secondary influence through coordination of nearby exit gate residues, which in this model are proximal to the glycerol backbone. Exit gate substitutions that enhance PS recognition do not significantly increase NBD-SM preference (Fig. 3C) or selection (Fig. 3D), and substitutions at Y618 were previously shown not to select NBD-SM (36). These data led us to conclude that it is unlikely that N220S increases the preference for SM through a secondary influence on these exit gate residues. Conversely, a direct interaction of N220S with the sphingosine backbone would suggest that the PL substrate binds to the pocket in the opposite orientation relative to the PL bound in SERCA (see the legend of Fig. 3A).
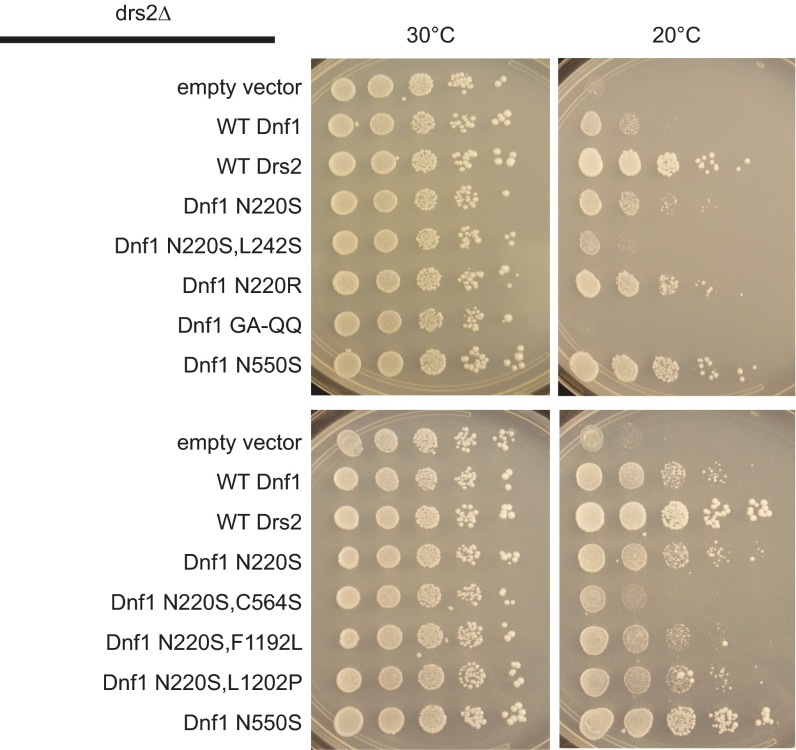
The predicted juxtaposition of N220 near N550, a residue responsible for acyl chain coordination (38), led us to question whether substrate backbone and acyl chain occupancy may be concomitantly coordinated. The Dnf1 enzyme is known to prefer lyso-PLs, PLs with one acyl chain in the sn1 position (38). Drs2 is a budding yeast flippase known to translocate dually acylated PS (50), which is important for secretory trafficking, and loss of DRS2 inhibits cell growth at low temperatures (10). A previous study demonstrated that Dnf1 mutants that translocate dually acylated PS (Dnf1N550S), but not those capable of transporting only lyso-PS (Dnf1GA-QQ), can suppress drs2∆ cold growth sensitivity (38). To test if N220 participates in acyl chain discrimination, we examined if N220 mutants that flip PS can support growth at 20 °C in a drs2∆ background (Fig. S5). Dnf1N550S suppressed the cold growth sensitivity of drs2∆ similarly to Drs2 (Fig. S5), in accordance with previous findings (38). Conversely, Dnf1N220S and Dnf1N220R weakly suppressed the growth defect (Fig. S5), suggesting a modest role for the N220 position in acyl chain discrimination.
Fig. S5.
Substitutions at the N220 position can partially suppress drs2Δ cold sensitivity, implying that this position cooperates with acyl-chain selection of substrate. Plasmids carrying Dnf1 or Drs2 were transformed into a drs2∆ genetic background and grown at 30 °C or 20 °C. drs2∆ cells have been shown to exhibit growth defects at 20 °C, which can be suppressed by expressing WT Drs2 or Dnf1N550S, a Dnf1 mutation that allows the translocation of diacyl-PS across the membrane. The Dnf1GA-QQ mutation is a gain-of-function substitution that allows lyso-PS transport, but not diacyl-PS, and is unable to suppress the drs2∆ growth inhibition. The Dnf1N220S and Dnf1N220R mutations can transport NBD-PS (Fig. 3) and are weakly capable of altering acyl-chain selection. The compound mutants Dnf1N220S,F1192L and Dnf1N220S,L1202P appear to suppress the cold sensitivity as does WT Dnf1. The figures presented are representative images taken from three independent transformants examined from three growth experiments.
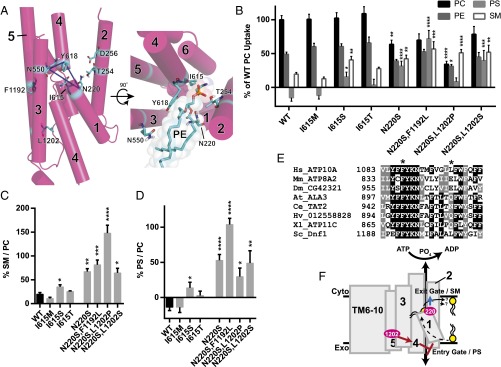
Recently, I364 has been shown to be critical for substrate transport in ATP8A2 (40), and an isoleucine-to-methionine substitution at this position elicits neurologic dysfunction in a family of human patients (31). Interestingly, the conserved Ile residue (I615 in yeast) is predicted to be positioned within the critical exit gate triad of N220, N550, and Y618 (Fig. 4A, blue dashed lines). We generated Dnf1I615M, Dnf1I615S, and Dnf1I615T mutations to examine whether this position may be a component of the Dnf1 substrate exit gate and if alterations in hydrogen bonding potential at this site may alter backbone discrimination. Surprisingly, Dnf1I615M and Dnf1I615T did not display a defect in transport activity or altered specificity (Fig. 4 B–D) (40); however, Dnf1I615S increased NBD-PS and NBD-SM selection and preference (Fig. 4 B–D) (40). The ability of an exit gate serine at position 615 to alter backbone selection underlines the importance of hydrogen bond networks in this region. These results confirm a conserved role for I615 in substrate transport but suggest nuanced differences between Dnf1 and ATP8A2.
Fig. 4.
N220 cooperates with L1202 of TM5 to increase SM selection and preference. (A) Homology model of Dnf1 (3W5D) with TM helices 1–6 shown as pink cylinders and numbered, with key residues represented in stick form and colored by element. Dashed blue lines illustrate the exit gate triad of N220, N550, and Y618; these residues participate in substrate backbone, acyl chain, and headgroup selection, respectively. The rotated view of the model reveals alternative orientation of PL substrate within the exit gate, consistent with the positioning of headgroup-selective, backbone-selective, and acyl chain-selective residues as indicated and shown in sticks. PE is shown in the model as sticks with shaded spheres to illustrate spacing and colored by element. (B) Comparisons of PC, PE, PS, and SM transport among I615M, I615S, I615T, and N220S compound alleles with preferences for SM (C) and PS (D). n ≥ 9 ± SEM for all data. Comparisons to WT ratio or substrate uptake were made with one-way ANOVA using Tukey’s post hoc analysis; *P < 0.05; **P < 0.01; ***P < 0.001; ****P < 0.0001. (E) An alignment of P4-ATPase sequences reveals conservation of F1192 but not L1202. (F) Cartoon schematic of TM-domain substrate transport indicating the putative secondary influence of L1202 for PS selection at the entry gate and the primary selective role of N220 for SM selection at the exit gate.
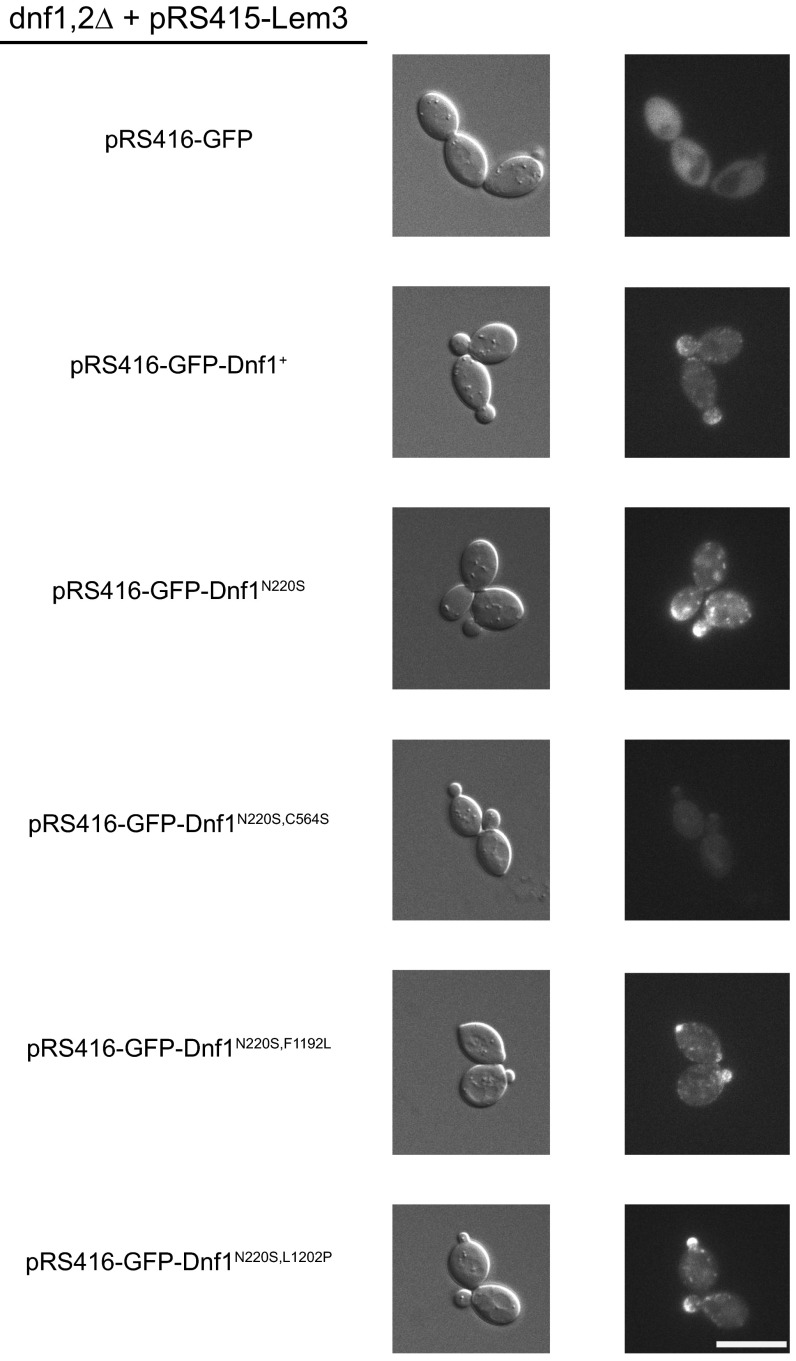
The initial SM+ screen identified single-residue substitutions in TM1, TM3, and TM5 (Fig. 1 C and D), and compound alleles were generated to test if this process would further refine SM specificity. Preliminary substrate uptake experiments in Dnf1N220S,C564S, Dnf1N220S,F1192L, Dnf1N220S,L1202P, and Dnf1N220S,L1202S demonstrated that all alleles except Dnf1N220S,C564S were functional. Expression analysis using GFP-tagged Dnf1 confirmed robust expression and PM localization for all mutants except Dnf1N220S,C564S, suggesting that this double mutant may cause misfolding (Fig. S6). Therefore, compound allele assessments were limited to TM1 and TM5 double mutants.
Fig. S6.
Expression and localization of SM+ Dnf1 mutations. N-terminal GFP-tagged Dnf1+, Dnf1N220S, Dnf1N220S,F1192L, and Dnf1N220S,L1202P all display robust PM localization and enrichment at the bud neck. GFP-Dnf1N220S,C564S does not exhibit robust expression or PM/bud neck localization. The representative images were selected from 10 acquisitions of 3 independent transformants. (Scale bar, 5 µm.)
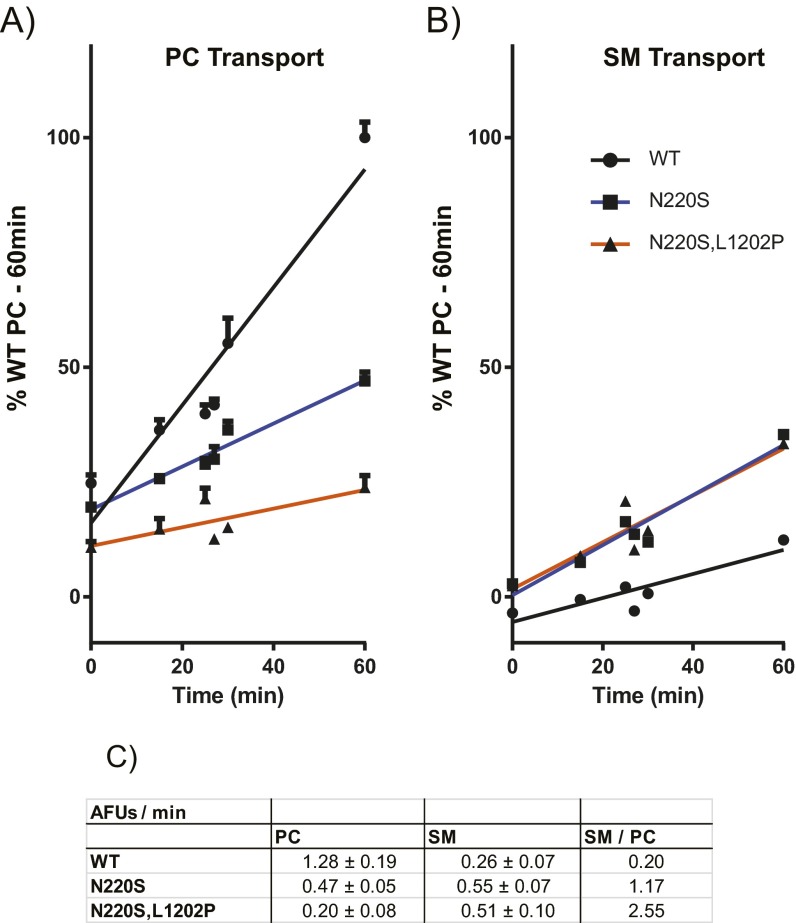
We measured substrate translocation in compound mutations Dnf1N220S,F1192L, Dnf1N220S,L1202P, and Dnf1N220S,L1202S to examine potential cooperation between these positions (Fig. 4B). Each of the mutants demonstrated robust preference and selection for NBD-SM (Fig. 4 B and C); however, the compound mutants differed dramatically in their coordination of the NBD-GPL substrates (Fig. 4 B and D). The Dnf1N220S,L1202P double mutant in particular showed refined preference for SM over GPL substrates, reducing NBD-PC and NBD-PE relative to WT (Fig. 4B). Dnf1N220S,L1202P also exhibited a 10-fold increase in preference for (Fig. 4C) and a twofold increase in transport kinetics of NBD-SM relative to NBD-PC (Fig. S7) while mitigating the NBD-PS transport previously seen in the Dnf1N220S single mutant (Fig. 4 B and D). The restriction of GPL substrates NBD-PC, NBD-PE, and NBD-PS was not shared by Dnf1N220S,L1202S, indicating that these effects are likely specific to the proline at position 1202. Alignments of diverse P4-ATPases highlight an identical conservation of N220 and F1192 with little conservation of L1202 (Fig. 4E and Fig. S4), but no P4-ATPases were found to use a proline in this position.
Fig. S7.
The compound mutant Dnf1N220S,L1202P increases the specificity of SM transport. (A and B) A time course of NBD-PC (A) and NBD-SM (B) uptake in Dnf1WT, Dnf1N220S, and Dnf1N220S,L1202P. Time points were taken at 0 min (n = 9), 15 min (n = 9), 25 min (n = 3), 27 min (n = 3), 30 min (n = 3), and 60 min (n = 9) ± SEM. Error bars indicate SEM. (C) A table presenting the slope of the linear regression fits in A and B, demonstrating that Dnf1N220S and Dnf1N220S,L1202P have reduced rates of NBD-PC uptake and increased rates of NBD-SM uptake relative to Dnf1WT.
Discussion
Over the last three decades a host of work has examined the substrate specificity and biological significance of many members of the P4-ATPase family, but the molecular mechanism of substrate translocation is still largely unclear (51). The current study used an unbiased mutagenesis strategy to elucidate a primary structural regulator of substrate backbone selection. The screen was designed using two nearly identical substrates, one with a glycerol backbone (NBD-PC) and one with a sphingosine backbone (NBD-SM). FACS was used to isolate cell populations that robustly translocated NBD-SM, and SM+ clones were isolated and retransformed into a naive genetic background (Fig. 1 and Fig. S1). Validation studies affirmed that several Dnf1 mutants conveyed an increase in NBD-SM uptake and preference (Fig. 1).
The mutant that demonstrated the greatest preference for NBD-SM had N220S and L242S substitutions. We generated single-point-mutation alleles and found that the ability to recognize and translocate NBD-SM was largely conveyed by the N220S substitution. Alternative coding substitutions at this position revealed a tremendous degree of physical and chemical specificity for recognition of the sphingosine or glycerol backbone. Among these substitutions, a hydroxyl group at the 220 position was the greatest determinant of SM transport, but a serine provided greater preference for SM compared with a threonine, suggesting that the precise positioning of the hydroxyl is crucial. A cysteine at position 220 was unable to recapitulate the SM selection, although it did decrease PC uptake (Fig. 2). The chemical differences between the glycerol and sphingosine backbones suggest that hydrogen bonding may be the key to discriminating these two substrates. The glycerol backbone is composed of a series of ester bonds capable of accepting hydrogen bonds. Conversely, the sphingosine backbone is characterized by a hydroxyl along its long-chain base and an amide linkage to its fatty-chain moiety, each functioning as hydrogen bond donors and acceptors. These observations led us to speculate that the hydrogen bonds formed by the serine hydroxyl are key to the direct selection of the sphingosine backbone. However, an additional hydrogen bond would provide a modest energetic contribution to the recognition of the new substrate, and it is equally possible that N220S indirectly influences substrate recognition by altering the positions of the surrounding residues.
Modeling the Dnf1 enzyme onto the P2-ATPase SERCA suggested that N220 clustered with several previously identified residues involved in substrate headgroup discrimination (36, 38, 39). Further, N220 mutations demonstrated the ability to alter headgroup as well as backbone selection. This result raised the possibility that N220S may exert its influence through these previously identified exit gate components. Dnf1F213S, Dnf1T254A, Dnf1D258E, and Dnf1N550S mutants were examined and found to have a minor influence on SM transport, suggesting that N220 is the primary determinant of GPL specificity (Fig. 3). Hydrophilic substitutions were also made at I615, a proximal residue within the Dnf1 exit gate and a position that is analogous to the ATP8A2I364 mutation known to elicit neurologic disease (31). Although we were unable to recapitulate the catalytic loss of function previously reported in ATP8A2, we noted that I615S significantly increased NBD-SM transport. To date, SM translocation by ATP8A2I364 mutants has not been examined. It would be interesting if the disease-relevant isoleucine-to-methionine substitution alters GPL versus SL preferences in the context of ATP8A2, because changes in SL distribution and metabolism have been shown to significantly impair neural function (52, 53).
One prevailing observation throughout the study was an increase in NBD-PS translocation by Dnf1N220S (Figs. 2D, 3D, and 4B). One interpretation is that we simply have deformed the binding site so that all substrates are transported nonspecifically; however, the reduced PC transport and nonexistent PA transport suggest this NBD-PS translocation is specific. An alternative interpretation is that the conserved N220 is critical for selecting the backbone and orienting the PL headgroup for selection by other residues that restrict PS transport. This restricted-orientation hypothesis is supported by increased NBD-PS transport with nearly every N220 substitution we examined (Fig. 2D). Further, the weak genetic suppression of drs2∆ cold sensitivity suggests that N220S permits a small amount of dually acylated PS transport (Fig. S5), a possibility consistent with a restricted-access model of substrate selection.
Defining the mechanism of backbone discrimination should allow the design of substrate-specific enzymes, and a secondary goal of this study was to generate new technologies for the modulation of SL asymmetry. Compound alleles were generated using the single-position substitutions initially identified, revealing a double mutant (Dnf1N220S,L1202P) that was capable of restricting GPL transport while permitting SM transport (Fig. 4). Curiously, a proline substitution near the exofacial aspect of TM5 was responsible for restricting PC and PE transport while also mitigating the PS transport conveyed by N220S. The Dnf1N220S,L1202P mutant did not increase the rate of NBD-SM transport relative to Dnf1N220S (Fig. S7) but increased its specificity for the substrate. We determined that Dnf1N220S,L1202S was unable to recapitulate the specificity of Dnf1N220S,L1202P; therefore we speculate that the inclusion of a proline at this position kinks TM5, thereby impacting either (i) the packing around the entry gate or (ii) the pumping of the nearby TM4 through an as yet unclear mechanism. These data imply that L1202P is not a primary mechanism of backbone discrimination but is capable of modulating substrate transport. These assertions are consistent with previous observations of a neighboring lysine on TM5 of ATP8A2 (41).
Our mutational analyses and homology models of Dnf1 and Drs2 suggest that the substrate exit gate is composed of several proximal hydrophilic residues including N220, T254, D258, N550, and Y618. Given the predicted peri-cytosolic positioning of these residues, it is likely that they operate within an ordered hydrogen bond network similar to the C terminus of the Na+,K+-ATPase (P2-ATPase), which coordinates the third Na+ ion (54, 55). This idea is consistent with molecular dynamic simulations of ATP8A2 homology models that suggest the presence of a water network in this region (40). However, controversy still exists regarding the orientation of the PL substrate and its pathway through the membrane.
We believe that our constellation of substrate-discriminatory residues suggests that, during recognition at the exit gate, TM1 N220 coordinates substrate backbone, which orients the PL headgroup toward TM2 and TM4 with the acyl chains directed toward TM3 (Fig. 4A, Inset). This orientation is different from that suggested by SERCA crystal structures with PE (Fig. 3A, Inset) but is supported by a cluster of TM2 and TM4 residues that have been demonstrated primarily to alter headgroup selection and a TM3 residue that strongly influences acyl chain recognition. This head-to-tail orientation suggests that with the strong influence of N550 on discriminating lyso-PL from diacyl-PL, the acyl chains likely protrude past TM3 and into the hydrophobic bilayer (Fig. 4A, Inset). We suggest that an “asparagine clamp,” formed by N220 and N550, positions the glycerol backbone and acyl chains in the appropriate restricted orientation for substrate selection. Although this hypothesis is based on substrate transport data and not on binding or crystallography experiments, our data and interpretations are compatible with previous yeast and mammalian computational simulations and molecular studies (37, 40, 41).
Directional substrate transport to the cytofacial exit gate through the membrane bilayer would require regulated binding at this site. Extensive structural analyses of P2-ATPases have revealed dramatic vertical movements of TMs 1, 2, and 4 as a function of ATP hydrolysis (56). The formation of a substrate-selective pocket within these segments suggests that classical P-type ATPase pumping of these helices may work in conjunction with a hydrophobic barrier to direct the regulation of the exit gate (40).
In conclusion, our forward gain-of-function genetic approach has identified a single-residue substitution with the ability to convert a GPL flippase into one that will translocate an SL. These findings in combination with structural modeling have refined our understanding of how these enzymes achieve substrate selection. Further, we have produced a compound allele of Dnf1 that achieves unparalleled specificity for SM transport. We predict these observations and new technologies will be critical to understanding the influence of asymmetry on cellular membrane biology.
Materials and Methods
Reagents.
All reagents were purchased from Sigma Aldrich unless otherwise noted. NBD-PLs were purchased from Avanti Polar Lipids.
Strains and Culture.
Plasmids and strains used in this study are listed in Tables S1 and S2, respectively. Strains were maintained with glucose on standard rich medium (yeast extract, peptone, dextrose; YPD) or synthetic minimal medium (SD). All strains were cultured at 30 °C unless otherwise specified. Yeast transformations were performed using the lithium acetate method.
Table S1.
Plasmids used in this study
| Plasmid | Notes | Source |
| pRS313 | (60) | |
| pRS313-Dnf1 | (15) | |
| pRS313-Dnf1 I228T, D258E, T226A | Present study | |
| pRS313-Dnf1 L242S | Present study | |
| pRS313-Dnf1 D1246G, I1260V | Present study | |
| pRS313-Dnf1 Y1221F | Present study | |
| pRS313-Dnf1 F1192L | Present study | |
| pRS313-Dnf1 Y585F, V600F, V613F | Present study | |
| pRS313-Dnf1 C564S | Present study | |
| pRS313-Dnf1 F602L,Y618F | Present study | |
| pRS313-Dnf1 L1202P | Present study | |
| pRS313-Dnf1 K276D | Present study | |
| pRS313-Dnf1 N220S, L242S | Present study | |
| pRS313-Dnf1 V573A, A594P, F599I | Present study | |
| pRS313-Dnf1 D576G, I623V, I654F | Present study | |
| pRS313-Dnf1 L1202P | Present study | |
| pRS313-Dnf1 A1201V, L1202S | Present study | |
| pRS313-Dnf1 C564S | Present study | |
| pRS313-Dnf1 E166G, S263T | Present study | |
| pRS313-Dnf1 F1192L | Present study | |
| pRS313-Dnf1 V221I | Present study | |
| pRS313-Dnf1 H216R, N217D | Present study | |
| pRS313-Dnf1 L1202S | Present study | |
| pRS313-Dnf1 YIS-FVT | Dnf1 Y618F, I619V, S620T | (36) |
| pRS313-Dnf1 I654S | Present study | |
| pRS313-Dnf1 S567A | Present study | |
| pRS313-Dnf1 N220S | Present study | |
| pRS313-Dnf1 L242S | Present study | |
| pRS313-Dnf1 N220C | Present study | |
| pRS313-Dnf1 N220D | Present study | |
| pRS313-Dnf1 N220M | Present study | |
| pRS313-Dnf1 N220Q | Present study | |
| pRS313-Dnf1 N220R | Present study | |
| pRS313-Dnf1 N220S | Present study | |
| pRS313-Dnf1 N220T | Present study | |
| pRS313-Dnf1 F213S | (38) | |
| pRS313-Dnf1 T254A | (38) | |
| pRS313-Dnf1 D258E | (38) | |
| pRS313-Dnf1 GA-QQ | Dnf1 G230Q,A231Q | (39) |
| pRS313-Dnf1 N550S | (39) | |
| pRS313-Drs2 | (50) | |
| pRS313-Dnf1 N220S, L1202P | Present study | |
| pRS313-Dnf1 N220S, F1192L | Present study | |
| pRS313-Dnf1 N220S, L1202S | Present study | |
| pRS313-Dnf1 I615M | Present study | |
| pRS313-Dnf1 I615S | Present study | |
| pRS313-Dnf1 I615T | Present study | |
| pRS415-Lem3 | Beta subunit of Dnf1 | Present study |
| pRS416-GFP | Soluble GFP | (39) |
| pRS416-GFP-Dnf1 | N-terminal GFP fusion | (39) |
| pRS416-GFP-Dnf1 N220S | Present study | |
| pRS416-GFP-Dnf1 N220S, C564S | Present study | |
| pRS416-GFP-Dnf1 N220S, F1192L | Present study | |
| pRS416-GFP-Dnf1 N220S, L1202P | Present study |
Table S2.
Strains used in this study
| Strain | Genotype | Plasmid | Source |
| PFY3275F | MATa his3Δ1 leu2Δ0 ura3Δ0 met15Δ0 dnf1Δ dnf2Δ | None | (12) |
| ZHY615M2D | MATα his3Δ1 leu2Δ0 ura3Δ0 lys2Δ0 drs2Δ | None | (12) |
| ZHY704 | MATα his3Δ1 leu2Δ0 ura3Δ0 lys2Δ0 dnf1Δ dnf2Δ dnf3Δ drs2Δ::LEU2 pRS416-DRS2 | pRS416-DRS2 | (12) |
| BRY1400 | PFY3275F | pRS415-Lem3 | Present study |
| BRY11 pRS313 | PFY3275F | pRS313 | Present study |
| BRY11 Dnf1 | PFY3275F | pRS313-Dnf1 | Present study |
| BRY1103 | PFY3275F | pRS313-Dnf1 I228T, D258E, T226A | Present study |
| BRY1101 | PFY3275F | pRS313-Dnf1 L242S | Present study |
| BRY1144 | PFY3275F | pRS313-Dnf1 D1246G, I1260V | Present study |
| BRY1143 | PFY3275F | pRS313-Dnf1 Y1221F | Present study |
| BRY1132 | PFY3275F | pRS313-Dnf1 F1192L | Present study |
| BRY1130 | PFY3275F | pRS313-Dnf1 Y585F, V600F, V613F | Present study |
| BRY1126 | PFY3275F | pRS313-Dnf1 C564S | Present study |
| BRY1125 | PFY3275F | pRS313-Dnf1 F602L, Y618F | Present study |
| BRY1140 | PFY3275F | pRS313-Dnf1 L1202P | Present study |
| BRY1105 | PFY3275F | pRS313-Dnf1 K276D | Present study |
| BRY1104 | PFY3275F | pRS313-Dnf1 N220S, L242S | Present study |
| BRY1124 | PFY3275F | pRS313-Dnf1 V573A, A594P, F599I | Present study |
| BRY1123 | PFY3275F | pRS313-Dnf1 D576G, I623V, I654F | Present study |
| BRY1142 | PFY3275F | pRS313-Dnf1 L1202P | Present study |
| BRY1141 | PFY3275F | pRS313-Dnf1 A1201V, L1202S | Present study |
| BRY1114 | PFY3275F | pRS313-Dnf1 C564S | Present study |
| BRY1109 | PFY3275F | pRS313-Dnf1 E166G, S263T | Present study |
| BRY1133 | PFY3275F | pRS313-Dnf1 F1192L | Present study |
| BRY1106 | PFY3275F | pRS313-Dnf1 V221I | Present study |
| BRY1108 | PFY3275F | pRS313-Dnf1 H216R, N217D | Present study |
| BRY1145 | PFY3275F | pRS313-Dnf1 L1202S | Present study |
| BRY1128 | PFY3275F | pRS313-Dnf1 I654S | Present study |
| BRY1129 | PFY3275F | pRS313-Dnf1 S567A | Present study |
| BRY11YISFVT | PFY3275F | pRS313-Dnf1 YIS-FVT | Present study |
| BRY1104.0 G | PFY3275F | pRS313 | Present study |
| BRY1104.1 G | PFY3275F | pRS313-Dnf1 | Present study |
| BRY1104.2 G | PFY3275F | pRS313-Dnf1 N220C | Present study |
| BRY1104.3 G | PFY3275F | pRS313-Dnf1 N220D | Present study |
| BRY1104.5 G | PFY3275F | pRS313-Dnf1 N220M | Present study |
| BRY1104.6 G | PFY3275F | pRS313-Dnf1 N220Q | Present study |
| BRY1104.7 G | PFY3275F | pRS313-Dnf1 N220R | Present study |
| BRY1104.8 G | PFY3275F | pRS313-Dnf1 N220S | Present study |
| BRY1104.9 G | PFY3275F | pRS313-Dnf1 N220T | Present study |
| BRY11F213S | PFY3275F | pRS313-Dnf1 F213S | Present study |
| BRY11T254A | PFY3275F | pRS313-Dnf1 T254A | Present study |
| BRY11D258E | PFY3275F | pRS313-Dnf1 D258E | Present study |
| BRY11N550S | PFY3275F | pRS313-Dnf1 N550S | Present study |
| BRY1200 | ZHY615M2D | pRS313 | Present study |
| BRY1201 | ZHY615M2D | pRS313-Dnf1 | Present study |
| BRY1202 | ZHY615M2D | pRS313-Drs2 | Present study |
| BRY1204 | ZHY615M2D | pRS313-Dnf1 N220S, L242S | Present study |
| BRY1204.7 | ZHY615M2D | pRS313-Dnf1 N220R | Present study |
| BRY1204.8 | ZHY615M2D | pRS313-Dnf1 N220S | Present study |
| BRY12GAQQ | ZHY615M2D | pRS313-Dnf1 GA-QQ | Present study |
| BRY12N550S | ZHY615M2D | pRS313-Dnf1 N550S | Present study |
| BRY1204.8.14 | ZHY615M2D | pRS313-Dnf1 N220S, C564S | Present study |
| BRY1204.8.32 | ZHY615M2D | pRS313-Dnf1 N220S, F1192L | Present study |
| BRY1204.8.40 | ZHY615M2D | pRS313-Dnf1 N220S, L1202P | Present study |
| BRY1404.0 | BRY1400 | pRS416-GFP | Present study |
| BRY1404.1 | BRY1400 | pRS416-GFP-Dnf1 | Present study |
| BRY1404.8 | BRY1400 | pRS416-GFP-Dnf1 N220S | Present study |
| BRY1404.8.14 | BRY1400 | pRS416-GFP-Dnf1 N220S, C564S | Present study |
| BRY1404.8.32 | BRY1400 | pRS416-GFP-Dnf1 N220S, F1192L | Present study |
| BRY1404.8.40 | BRY1400 | pRS416-GFP-Dnf1 N220S, L1202P | Present study |
| BRY1104.1 D | PFY3275F | pRS313-Dnf1 L1202P | Present study |
| BRY1104.8 D | PFY3275F | pRS313-Dnf1 N220S, L1202P | Present study |
| BRY1104.8.32 | PFY3275F | pRS313-Dnf1 N220S, F1192L | Present study |
| BRY1104.8.45 | PFY3275F | pRS313-Dnf1 N220S, L1202S | Present study |
| BRY11I615M | PFY3275F | pRS313-Dnf1 I615M | Present study |
| BRY11I615S | PFY3275F | pRS313-Dnf1 I615S | Present study |
| BRY11I615T | PFY3275F | pRS313-Dnf1 I615T | Present study |
Mutagenesis and Molecular Cloning.
The Dnf1 mutagenesis library was generated through error-prone PCR as described previously (38, 39). SM+ validation involved extraction of pRS313-Dnf1SM+ alleles from clonal lines (see Flow Cytometry, below) via zymolase treatment and plasmid DNA purification (Promega). Novel mutations were introduced using Q5 Site-Directed Mutagenesis (New England Biolabs). Compound alleles were generated by combining coding substitutions using Gibson Assemblies (New England Biolabs).
NBD-PL Administration.
NBD-PL uptake was performed as described previously (36, 39). Briefly, overnight cultures were subcultured to 0.15 OD600/mL and cultured to midlog phase; then 500 µL of cells were pelleted per sample. The desired NBD-PL was solubilized in 100% ethanol and added to ice-cold SD medium at a final concentration of 2 µg/mL; final ethanol volumes were ≤0.5%. Cells were resuspended with SD + NBD-PL and incubated on ice for 30 min (unless otherwise stated). Cells were washed twice with ice-cold SA medium [SD + 2% (wt/vol) sorbitol + 20 mM NaN3] supplemented with 4% (wt/vol) fatty acid-free BSA, washed once with SA medium, resuspended in SA medium + 5 µM propidium iodide, and sorted or analyzed immediately. The sequence of substrate administration and sample processing was varied in each experiment to mitigate potential positional bias.
Flow Cytometry.
Sorting experiments were performed using a BD FACSAria III (BD Biosciences) running FACSDiva 6.1.3. Forward and side scatter were used to isolate single-cell populations, propidium iodide was used to exclude dead cells, and NBD-SM uptake was measured using the FITC filter set (a 530/30 band-pass filter with a 525 long-pass filter). Roughly 20,000 cells were sorted per run, and the top 1–2% were collected in SD medium + 50 µg/mL ampicillin (AMP) and were cultured. Primary sorted populations were grown to midlog phase, administered NBD-SM as described above, and resorted a second time. Secondary sorted populations were collected again in SD medium + AMP, serial diluted in SD medium + AMP, and plated. Ninety-six colonies were selected for validation. Analytical flow cytometry was performed using a three-laser BD LSRII (BD Biosciences) running FACSDiva 6.1.3. NBD-PL fluorescence was measured as outlined above. At least 10,000 events were measured per replicate.
Data Analysis.
For all flow cytometry experiments, at least three independent transformants were collected per genotype and were assessed in parallel. dnf1,2∆ cells transformed with vector (evS) were subtracted from each value to remove background. Substrate transport (xS) is reported relative to WT uptake of NBD-PC (wtPC):
Experiments were performed at least three times, and the median fluorescence reading from each sample was averaged and reported. Substrate preference was determined by taking ratios from clonal replicates.
SI Materials and Methods
Reagents.
Sonicated salmon sperm DNA was purchased from Agilent Technologies. All lipids were purchased from Avanti Polar Lipids: C-6 NBD SM (#810218); 14:0-6:0 NBD PC (#810122); 16:0-6:0 NBD PC (#810130); 16:0-6:0 NBD PA (#810173); 16:0-6:0 NBD PE (#810153); 16:0-6:0 NBD PS (#810192); and NBD lyso-SM (#810203).
Sequence Alignments.
Sequence alignments were performed using the ClustalW method (www.genome.jp/tools/clustalw/), with conservation illustrated using BoxShade (www.ch.embnet.org/software/BOX_form.html). Alignments include the following sequences (National Center for Biotechnology Information accession numbers are given in parentheses): Hs_ATP8A1 (gi 80478388), Hs_ATP8A2 (gi 30316390), Hs_ATP8B1 (gi 119583458), Hs_ATP8B2 (gi 119573590), Hs_ATP8B3 (gi 119589865), Hs_ATP8B4 (gi 50083277), Hs_ATP9B (gi 115528760), Hs_ATP10A (gi 14424433), Hs_ATP10B (gi 149944474), Hs_ATP10D (gi 124297480), Hs_ATP11A (gi 85700404), Hs_ATP11B (gi 62632750), Mm_ATP8A2 (gi 8134327), Mm_ATP8B5 (gi 190359612), Xl_ATP11C (gi 148222613), Hv_012558828 (gi 828211953), Dm_CG42321 (gi 220902204), Sc_Dnf1 (gi 398365037), Sc_Dnf2 (gi 6320298), Sc_Dnf3 (gi 6323814), Sc_Drs2 (gi 330443374), Sc_Neo1 (gi 584476169), At_ALA3 (gi 15218927), At_ALA5 (gi 15218567), At_ALA7 (gi 240255342), At_ALA8 (gi 334185669), At_ALA9 (gi 15221488), Ce_TAT1 (gi 257145809), Ce_TAT2 (gi 548932312), Ce_TAT3 (gi 211970509), Ce_TAT4 (gi 351058655), Ce_TAT5 (gi 82658176), Ce_TAT6 (gi 351059015).
Homology Modeling.
Homology models were generated using the base sequence and structure of the Ca2+-ATPase (PDB ID code 3W5D) (47). Alignments of 3W5D and Dnf1 (see Sequence Alignments, above, for accession numbers) were generated using Clustal Omega (www.ebi.ac.uk/Tools/msa/clustalo/) and were threaded over 3W5D using Phyre2 (57). PE was initially docked into the site analogous to the site of its original crystallization in 3W5D using MOE (Molecular Operating Environment; Chemical Computing Group), followed by side-chain energy minimization (Fig. 3). The alternative PE position presented in Fig. 4 was generated with the original Phyre2 Dnf1 (3W5D) model using MOE’s LigX functionality followed by a tethered minimization to find a low-energy conformation of PE proximal to our key trio of exit gate residues (N220, N550, and Y618). The structural models have been deposited at csb.vanderbilt.edu/research/grahamlab/rolandPNAS2016_model.html.
Fluorescence Microscopy.
BRY1400 cells were transformed with N-terminal GFP-tagged Dnf1 alleles with three independent clones selected for analysis. Cells were cultured to midlog growth, pelleted at 5,000 rpm for 5 min, washed and resuspended in growth medium, distributed on slides, and immediately imaged. Images were acquired using a Zeiss Axioplan epifluorescent scope using an X-Cite Series 120Q lamp (Lumen Dynamics) and fitted with a GFP filter set and a Zyla sCMOS (Andor Technology) camera. Images were acquired using Micro-Manager 1.4.15 (Andor Technology) software, and postacquisition processing was performed using ImageJ (National Institutes of Health) and Adobe Photoshop. Representative images were selected and processed in accordance with published guidelines (58).
Data Analysis.
All statistical analyses were performed using GraphPad Prism 6. A one-way ANOVA was run to assess variance in all datasets, and Tukey’s post hoc analysis was used for comparisons. Linear regression fits were used to assess rates of substrate uptake in Fig. S7.
Acknowledgments
We thank Lauren P. Jackson, Hannah M. Hankins, and Ryan D. Baldridge for helpful discussions; and Jonathan Sheehan and Jens Meiler of the Vanderbilt University Center for Structural Biology for assistance with the structural modeling. Flow cytometry experiments were performed in the Vanderbilt Medical Center (VMC) Flow Cytometry Shared Resource. The VMC Flow Cytometry Shared Resource is supported by National Institutes of Health grants to the Vanderbilt Ingram Cancer Center (P30-CA68485) and the Vanderbilt Digestive Disease Research Center (P30-DK058404). This work was supported by the National Institutes of Health Grants R01-GM107978 (to T.R.G.), T32-MH065215 (to B.P.R.), and F32-GM116310 (to B.P.R.).
Footnotes
The authors declare no conflict of interest.
This article is a PNAS Direct Submission.
Data deposition: The structural models described in this article have been deposited with the Vanderbilt University Center for Structural Biology, csb.vanderbilt.edu/research/grahamlab/rolandPNAS2016_model.html.
This article contains supporting information online at www.pnas.org/lookup/suppl/doi:10.1073/pnas.1525730113/-/DCSupplemental.
References
- 1.Vance DE, Vance JE. Biochemistry of Lipids, Lipoproteins and Membranes. 5th Ed Elsevier; Amsterdam: 2008. [Google Scholar]
- 2.van Meer G, Voelker DR, Feigenson GW. Membrane lipids: Where they are and how they behave. Nat Rev Mol Cell Biol. 2008;9(2):112–124. doi: 10.1038/nrm2330. [DOI] [PMC free article] [PubMed] [Google Scholar]
- 3.Devaux PF, Herrmann A. Transmembrane Dynamics of Lipids. Wiley; Hoboken, NJ: 2012. [Google Scholar]
- 4.Fairn GD, et al. High-resolution mapping reveals topologically distinct cellular pools of phosphatidylserine. J Cell Biol. 2011;194(2):257–275. doi: 10.1083/jcb.201012028. [DOI] [PMC free article] [PubMed] [Google Scholar]
- 5.Seigneuret M, Devaux PF. ATP-dependent asymmetric distribution of spin-labeled phospholipids in the erythrocyte membrane: Relation to shape changes. Proc Natl Acad Sci USA. 1984;81(12):3751–3755. doi: 10.1073/pnas.81.12.3751. [DOI] [PMC free article] [PubMed] [Google Scholar]
- 6.Xu P, Baldridge RD, Chi RJ, Burd CG, Graham TR. Phosphatidylserine flipping enhances membrane curvature and negative charge required for vesicular transport. J Cell Biol. 2013;202(6):875–886. doi: 10.1083/jcb.201305094. [DOI] [PMC free article] [PubMed] [Google Scholar]
- 7.Sheetz MP, Singer SJ. Biological membranes as bilayer couples. A molecular mechanism of drug-erythrocyte interactions. Proc Natl Acad Sci USA. 1974;71(11):4457–4461. doi: 10.1073/pnas.71.11.4457. [DOI] [PMC free article] [PubMed] [Google Scholar]
- 8.Daleke DL, Huestis WH. Incorporation and translocation of aminophospholipids in human erythrocytes. Biochemistry. 1985;24(20):5406–5416. doi: 10.1021/bi00341a019. [DOI] [PubMed] [Google Scholar]
- 9.Chen B, et al. Endocytic sorting and recycling require membrane phosphatidylserine asymmetry maintained by TAT-1/CHAT-1. PLoS Genet. 2010;6(12):e1001235. doi: 10.1371/journal.pgen.1001235. [DOI] [PMC free article] [PubMed] [Google Scholar]
- 10.Chen CY, Ingram MF, Rosal PH, Graham TR. Role for Drs2p, a P-type ATPase and potential aminophospholipid translocase, in yeast late Golgi function. J Cell Biol. 1999;147(6):1223–1236. doi: 10.1083/jcb.147.6.1223. [DOI] [PMC free article] [PubMed] [Google Scholar]
- 11.Gall WE, et al. Drs2p-dependent formation of exocytic clathrin-coated vesicles in vivo. Curr Biol. 2002;12(18):1623–1627. doi: 10.1016/s0960-9822(02)01148-x. [DOI] [PubMed] [Google Scholar]
- 12.Hua Z, Fatheddin P, Graham TR. An essential subfamily of Drs2p-related P-type ATPases is required for protein trafficking between Golgi complex and endosomal/vacuolar system. Mol Biol Cell. 2002;13(9):3162–3177. doi: 10.1091/mbc.E02-03-0172. [DOI] [PMC free article] [PubMed] [Google Scholar]
- 13.Hua Z, Graham TR. Requirement for neo1p in retrograde transport from the Golgi complex to the endoplasmic reticulum. Mol Biol Cell. 2003;14(12):4971–4983. doi: 10.1091/mbc.E03-07-0463. [DOI] [PMC free article] [PubMed] [Google Scholar]
- 14.Graham TR. Flippases and vesicle-mediated protein transport. Trends Cell Biol. 2004;14(12):670–677. doi: 10.1016/j.tcb.2004.10.008. [DOI] [PubMed] [Google Scholar]
- 15.Liu K, Hua Z, Nepute JA, Graham TR. Yeast P4-ATPases Drs2p and Dnf1p are essential cargos of the NPFXD/Sla1p endocytic pathway. Mol Biol Cell. 2007;18(2):487–500. doi: 10.1091/mbc.E06-07-0592. [DOI] [PMC free article] [PubMed] [Google Scholar]
- 16.Liu K, Surendhran K, Nothwehr SF, Graham TR. P4-ATPase requirement for AP-1/clathrin function in protein transport from the trans-Golgi network and early endosomes. Mol Biol Cell. 2008;19(8):3526–3535. doi: 10.1091/mbc.E08-01-0025. [DOI] [PMC free article] [PubMed] [Google Scholar]
- 17.Das A, et al. Flippase-mediated phospholipid asymmetry promotes fast Cdc42 recycling in dynamic maintenance of cell polarity. Nat Cell Biol. 2012;14(3):304–310. doi: 10.1038/ncb2444. [DOI] [PMC free article] [PubMed] [Google Scholar]
- 18.Sprong H, van der Sluijs P, van Meer G. How proteins move lipids and lipids move proteins. Nat Rev Mol Cell Biol. 2001;2(7):504–513. doi: 10.1038/35080071. [DOI] [PubMed] [Google Scholar]
- 19.Bevers EM, Comfurius P, Zwaal RF. Changes in membrane phospholipid distribution during platelet activation. Biochim Biophys Acta. 1983;736(1):57–66. doi: 10.1016/0005-2736(83)90169-4. [DOI] [PubMed] [Google Scholar]
- 20.Krahling S, Callahan MK, Williamson P, Schlegel RA. Exposure of phosphatidylserine is a general feature in the phagocytosis of apoptotic lymphocytes by macrophages. Cell Death Differ. 1999;6(2):183–189. doi: 10.1038/sj.cdd.4400473. [DOI] [PubMed] [Google Scholar]
- 21.Palmgren MG, Axelsen KB. Evolution of P-type ATPases. Biochim Biophys Acta. 1998;1365(1-2):37–45. doi: 10.1016/s0005-2728(98)00041-3. [DOI] [PubMed] [Google Scholar]
- 22.Axelsen KB, Palmgren MG. Evolution of substrate specificities in the P-type ATPase superfamily. J Mol Evol. 1998;46(1):84–101. doi: 10.1007/pl00006286. [DOI] [PubMed] [Google Scholar]
- 23.Bull LN, et al. A gene encoding a P-type ATPase mutated in two forms of hereditary cholestasis. Nat Genet. 1998;18(3):219–224. doi: 10.1038/ng0398-219. [DOI] [PubMed] [Google Scholar]
- 24.Verhulst PM, et al. A flippase-independent function of ATP8B1, the protein affected in familial intrahepatic cholestasis type 1, is required for apical protein expression and microvillus formation in polarized epithelial cells. Hepatology. 2010;51(6):2049–2060. doi: 10.1002/hep.23586. [DOI] [PubMed] [Google Scholar]
- 25.Siggs OM, Schnabl B, Webb B, Beutler B. X-linked cholestasis in mouse due to mutations of the P4-ATPase ATP11C. Proc Natl Acad Sci USA. 2011;108(19):7890–7895. doi: 10.1073/pnas.1104631108. [DOI] [PMC free article] [PubMed] [Google Scholar]
- 26.Siggs OM, et al. The P4-type ATPase ATP11C is essential for B lymphopoiesis in adult bone marrow. Nat Immunol. 2011;12(5):434–440. doi: 10.1038/ni.2012. [DOI] [PMC free article] [PubMed] [Google Scholar]
- 27.Yabas M, et al. ATP11C is critical for the internalization of phosphatidylserine and differentiation of B lymphocytes. Nat Immunol. 2011;12(5):441–449. doi: 10.1038/ni.2011. [DOI] [PMC free article] [PubMed] [Google Scholar]
- 28.Yabas M, et al. Mice deficient in the putative phospholipid flippase ATP11C exhibit altered erythrocyte shape, anemia, and reduced erythrocyte life span. J Biol Chem. 2014;289(28):19531–19537. doi: 10.1074/jbc.C114.570267. [DOI] [PMC free article] [PubMed] [Google Scholar]
- 29.Stapelbroek JM, et al. ATP8B1 is essential for maintaining normal hearing. Proc Natl Acad Sci USA. 2009;106(24):9709–9714. doi: 10.1073/pnas.0807919106. [DOI] [PMC free article] [PubMed] [Google Scholar]
- 30.Zhu X, et al. Mutations in a P-type ATPase gene cause axonal degeneration. PLoS Genet. 2012;8(8):e1002853. doi: 10.1371/journal.pgen.1002853. [DOI] [PMC free article] [PubMed] [Google Scholar]
- 31.Onat OE, et al. Missense mutation in the ATPase, aminophospholipid transporter protein ATP8A2 is associated with cerebellar atrophy and quadrupedal locomotion. Eur J Hum Genet. 2013;21(3):281–285. doi: 10.1038/ejhg.2012.170. [DOI] [PMC free article] [PubMed] [Google Scholar]
- 32.Cacciagli P, et al. Disruption of the ATP8A2 gene in a patient with a t(10;13) de novo balanced translocation and a severe neurological phenotype. Eur J Hum Genet. 2010;18(12):1360–1363. doi: 10.1038/ejhg.2010.126. [DOI] [PMC free article] [PubMed] [Google Scholar]
- 33.Dhar M, Hauser L, Johnson D. An aminophospholipid translocase associated with body fat and type 2 diabetes phenotypes. Obes Res. 2002;10(7):695–702. doi: 10.1038/oby.2002.94. [DOI] [PubMed] [Google Scholar]
- 34.Sebastian TT, Baldridge RD, Xu P, Graham TR. Phospholipid flippases: Building asymmetric membranes and transport vesicles. Biochim Biophys Acta. 2012;1821(8):1068–1077. doi: 10.1016/j.bbalip.2011.12.007. [DOI] [PMC free article] [PubMed] [Google Scholar]
- 35.Palmgren MG, Nissen P. P-type ATPases. Annu Rev Biophys. 2011;40:243–266. doi: 10.1146/annurev.biophys.093008.131331. [DOI] [PubMed] [Google Scholar]
- 36.Baldridge RD, Graham TR. Identification of residues defining phospholipid flippase substrate specificity of type IV P-type ATPases. Proc Natl Acad Sci USA. 2012;109(6):E290–E298. doi: 10.1073/pnas.1115725109. [DOI] [PMC free article] [PubMed] [Google Scholar]
- 37.Stone A, et al. Biochemical characterization of P4-ATPase mutations identified in patients with progressive familial intrahepatic cholestasis. J Biol Chem. 2012;287(49):41139–41151. doi: 10.1074/jbc.M112.413039. [DOI] [PMC free article] [PubMed] [Google Scholar]
- 38.Baldridge RD, Xu P, Graham TR. Type IV P-type ATPases distinguish mono- versus diacyl phosphatidylserine using a cytofacial exit gate in the membrane domain. J Biol Chem. 2013;288(27):19516–19527. doi: 10.1074/jbc.M113.476911. [DOI] [PMC free article] [PubMed] [Google Scholar]
- 39.Baldridge RD, Graham TR. Two-gate mechanism for phospholipid selection and transport by type IV P-type ATPases. Proc Natl Acad Sci USA. 2013;110(5):E358–E367. doi: 10.1073/pnas.1216948110. [DOI] [PMC free article] [PubMed] [Google Scholar]
- 40.Vestergaard AL, et al. Critical roles of isoleucine-364 and adjacent residues in a hydrophobic gate control of phospholipid transport by the mammalian P4-ATPase ATP8A2. Proc Natl Acad Sci USA. 2014;111(14):E1334–E1343. doi: 10.1073/pnas.1321165111. [DOI] [PMC free article] [PubMed] [Google Scholar]
- 41.Coleman JA, Vestergaard AL, Molday RS, Vilsen B, Andersen JP. Critical role of a transmembrane lysine in aminophospholipid transport by mammalian photoreceptor P4-ATPase ATP8A2. Proc Natl Acad Sci USA. 2012;109(5):1449–1454. doi: 10.1073/pnas.1108862109. [DOI] [PMC free article] [PubMed] [Google Scholar]
- 42. Smriti, Nemergut EC, Daleke DL (2007) ATP-dependent transport of phosphatidylserine analogues in human erythrocytes. Biochemistry 46(8):2249–2259. [DOI] [PubMed]
- 43.Zimmerman ML, Daleke DL. Regulation of a candidate aminophospholipid-transporting ATPase by lipid. Biochemistry. 1993;32(45):12257–12263. doi: 10.1021/bi00096a040. [DOI] [PubMed] [Google Scholar]
- 44.Morrot G, Hervé P, Zachowski A, Fellmann P, Devaux PF. Aminophospholipid translocase of human erythrocytes: Phospholipid substrate specificity and effect of cholesterol. Biochemistry. 1989;28(8):3456–3462. doi: 10.1021/bi00434a046. [DOI] [PubMed] [Google Scholar]
- 45.Paterson JK, et al. Lipid specific activation of the murine P4-ATPase Atp8a1 (ATPase II) Biochemistry. 2006;45(16):5367–5376. doi: 10.1021/bi052359b. [DOI] [PubMed] [Google Scholar]
- 46.Pomorski T, et al. Drs2p-related P-type ATPases Dnf1p and Dnf2p are required for phospholipid translocation across the yeast plasma membrane and serve a role in endocytosis. Mol Biol Cell. 2003;14(3):1240–1254. doi: 10.1091/mbc.E02-08-0501. [DOI] [PMC free article] [PubMed] [Google Scholar]
- 47.Toyoshima C, et al. Crystal structures of the calcium pump and sarcolipin in the Mg2+-bound E1 state. Nature. 2013;495(7440):260–264. doi: 10.1038/nature11899. [DOI] [PubMed] [Google Scholar]
- 48.Drachmann ND, et al. Comparing crystal structures of Ca(2+) -ATPase in the presence of different lipids. FEBS J. 2014;281(18):4249–4262. doi: 10.1111/febs.12957. [DOI] [PubMed] [Google Scholar]
- 49.Obara K, et al. Structural role of countertransport revealed in Ca(2+) pump crystal structure in the absence of Ca(2+) Proc Natl Acad Sci USA. 2005;102(41):14489–14496. doi: 10.1073/pnas.0506222102. [DOI] [PMC free article] [PubMed] [Google Scholar]
- 50.Natarajan P, Wang J, Hua Z, Graham TR. Drs2p-coupled aminophospholipid translocase activity in yeast Golgi membranes and relationship to in vivo function. Proc Natl Acad Sci USA. 2004;101(29):10614–10619. doi: 10.1073/pnas.0404146101. [DOI] [PMC free article] [PubMed] [Google Scholar]
- 51.Williamson P. Substrate trajectory through phospholipid-transporting P4-ATPases. Biochem Soc Trans. 2014;42(5):1367–1371. doi: 10.1042/BST20140137. [DOI] [PubMed] [Google Scholar]
- 52.Sandhoff K. Metabolic and cellular bases of sphingolipidoses. Biochem Soc Trans. 2013;41(6):1562–1568. doi: 10.1042/BST20130083. [DOI] [PubMed] [Google Scholar]
- 53.Sabourdy F, et al. Monogenic neurological disorders of sphingolipid metabolism. Biochim Biophys Acta. 2015;1851(8):1040–1051. doi: 10.1016/j.bbalip.2015.01.010. [DOI] [PubMed] [Google Scholar]
- 54.Toustrup-Jensen MS, et al. The C terminus of Na+,K+-ATPase controls Na+ affinity on both sides of the membrane through Arg935. J Biol Chem. 2009;284(28):18715–18725. doi: 10.1074/jbc.M109.015099. [DOI] [PMC free article] [PubMed] [Google Scholar]
- 55.Nyblom M, et al. Crystal structure of Na+, K(+)-ATPase in the Na(+)-bound state. Science. 2013;342(6154):123–127. doi: 10.1126/science.1243352. [DOI] [PubMed] [Google Scholar]
- 56.Toyoshima C. How Ca2+-ATPase pumps ions across the sarcoplasmic reticulum membrane. Biochim Biophys Acta. 2009;1793(6):941–946. doi: 10.1016/j.bbamcr.2008.10.008. [DOI] [PubMed] [Google Scholar]
- 57.Kelley LA, Mezulis S, Yates CM, Wass MN, Sternberg MJ. The Phyre2 web portal for protein modeling, prediction and analysis. Nat Protoc. 2015;10(6):845–858. doi: 10.1038/nprot.2015.053. [DOI] [PMC free article] [PubMed] [Google Scholar]
- 58.Cromey DW. Avoiding twisted pixels: Ethical guidelines for the appropriate use and manipulation of scientific digital images. Sci Eng Ethics. 2010;16(4):639–667. doi: 10.1007/s11948-010-9201-y. [DOI] [PMC free article] [PubMed] [Google Scholar]
- 59.Huster D, Müller P, Arnold K, Herrmann A. Dynamics of membrane penetration of the fluorescent 7-nitrobenz-2-oxa-1,3-diazol-4-yl (NBD) group attached to an acyl chain of phosphatidylcholine. Biophys J. 2001;80(2):822–831. doi: 10.1016/S0006-3495(01)76061-4. [DOI] [PMC free article] [PubMed] [Google Scholar]
- 60.Sikorski RS, Hieter P. A system of shuttle vectors and yeast host strains designed for efficient manipulation of DNA in Saccharomyces cerevisiae. Genetics. 1989;122(1):19–27. doi: 10.1093/genetics/122.1.19. [DOI] [PMC free article] [PubMed] [Google Scholar]


