Significance
A dual-function plastidial metabolite, methylerythritol cyclodiphosphate (MEcPP), an intermediate of the plastidial pathway for isoprenoids production and a retrograde signaling metabolite, transduces signals to activate general stress-response (GSR) genes by inducing a transcriptionally centered stress hub. Specifically, MEcPP mediates the induction of the rapidly and transiently stress-responsive functional cis-element rapid stress response element via the calmodulin-binding transcriptional activator CALMODULIN-BINDING TRANSCRIPTION ACTIVATOR 3 in a calcium-dependent manner. MEcPP-mediated induction of this hard-wired GSR circuitry is a prime example of the integration of this metabolite into transcriptional networks and, by extension, modulation of downstream responses such as protein-folding capacity. This finding provides a foundation for investigating mechanisms of biological responses to stress and the roles of metabolites beyond the expected classical biochemical pathways.
Keywords: MEcPP, retrograde signals, GSR, RSRE, CAMTA3
Abstract
The general stress response (GSR) is an evolutionarily conserved rapid and transient transcriptional reprograming of genes central for transducing environmental signals into cellular responses, leading to metabolic and physiological readjustments to cope with prevailing conditions. Defining the regulatory components of the GSR will provide crucial insight into the design principles of early stress-response modules and their role in orchestrating master regulators of adaptive responses. Overaccumulation of methylerythritol cyclodiphosphate (MEcPP), a bifunctional chemical entity serving as both a precursor of isoprenoids produced by the plastidial methylerythritol phosphate (MEP) pathway and a stress-specific retrograde signal, in ceh1 (constitutively expressing hydroperoxide lyase1)-mutant plants leads to large-scale transcriptional alterations. Bioinformatic analyses of microarray data in ceh1 plants established the overrepresentation of a stress-responsive cis element and key GSR marker, the rapid stress response element (RSRE), in the promoters of robustly induced genes. ceh1 plants carrying an established 4×RSRE:Luciferase reporter for monitoring the GSR support constitutive activation of the response in this mutant background. Genetics and pharmacological approaches confirmed the specificity of MEcPP in RSRE induction via the transcription factor CALMODULIN-BINDING TRANSCRIPTION ACTIVATOR 3 (CAMTA3), in a calcium-dependent manner. Moreover, CAMTA3-dependent activation of IRE1a (inositol-requiring protein-1) and bZIP60 (basic leucine zipper 60), two RSRE containing unfolded protein-response genes, bridges MEcPP-mediated GSR induction to the potentiation of protein-folding homeostasis in the endoplasmic reticulum. These findings introduce the notion of transcriptional regulation by a key plastidial retrograde signaling metabolite that induces nuclear GSR, thereby offering a window into the role of interorgannellar communication in shaping cellular adaptive responses.
Stress-triggered transcriptional reprogramming plays fundamental roles in transducing stress signals and ultimately enabling adaptive responses through readjustments of the appropriate physiological and metabolic processes. The initial transcriptional reprograming known as the “general stress response” (GSR), at times referred to as the “cellular stress response” or “core stress response,” is a recognized evolutionarily conserved stress response present across kingdoms (1–5).
The GSR, a rapid and transient transcriptional reprogramming, is induced by a wide variety of stresses imposed upon organisms by environmental forces on macromolecules such as membrane lipids, proteins, and/or DNA (6). Bioinformatic analysis of the promoters of the rapid wound-response genes (5 min after mechanical damage) in plants led to the identification of an overrepresented functional cis-element, the rapid stress response element (RSRE), which is analogous to the yeast stress response element (STRE) (4, 7). A reporter line containing luciferase (LUC) driven by a synthetic promoter with four copies of the RSRE (4×RSRE:LUC) has confirmed the multistress responsive nature of RSRE induction and established the line as suitable for readout of stress-induced rapid transcriptional responses (4). Indeed, exploiting the 4×RSRE:LUC line unraveled roles for [Ca2+]cyt, reactive oxygen species (ROS), MAPK signaling, and hormone signaling in modulating this stress-responsive transcriptional hub (4, 8–10) and further identified a member of the calmodulin-binding transcriptional activator (CAMTA) family, CAMTA3, as the predominant transcription factor that activates RSRE and, by extension, induces the GSR (10, 11).
Forward genetic studies directed at unraveling the components of stress-signaling networks in plants led to the discovery of the small stress-specific plastidial retrograde signaling metabolite methylerythritol cyclodiphosphate (MEcPP), which functions both as an intermediate of the methylerythritol phosphate (MEP) pathway for isoprenoids biosynthesis and as a communicator of environmental perturbations from the plastid to the nucleus (12, 13). The ceh1 (constitutively expressing hydroperoxide lyase1) mutant accumulates large quantities of MEcPP and displays various stress-associated phenotypes such as compromised growth, high salicylic acid (SA) content, and constitutive activation of the unfolded protein response (UPR) required for restoration of protein-folding homeostasis in the endoplasmic reticulum (ER) (13–15). We performed bioinformatic analyses of global microarray expression profiles and identified overrepresentation of the RSRE motif in the promoters of robustly induced genes in the ceh1 mutant, including key UPR-regulatory genes such as the ER membrane-localized inositol-requiring protein-1 (IRE1a) and the transcription factor basic leucine zipper 60 (bZIP60) responsible for the induction of ER quality control (15). Additional molecular genetics, pharmacological, and metabolic studies provided unequivocal evidence supporting the MEcPP-mediated induction of the RSRE and RSRE containing genes such as IRE1a and bZIP60 via the transcription factor CAMTA3, in a calcium dependent manner. These results highlight the regulation of nuclear transcription by a small plastidial effector molecule and demonstrate the integration of a plastidial retrograde signaling metabolite in a stress-induced transcriptional network including the UPR responsible for maintenance of protein-folding homeostasis in the ER.
Results
Constitutive Activation of the GSR Is Triggered Specifically by Perturbation in the Hydroxymethylbutenyl Diphosphate Synthase.
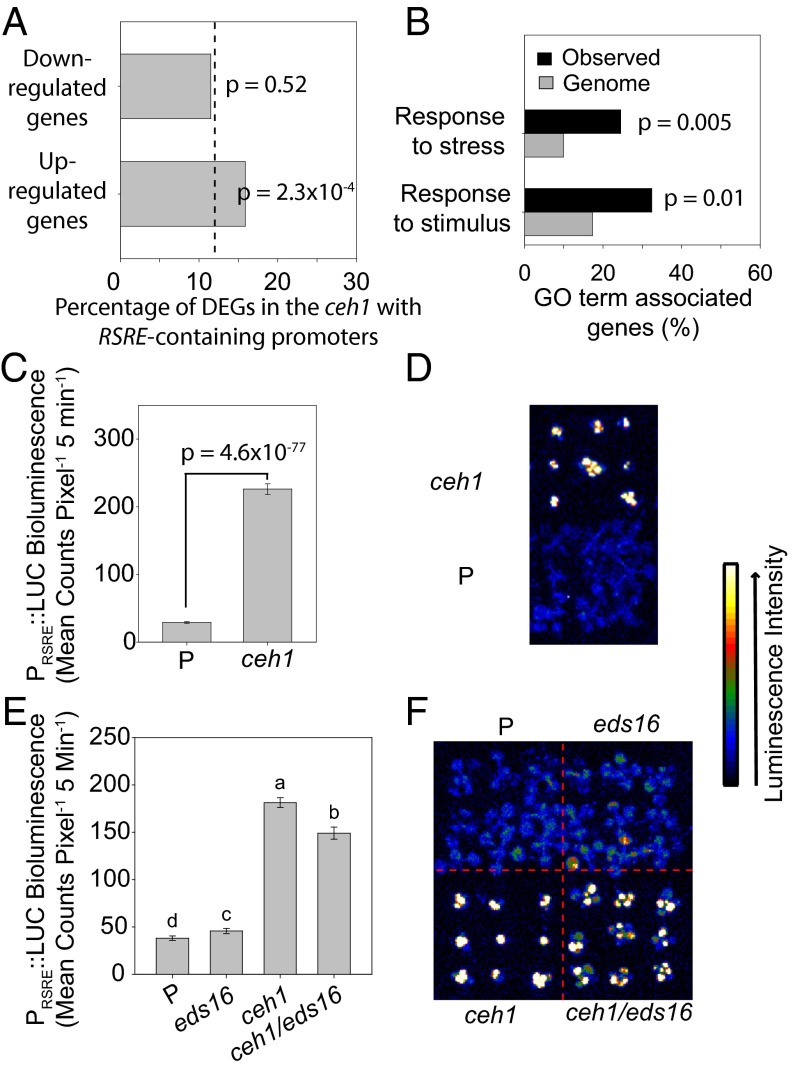
We previously established that accumulation of MEcPP in the ceh1 mutant results in constitutive expression of a number of otherwise stress-responsive genes (13). To define MEcPP-mediated responses at the transcriptional level, we examined global transcriptional profiles in ceh1 mutants versus the parent plants (15), followed by bioinformatic analyses. The analyses revealed overrepresentation of the RSRE in the promoters of robustly induced genes, but not suppressed genes, in the ceh1 mutant (Fig. 1A). Gene Ontology (GO) term-enrichment analyses implicated the induced RSRE-containing genes as stress responsive (Fig. 1B and Table S1). To examine the validity of the bioinformatic analyses in planta, we used homozygous plants generated from crossing ceh1 mutants to the line established for functional readout of stress-induced rapid transcriptional response, 4×RSRE:LUC, hereafter referred to as the “parent line” (P) (4, 8, 10). Subsequent luciferase-activity assays determined that the otherwise stress-inducible RSRE is significantly and constitutively active in the ceh1/RSRE:LUC line (hereafter for simplicity designated “ceh1”) (Fig. 1 C and D).
Fig. 1.
The constitutive activation of GSR is specific to the ceh1 and does not depend on SA. (A) Proportion of DEGs in the ceh1 mutant containing an RSRE in the proximal 500 bp of the promoter region. The dashed line represents the proportion of genes on the ATH1 genome array with RSRE-containing promoters. P values were determined via the hypergeometric distribution. (B) Enrichment of selected GO terms in RSRE-containing genes induced in ceh1 (observed); P values were determined using false-discovery rate (FDR)-corrected Fisher’s exact test. (C) Basal RSRE:LUC activity in parent (P) and ceh1 seedlings. Data are presented as means ± SEM (n ≥ 123) with the P value determined using a two-tailed Student’s t test. (D) Representative darkfield images of P and ceh1 plants expressing RSRE:LUC. (E) Basal RSRE:LUC activity in the listed genotypes. Data are presented as means ± SEM (n ≥ 123). Bars that do not share a letter represent statistically significant differences as determined by Tukey’s honestly significant difference (HSD) test (P < 0.05). (F) Representative darkfield images of plants of each genotype expressing RSRE:LUC. The color-coded bar displays the intensity of LUC activity.
Table S1.
GO enrichment for RSRE-containing ceh1 up-regulated genes (observed) relative to all genes represented on the ATH1 microarray (expected)
| GO ID | Term | Observed, % | Expected, % | P value |
| GO:0006950 | Response to stress | 24.50 | 9.90 | 0.00457 |
| GO:0009607 | Response to biotic stimulus | 11.80 | 3.00 | 0.00457 |
| GO:0009620 | Response to fungus | 6.90 | 0.80 | 0.00457 |
| GO:0010200 | Response to chitin | 5.90 | 0.60 | 0.00457 |
| GO:0050832 | Defense response to fungus | 5.90 | 0.60 | 0.00457 |
| GO:0050896 | Response to stimulus | 32.40 | 17.30 | 0.01 |
| GO:0009743 | Response to carbohydrate stimulus | 5.90 | 0.90 | 0.02 |
| GO:0051707 | Response to other organism | 9.80 | 2.70 | 0.02 |
| GO:0051704 | Multiorganism process | 9.80 | 2.90 | 0.02 |
| GO:0042221 | Response to chemical stimulus | 18.60 | 9.00 | 0.04 |
Only GO terms where P < 0.05 and the number of observed genes > 5 are shown. P values are derived from Fisher’s exact test with FDR correction.
We previously have reported that the ceh1 mutant, in addition to expressing high MEcPP levels, contains notably elevated levels of the stress-inducible hormone SA (13). To test whether high SA levels could contribute to the constitutive induction of RSRE, we generated homozygous lines containing 4×RSRE:LUC in SA-deficient backgrounds. Specially, we crossed P into the eds16-1 line, an SA-deficient mutant encoding a dysfunctional isochorismate synthase1 (ics1) gene (16), and into ceh1/eds16-1 double-mutant lines representing high MEcPP-expressing but SA-deficient plants (13). Luciferase-activity assays confirmed the presence of constitutively induced RSRE in both ceh1 and ceh1/eds16-1 backgrounds but not in the P and eds16-1 lines (Fig. 1 E and F). The slight reduction in RSRE activation in ceh1/eds16-1 compared with that in ceh1 suggests that although constitutive SA contributes modestly to GSR activation in ceh1, it is not the predominant factor. Moreover, this result positions MEcPP as a potential candidate metabolite contributing to induction of the RSRE.
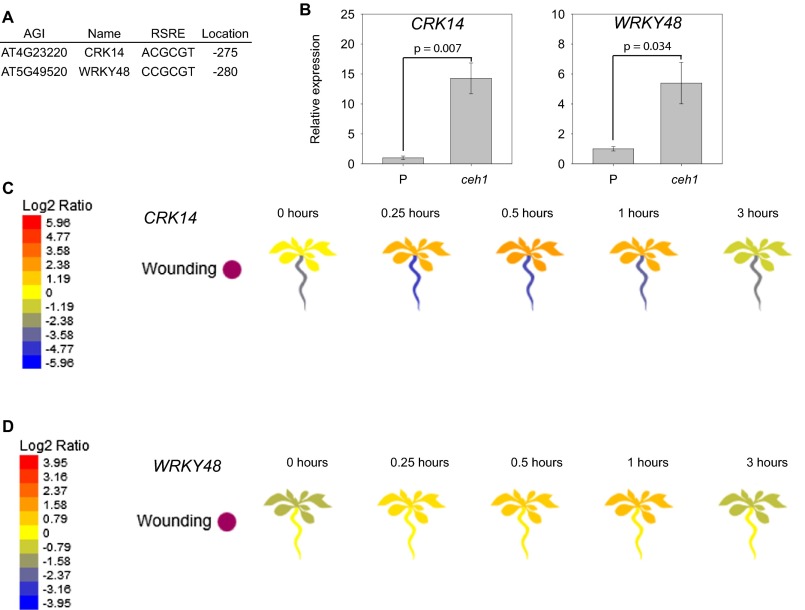
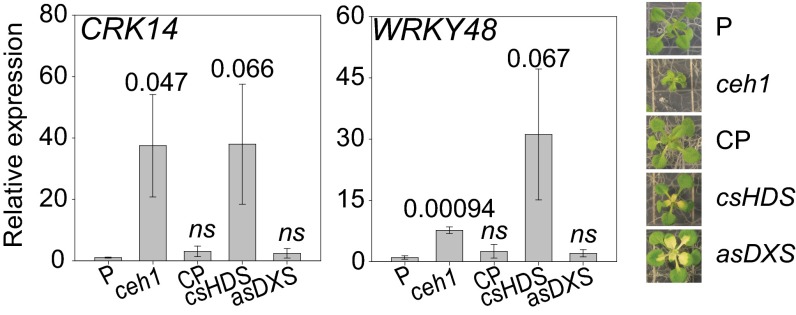
Next, we questioned whether the constitutive induction of the RSRE is the result of general stress caused by alteration of the MEP pathway or is caused specifically by the modulation in the activity of hydroxymethylbutenyl diphosphate synthase (HDS) enzyme that catalyzes conversion of MEcPP to HMBPP (13). To address this question, we sought to identify representative rapidly and generally stress-inducible genes whose promoters contain the GSR cis-element RSRE. Specifically, we found two genes, CRK14 (cysteine-rich receptor-like protein kinase 14) and WRKY48 (WRKY DNA-binding protein 48), with up-regulated expression levels in ceh1 and rapid and transient induction by a number of stresses, including UV-B exposure and wounding, an archetypal RSRE activity profile (Fig. S1) (17). We then quantified the relative expression levels of these two genes in various genotypes, including reported lines of parent background for ceh1 (P), ceh1, complemented ceh1 (CP), and HDS cosuppression (csHDS), and the RNAi line of deoxy-xylulose-5-phosphate synthase (asDXS), encoding the enzyme catalyzing the first step of the MEP pathway (13, 18, 19). These data confirmed the exclusive presence of high basal levels of these two otherwise stress-inducible genes in the ceh1 and csHDS lines and not in the other genotypes (Fig. S2). Most notably, despite the display of the stress phenotype of variegated leaves in both the csHDS and asDXS lines, the basal expression levels of the two stress-responsive genes in asDXS are similar to the levels present in the P and CP plants (Fig. S2). These results therefore provide evidence for the specificity of altered HDS enzyme activity, rather than the general perturbation of the MEP pathway, in inducing GSR.
Fig. S1.
CRK14 and WRKY48 are RSRE-containing GSR marker genes. (A) The position and sequence of the RSRE motif in the promoters of CRK14 and WRKY48 relative to the translational start site. (B) Relative expression levels of CRK14 and WRKY48 in P and ceh1 plants confirming the microarray analysis described. (C and D) Visualization by eFP browser (bar.utoronto.ca/efp/cgi-bin/efpWeb.cgi) of the relative expression levels of CRK14 (C) and WRKY48 (D) in response to wounding.
Fig. S2.
Constitutive induction of GSR genes is specific to the modulation of HDS. (Left) Relative expression of CRK14 and WRKY48 in the P, ceh1, ceh1-complementation (CP), HDS cosuppression (csHDS), and DXS antisense (asDXS) lines. (Right) Corresponding representative plants. Data are presented as means ± SEM (n = 3). P values were determined by one-tailed t tests. Values greater than P = 0.1 are labeled as nonsignificant (ns).
In Plants Containing High Levels of MEcPP the GSR Is Induced via the Transcription Factor CAMTA3.
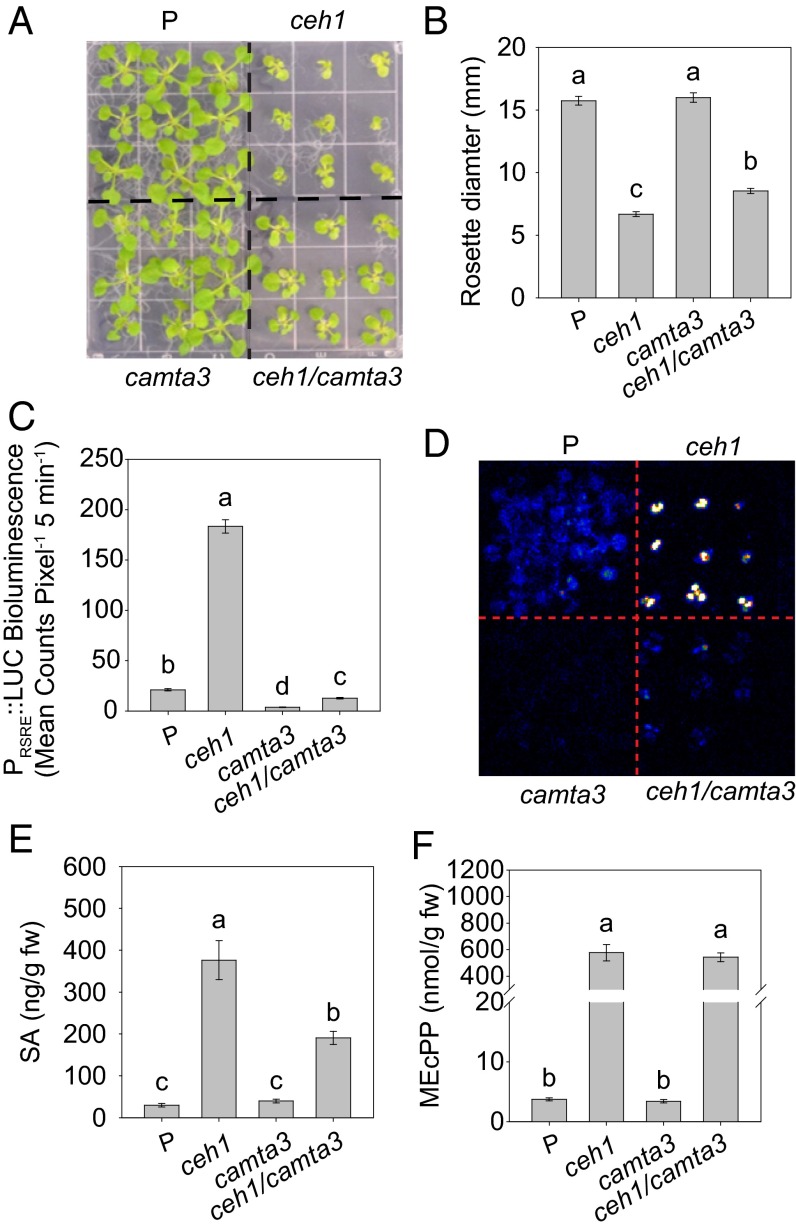
We previously identified a member of the CAMTA family, CAMTA3, as the key transcriptional activator of the RSRE (10). In light of this result, we questioned whether this function of CAMTA3 is preserved in the ceh1-mutant background or is replaced, in part or in totality, by other transcriptional modules. To address this question, we used the previously generated camta3/RSRE line (10) and crossed it to ceh1/RSRE to obtain ceh1/camta3/RSRE. As above, for simplicity the mutant lines containing the 4×RSRE:LUC reporter are referred to simply by mutant name (Fig. 2A). One notable phenotypic disparity between these lines is their difference in growth: ceh1/camta3 seedlings are larger than ceh1 seedlings but still are smaller than seedlings in the P or camta3 backgrounds (Fig. 2 A and B).
Fig. 2.
In plants containing high levels of MEcPP, the GSR is induced via the transcription factor CAMTA3. (A and B) Representative images of the examined genotypes (P, ceh1/RSRE, camta3/RSRE, and ceh1/camta3/RSRE) (A), and average rosette diameter (B). Data are presented as means ± SEM (n ≥ 65). (C) Basal RSRE:LUC activity in aforementioned seedlings. Data are presented as means ± SEM (n ≥ 123) with the P value determined using the two-tailed t test. (D) Darkfield image analysis of representative plants expressing transcriptional RSRE:LUC. (E and F) Levels of SA (E) and MEcPP (F) in the genotypes examined. Data are presented as the means ± SEM of four independent biological replicates. Bars that do not share a letter represent statistically significant differences as determined by Tukey’s HSD test (P < 0.05).
Next, we tested the luciferase activity in the aforementioned backgrounds and established that, compared with the respective parent backgrounds, both basal and constitutive levels of RSRE activity are highly reduced in the camta3 and ceh1/camta3 lines (Fig. 2 C and D). This finding confirms CAMTA3 as the prime RSRE transcriptional activator, independently of the genotype examined.
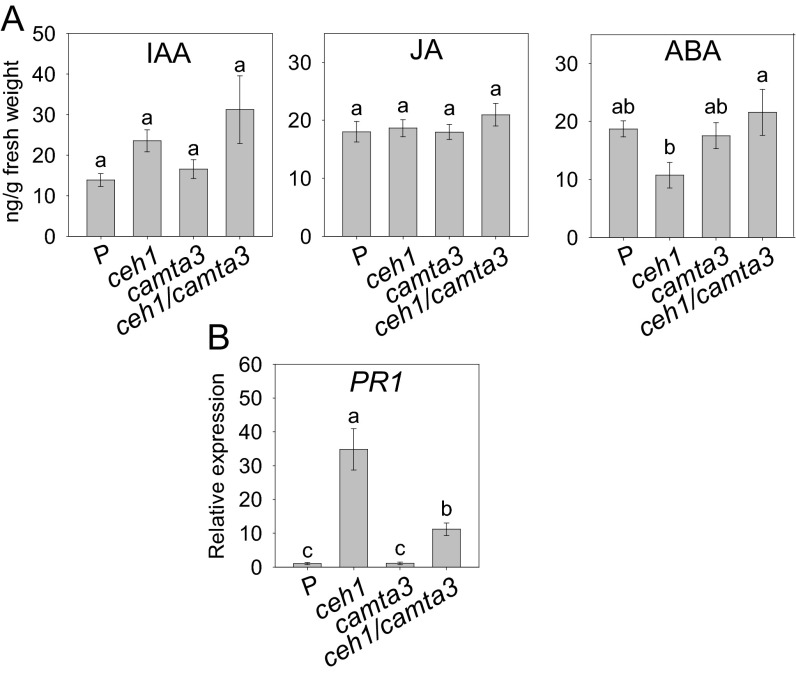
Given previous results reporting CAMTA3 as a suppressor of SA production in Arabidopsis (20–23), we examined the SA levels along with a panel of other hormones as controls, namely jasmonic acid (JA), abscisic acid (ABA), and auxin (IAA) in the P, ceh1, camta3, and ceh1/camta3 genotypes (Fig. 2E and Fig. S3A). These measurements provided evidence for the absence of any significant variation in the levels of two of the control hormones, namely IAA and JA. Interestingly, however, in contrast to ABA, whose lower level in ceh1 is recovered in ceh1/camta3, there is a substantial decrease in SA levels in the ceh1/camta3 genotype relative to ceh1. It is of note that SA levels in ceh1/camta3 are still higher than the levels in P plants, potentially supported by other transcriptional activator(s) in the ceh1-mutant background (Fig. 2E). Moreover, the reduced SA levels align with the decreased expression levels of the SA-marker gene, PR1 (Fig. S3B). These data therefore substantiate the specificity of CAMTA3 as a positive regulator of SA levels in the ceh1 mutant under the growth temperature used (24–25 °C). Indeed, the suppressing effect of CAMTA3 on SA at 19–22 °C has been reported previously to disappear at 24–25 °C and to be overcome at 4 °C (20–23). These results thus add another instance of a conditional and complex interaction between CAMTA3 and SA regulation.
Fig. S3.
Expression levels of PR1 are reduced in the ceh1/camat3 background. (A) Levels of auxin (IAA), jasmonic acid (JA), and abscisic acid (ABA) in each genotype examined on four biological replicates. Data are presented as means ± SEM (n = 4). Bars that do not share a letter represent statistically significant differences as determined by Tukey’s HSD test. (B) Relative expression of PR1 in each genotype by qRT-PCR. Data are presented as means ± SEM (n = 4).
Next, we measured the levels of MEcPP in the aforementioned backgrounds to test the potential influence of CAMTA3 in determining the metabolite’s levels and, by extension, to delineate the contributions of MEcPP levels to deactivation of RSRE in the ceh1/camta3 background (Fig. 2F). The similar MEcPP levels in ceh1 and ceh1/camta3 clearly demonstrate the irrelevance of CAMTA3 functionality to MEcPP levels.
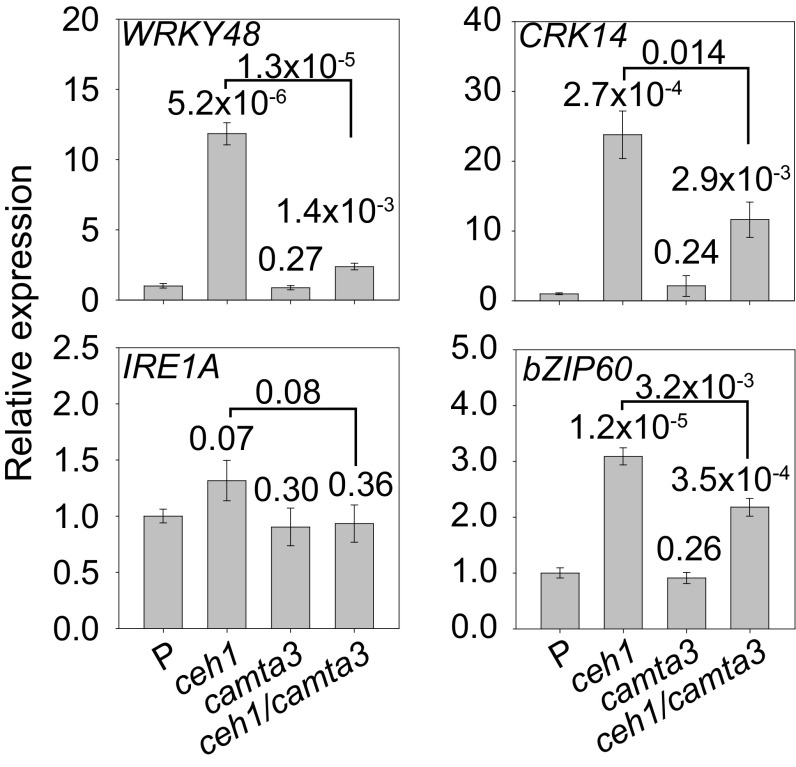
Next, we questioned whether the expression levels of RSRE-containing genes display similar dependency on CAMTA3. For these experiments, we targeted the aforementioned GSR model genes CRK14 and WRKY48 and the RSRE-containing UPR genes, IRE1a and bZIP60, previously shown to be up-regulated in the ceh1 mutant (15). Analyses of the transcript levels of these genes in the four genotypes of P, ceh1, camta3, and ceh1/camta3 clearly display the key role of CAMTA3 in determining the expression levels of all four genes. Specifically, the data show induced expression levels of these genes in the ceh1 mutant and their reduced expression (albeit to different degrees) in ceh1/camta3 relative to the ceh1 background (Fig. 3). Thus the data verify CAMTA3 as the key transcriptional activator of the RSRE and further establish the role of this transcriptional activator in the induction of stress-responsive genes, including those of the UPR regulating the ER protein-folding capacity.
Fig. 3.
The expression of GSR and UPR genes in the ceh1 line is induced predominantly via CAMTA3. Relative expression levels of two GSR marker genes (WRKY48 and CRK14) and two of the UPR genes (IRE1a and bZIP60) analyzed by quantitative RT-PCR (qRT-PCR) in P, ceh1, camta3, and ceh1/camta3 lines. Data are presented as means ± SEM of four independent biological replicates. The numbers above each pair of bars are P values from one-tailed t tests relative to the P line, unless otherwise indicated.
Exogenous Application of MEcPP Rapidly Induces RSRE via CAMTA3.
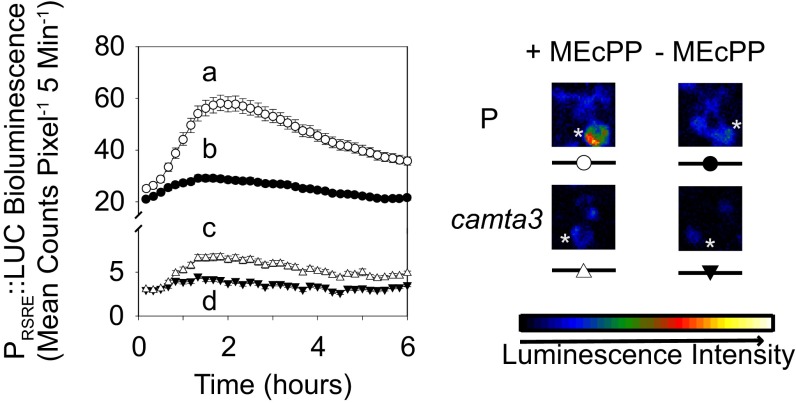
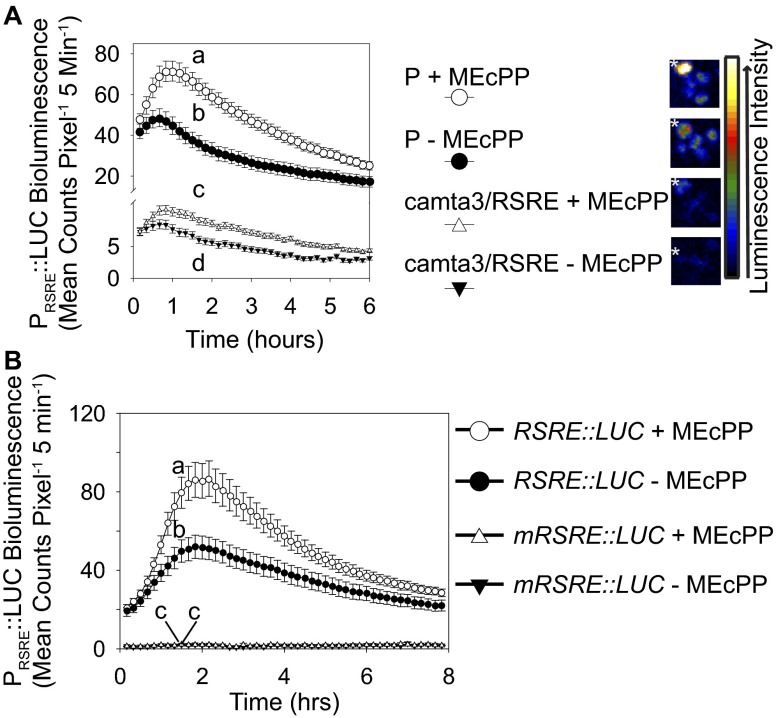
We next examined the specificity of MEcPP in potentiating RSRE by exogenous treatment of the 4×RSRE:LUC parent line with MEcPP or water as the solvent control (Fig. 4, upper curves). For these experiments, we used two independent sources, commercially prepared and in-house chemically synthesized MEcPP. The results clearly show that direct application of either MEcPP preparation results in similar rapid and transient luciferase activity in P plants (Fig. 4 and Fig. S4A) that is reminiscent of the previously reported wound-induced RSRE activity profile (4, 8, 10). The observed activity in control plants treated with water likely results from touch-mediated activation of RSRE upon application of the droplet (Fig. 4 and Fig. S4A). As an additional control, we examined the impact of MEcPP treatment on 4×mRSRE:LUC, a line previously developed to contain RSRE mutated in three of the six core nucleotides (4). The absence of luciferase activity in the 4×mRSRE:LUC line treated with MEcPP, as opposed to the 4×RSRE:LUC, displays the specificity of the RSRE in conferring the MEcPP-mediated response (Fig. S4B).
Fig. 4.
Exogenous application of MEcPP rapidly induces RSRE via CAMTA3. (Left) Activity of RSRE:LUC in P (upper curves) and camta3 (lower curves) leaves following application of MEcPP (open circles and triangles) or water as the control (filled circles and triangles). Data are shown as means ± SEM (n ≥ 187). Lines that do not share a letter represent statistically significant differences as determined by Tukey’s HSD test at the 90-min time point (P < 0.05). (Right) Representative plants are shown at right, with the treated leaves labeled by a white asterisk. The color-coded bar displays the intensity of LUC activity.
Fig. S4.
Exogenous application of MEcPP rapidly and specifically induces RSRE but not mRSRE via CAMTA3. (A, Left) Activity of RSRE:LUC in P and camta3 leaves following application of water as the control (filled circles and triangles) or 100 μM of commercial MEcPP (open circles and triangles). Data are presented as means ± SEM (n ≥ 70). (Right) Representative plants are shown, with the treated leaves labeled by a white asterisk. The color-coded bar displays the intensity of LUC activity. (B) Activity of RSRE:LUC (circles) and mRSRE:LUC (triangles) following application of water as the control (filled circles and triangles) or 100 uM MEcPP (open circles and triangles). Data are presented as means ± SEM (n ≥ 63). Lines in A and B that do not share a letter represent statistically significant differences as determined by Tukey’s HSD test at the 90-min time point.
Next, we questioned whether this direct impact of MEcPP in potentiating RSRE occurs via CAMTA3. Therefore we conducted MEcPP application experiments on the camta3/RSRE background (Fig. 4 and Fig. S4A, lower curves). The result mimics an RSRE induction profile similar to that of the P plants but much smaller in magnitude, providing additional support for the key role of CAMTA3 in MEcPP-mediated RSRE induction. However, the subtle but detectable luciferase activity in the camta3 mutant supports the presence of an additional MEcPP-responsive RSRE transcriptional activator, here referred to as “factor X.”
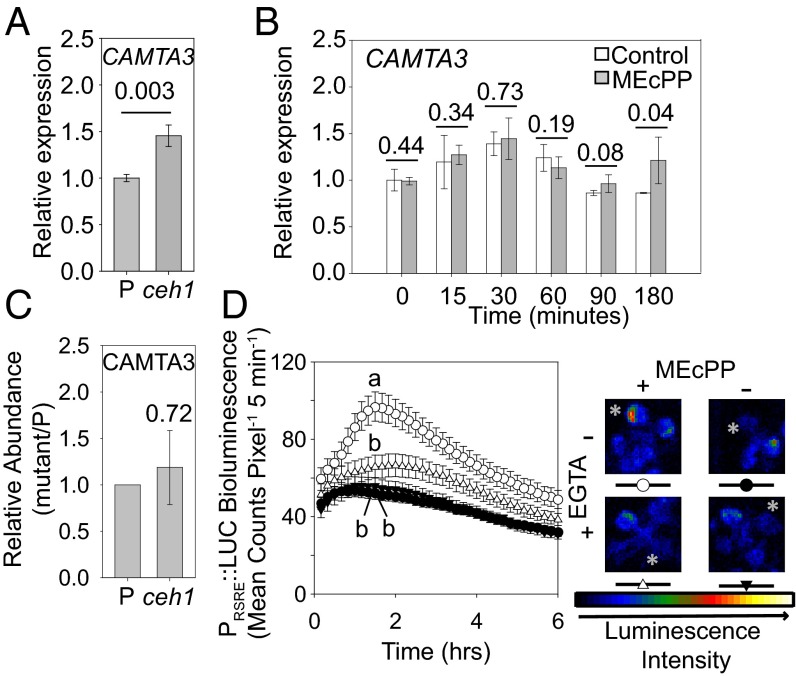
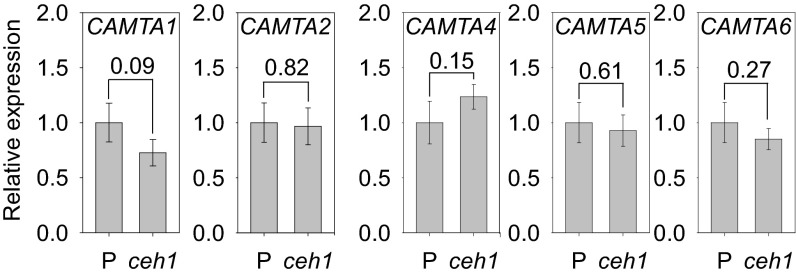
We next tested a potential molecular connection between MEcPP and CAMTA3 by examining the CAMTA3 transcript level in the ceh1 mutant and further examined whether such an alteration is specific to CAMTA3 or extends to any of the other five members of the CAMTA family. These analyses identified CAMTA3 as the only gene family member whose transcript level is statistically significantly increased in ceh1 relative to P plants (Fig. 5A and Fig. S5). We further examined whether MEcPP could directly induce the expression of CAMTA3 and, if so, whether such an induction occurs before or in concordance with the temporal dynamics of 4×RSRE:LUC activity in response to the exogenous application of MEcPP (Fig. 5B). The temporal asynchrony between the activation of RSRE, peaking at 90 min, and MEcPP-induced expression of CAMTA3 at 180 min in response to MEcPP application (Fig. 4A and Figs. S4 A and B and 5B) strongly suggests that, at least initially, function of MEcPP in potentiating RSRE activity is not via the induction of CAMTA3 expression levels.
Fig. 5.
Activation of RSRE by MEcPP is Ca2+ dependent. (A) Relative expression levels of CAMTA3 analyzed by qRT-PCR in the P and ceh1 lines. Data are presented as means ± SEM (n = 3), with the P value determined by the two-tailed t test. (B) Relative expression levels of CAMTA3 analyzed by RT-qPCR in P plants at different times after the application of water (white bars) or MEcPP (gray bars) to the leaves. Data are presented as means ± SEM (n = 3). P values from one-tailed t tests are shown above each pair of bars. (C) Normalized iTRAQ CAMTA3 protein abundance in ceh1 plants relative to P plants. Data are presented as means with the P value determined by the two-tailed t test. (D, Left) Activity of 4×RSRE:LUC in the P background following pretreatment with EGTA (triangles) or water (circles) and subsequent MEcPP application (open circles and triangles) or water as the control (filled circles and triangles). Data are shown as means ± SEM (n ≥ 111). Lines that do not share a letter represent statistically significant differences as determined by Tukey’s HSD test at the 90-min time point (P < 0.05). (Right) Representative plants are shown with the treated leaves labeled by a white asterisk. The color-coded bar displays the intensity of LUC activity.
Fig. S5.
CAMTA transition factors are not differentially regulated in the ceh1 line. Shown are the relative expression of CAMTA1, CAMTA2, CAMTA4, CAMTA5, and CAMTA6 in the previously described P and ceh1 lines. qRT-PCR data are shown as means ± SEM (n = 3). P values from two-tailed t tests are shown above each pair of bars.
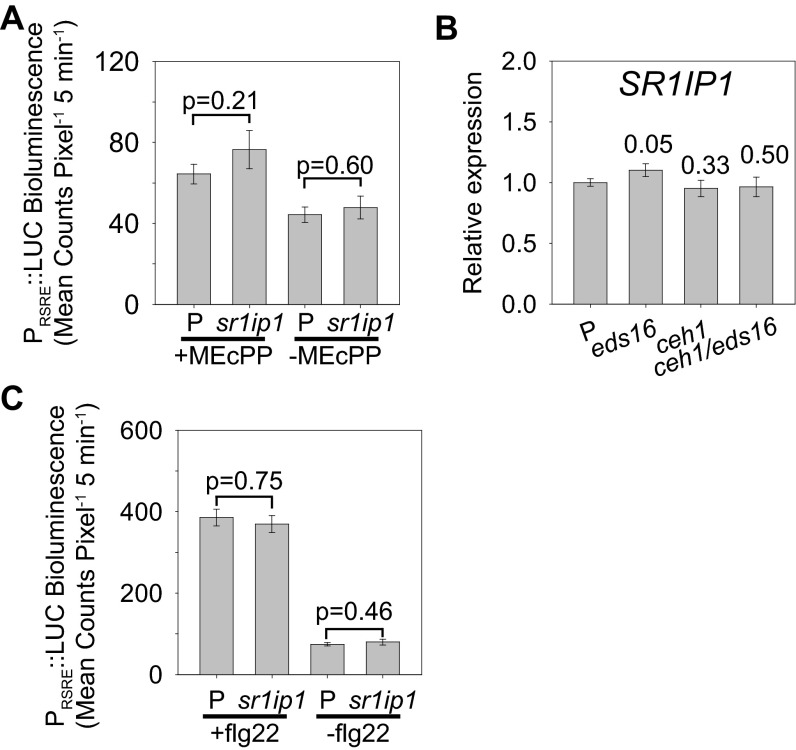
Next, we asked whether the accumulation of MEcPP in ceh1 results in enhanced stability of CAMTA3 protein levels and, by extension, activation of RSRE, specifically in light of a report identifying SR1IP1 (CAMTA3/AtSR1 interaction protein 1) as an adaptor for ubiquitination of CAMTA3 in plants challenged with pathogens (24). Thus, we questioned whether SR1IP1 might be involved in GSR regulation and if the constitutive activation of RSRE in the ceh1 mutant is associated with reduced expression levels of SR1IP1 and thereby altered CAMTA3 stability. To address these possibilities, we first generated homozygous sr1ip1/4×RSRE:LUC lines and treated them with MEcPP, followed by luciferase-activity measurements (Fig. S6A). As evidenced by the data, SR1IP1 is not involved in MEcPP-mediated induction of the GSR. In addition, similar SR1IP1 expression levels in the genotypes with varying MEcPP and SA levels, namely P, ceh1, eds16-1, and ceh1/eds16-1 (Fig. S6B), exclude an association between SA or MEcPP levels and modification of the SR1IP1 expression levels. Last, application of the bacterial elicitor flg22 (a 22-aa flagellin peptide) on sr1ip1 resulted in induction of RSRE similar to that in the P plants (Fig. S6C). These findings collectively exclude the involvement of SR1IP1 in the regulation of the RSRE-mediated GSR.
Fig. S6.
SR1IP1 is not required for the RSRE:LUC response to flg22 and is not differentially regulated in ceh1. (A) RSRE::LUC activity in P and sr1ip1 90 min after the application of 100 μM MEcPP or water (control). Data are presented as means ± SEM (n ≥ 121). (B) Relative expression levels of SR1IP1 in P, eds16-1, ceh1, and ceh1/eds16-1 lines. The numbers above the bars are P values from two-tailed t tests with P. Data are presented as means ± SEM (n = 3). (C) The LUC activity in P and sr1ip1/RSRE:LUC treated with 0.5 um flg22 (+flg22) or with SilWet as the control (−flg22). Data are presented as means ± SEM (n ≥ 45). The P values above each pair of bars are from one-way ANOVA.
SR1IP1 is not necessarily the only factor regulating the stability of CAMTA3 protein. Accordingly, we compared the CAMTA protein levels in P versus ceh1 plants using our previously generated proteomic dataset (15) (massive.ucsd.edu/ProteoSAFe/static/massive.jsp) (Fig. 5C). These data clearly display similar CAMTA3 abundance in P and the ceh1-mutant background, thus excluding a significant contribution of differential CAMTA3 abundance to constitutive activation of RSRE in the ceh1-mutant background.
MEcPP Induction of RSRE Is Ca2+ Dependent.
The role of Ca2+ as a secondary messenger in stress signaling in general and its established role in RSRE induction in particular (9, 10) led us to examine the dependency of MEcPP-mediated RSRE induction of this element using the Ca2+ chelator EGTA (Fig. 5D). The results show that 4×RSRE:LUC plants treated with EGTA no longer respond to the inductive effect of MEcPP, thus providing clear evidence that Ca2+ is required in potentiating MEcPP-mediated transcriptional activation of RSRE.
Discussion
Organisms respond to environmental perturbations by altering gene expression and, by extension, activating integrated stress-response networks that ultimately reconfigure the cellular homeostasis vital to a timely and optimal adaptation to unfavorable conditions. One such integrated stress-response network is the GSR, which rapidly and transiently responds to a variety of stresses.
The dynamic role of biosynthetic metabolites in orchestrating master regulators of adaptive responses, although irrefutable, is not yet fully understood. Here we provide bioinformatic, molecular genetic, metabolomic, and pharmacological evidence for the integration of the stress-specific plastidial retrograde signaling metabolite MEcPP into the GSR transcriptional circuitry via activation of the cis-element RSRE, thereby inducing of a core set of stress-response genes.
The striking similarity between the rapid and transient activation of RSRE by external application of MEcPP and by wounding strongly supports the transcriptional regulation of this GSR element by the stress-specific plastidial retrograde signaling metabolite. Indeed the increase in the MEcPP levels in response to wounding or high light (13) correlates well with the activation of GSR genes with RSRE in their promoters, thus further substantiating the integration of a plastidial retrograde signaling metabolite in a stress-induced transcriptional network. The stress-mediated induction of MEcPP levels in bacterial cultures exposed to oxidative stress is supportive of the functional conservation of this metabolite in stress responses and even in the regulation of stress-responsive transcriptional networks (25).
Here, we deepen our understanding of the mechanism by which this well-conserved stress-signaling metabolite functions in plants by showing that MEcPP-mediated RSRE induction is via the transcriptional activator CAMTA3 in a Ca2-dependent manner.
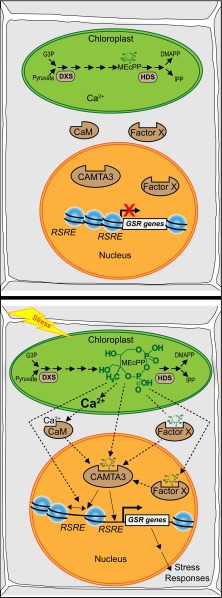
Our previous report on role of the stress-responsive retrograde signal MEcPP in activating the UPR in the ER did not address the molecular mechanisms of this action (15). Here we illustrate the critical role of CAMTA3 in the activation of RSRE-containing genes such as IRE1a and bZIP60, the two UPR genes responsible for maintaining the protein-folding capability of the ER, and thereby shed light on the molecular mechanisms of MEcPP action. However, understanding how this retrograde signaling metabolite integrates into the transcriptional network remains a challenge. Among several potential scenarios, one is that MEcPP functions as a rheostat for the release of Ca2+ for CAMTA3 activation, as presented in the simplified schematic model (Fig. 6). Indeed the dependency of MEcPP action on the presence of Ca2+ supports this scenario. Additionally or alternatively, MEcPP may function as an allosteric modulator by binding to and altering the conformation, and thus the affinity, of CAMTA3. However, this possibility requires an as yet unidentified MEcPP plastid–nuclear mode of transport, because the predominant presence of CAMTA3 in the nucleus is well established (11). Alternatively and/or additionally, MEcPP may function as an allosteric modulator of still another transcriptional activator, factor X, that supports subtle but significant residual RSRE activity in the absence of CAMTA3 while also potentially enabling stronger RSRE activation via interaction with CAMTA3 (Fig. 6). Finally, MEcPP could mediate dynamic architectural changes in chromatin structure through epigenetic regulation, similar to its direct function in nucleoid decondensation in chlamydial cultures by disrupting the interaction of histone-like proteins with DNA (26). In this case, chromatin becomes the receptor of the metabolic state of the cell, in part through fluctuation in MEcPP levels.
Fig. 6.
Simplified schematic models of MEcPP mode(s) of action in potentiating the GSR. Schematic models of the MEcPP-mediated cellular responses before (Upper) and after (Lower) stress. Possible MEcPP signaling routes are depicted, including stress-mediated alteration in MEcPP levels functioning as a rheostat for the release of Ca2+ for the activation of CAMTA3; MEcPP-mediated alteration of chromatin architecture enabling the accessibility of RSRE for transcriptional regulators; MEcPP potentially functioning as an allosteric modulator of CAMTA3 or its potential coinducer; or a yet unknown transcriptional activator (factor X) binding to and activating RSRE, ultimately triggering the GSR.
In summary, our finding unfolds the role of MEcPP as a key dynamic metabolic effector that orchestrates a complex stress-responsive transcriptional network, in part by activing RSRE. Moreover, our evidence bridging and extending the GSR to the UPR via CAMTA3-driven Ca2+-dependent RSRE activation provides a new window for understanding how the induction of stress-response networks leads to the integration of interorgannellar communication, ultimately refining and shaping cellular adaptive responses.
Materials and Methods
Cis Element and GO Analysis.
ceh1 differentially expressed genes (DEGs) with the RSRE motif within the first 500 bp of their promoters were identified by using BioVenn (27) for comparison with the list of previously described ceh1 DEGs (15) and the list of all previously identified RSRE-containing promoters (10), followed by calculation of significance by the cumulative hypergeometric distribution. GO analysis was conducted with the BioMaps tool from VirtualPlant 1.3 (28).
Plant Growth and Treatments.
All experiments were conducted on 2-wk-old seedlings grown in 16-h light/8-h dark cycles at 24–25 °C on 1/2× Murashige and Skoog medium. Luciferin treatment, flg22 application, and mechanical wounding were performed as described previously (4, 8, 10). EGTA was applied by placing a 2-µL drop of 5 mM EGTA or water (as a control), both with 0.01% SilWet L-77, on a leaf 30 min before the addition of 2 µL of either water or MEcPP (100 µM final concentration) to the pretreatment drop.
MEcPP Synthesis and Treatment.
MEcPP, either a commercial (Echelon, catalog no. I-M054) or an in-house synthesized compound, was applied to a single leaf per plant as described previously (13). The in-house synthesized MEcPP was prepared as previously described (29) with a slight modification, namely the conversion of bisphosphate to pyrophosphate was with two instead of one equivalents of 1,1′-carbonyldiimidazole, and stoichiometric Pd(OH)2/C was used for the hydrogenation step.
Generation of RSRE:LUC Lines.
The ceh1/RSRE line was generated by crossing 4×RSRE:LUC (4) to ceh1 segregated from the previously described original HPL:LUC marker (13). The ceh1/camta3/RSRE and ceh1/eds16-1/RSRE lines were generated by crossing camta3/RSRE (10) or ceh1/eds16-1 (16) to ceh1/RSRE. The sr1ip1/RSRE line was generated by crossing 4×RSRE:LUC to the Arabidopsis Biological Research Center line SALK_064178 (24). Genotyping primers used are listed in the Table S2.
Table S2.
Primer sequences used for qRT-PCR and genotyping
| Name | Type | Purpose | Sequence | References and notes |
| JWW237 | qRT-PCR | AT4G26410 fw | GAGCTGAAGTGGCTTCCATGAC | Internal control (31) |
| JWW238 | qRT-PCR | AT4G26410 rv | GGTCCGACATACCCATGATCC | Internal control (31) |
| GKB182 | qRT-PCR | CAMTA1 fw | CTGTCAGAAGCCCAACACAG | (20) |
| GKB183 | qRT-PCR | CAMTA1 rv | CCTTGAGCTTCTCATGAGCTTCTC | (20) |
| GKB184 | qRT-PCR | CAMTA2 fw | GGCAAGGAGCACATGAAAAT | (20) |
| GKB185 | qRT-PCR | CAMTA2 rv | TAAGATCCTCGGGGCCTAAT | (20) |
| GKB186 | qRT-PCR | CAMTA3 fw | CAACGACATCCAAGAAAGCA | (20) |
| GKB187 | qRT-PCR | CAMTA3 rv | TGAGGACATAGGCAACATCAA | (20) |
| GKB188 | qRT-PCR | CAMTA4 fw | TTTGGAAAGGGCAGGAACTA | (20) |
| GKB189 | qRT-PCR | CAMTA4 rv | TTTGGTAACCTCGCACATGA | (20) |
| GKB190 | qRT-PCR | CAMTA5 fw | ATCGCGAGACACATGAGGTT | (20) |
| GKB191 | qRT-PCR | CAMTA5 rv | GACTGTTGCTCCGCACTGTA | (20) |
| GKB192 | qRT-PCR | CAMTA6 fw | TTGTCTTCAGGGACGGTCTT | (20) |
| GKB193 | qRT-PCR | CAMTA6 rv | TGGAGTCTACCGTTGCATCA | (20) |
| GKB444 | qRT-PCR | SR1IP1 fw | CGACATCTACCTTAAGGCGCATCC | Designed using QuantPrime |
| GKB445 | qRT-PCR | SR1IP1 rv | TGGCAGTCCATTAAGCTGCACAC | Designed using QuantPrime |
| GKB420 | qRT-PCR | CRK14 fw | GTGGGAGCTTTTTCCCTTCTCTGA | (32) |
| GKB421 | qRT-PCR | CRK14 rv | ATGATTGCCCAGACAATTCCTATCG | (32) |
| MSL425 | qRT-PCR | WRKY48 fw | GGTTTGCGTTTCTGACGAAGAGC | Designed using QuantPrime |
| MSL426 | qRT-PCR | WRKY48 rv | TGGTGCAACGGTAATAGCTTCTGG | Designed using QuantPrime |
| JWW245 | qRT-PCR | PR1 fw | GTGGGTTAGCGAGAAGGCTA | (33) |
| JWW246 | qRT-PCR | PR1 rv | ACTTTGGCACATCCGAGTCT | (33) |
| JIN65 | qRT-PCR | bZIP60u fw | AGTCTGCTGTGCTCTTGTTGG | (34) |
| JIN66 | qRT-PCR | bZIP60u rv | GCAACACTTTGTGTGGGACATA | (34) |
| JIN69 | qRT-PCR | IRE1a fw | GCGCTACAGGCGTTACAAATA | (34) |
| JIN70 | qRT-PCR | IRE1b rv | TCGTCGAATCCTTCTGGAACT | (34) |
| GKB20 | Genotyping | camta3LP | TGAAAACCTGATGAATCCGAG | Pair with GKB21 for WT reaction. |
| GKB21 | Genotyping | camta3 RP | TGTTTGGGCAAACAGAAGTTC | Pair with GKB20 for WT reaction or with GKB5 for insert reaction. |
| MB190 | Genotyping | RSRE::LUC RP | CGTCCAGTTGGGTTTAGGTC | Pair with MB191 for WT reaction or with MB163 for insert reaction. |
| MB191 | Genotyping | RSRE::LUC LP | GGGGTACATGACAGTTGTTGC | Pair with MB190 for WT reaction. |
| MB163 | Genotyping | RSRE::LUC internal | TCCTTTATGTAATTTTCCAGAATCCTTGTCAGA | Pair with MB190 for insert reaction. |
| 32-10fw | Genotyping | ceh1 fw | AGGTGGTTCTCCCGGAAAAATCGAT | Pair with 32-10rv. Cut with MBOI after PCR, ceh1 has MBOI site, WT does not. |
| 32-10rv | Genotyping | ceh1 rv | TCTCTCACAGTTTTCAAAGAATGG | Pair with 32-10fw. Cut with MBOI after PCR, ceh1 has MBOI site, WT does not. |
| yx234 | Genotyping | eds16 fw | TCGATATCTTAGCGTTATGTG | Pair with yx235, yx236. Mutant produces 419-bp band, WT produces 639bp band. |
| yx235 | Genotyping | eds16 rv | ACTAGAAGATAGTTGAACCAAGG | Pair with yx234, yx236. Mutant produces 419-bp band, WT produces 639bp band. |
| yx236 | Genotyping | eds16 internal | AGAGACAGAAAGTAACAAGAGG | Pair with yx234, yx235. Mutant produces 419-bp band, WT produces 639bp band. |
| MB198 | Genotyping | sr1ip1 LP | TATTCCTCGAAACAACGGTTG | Pair with MB199 for WT reaction. |
| MB199 | Genotyping | sr1ip1 RP | TCTTTTGGTGGTTTGGTTCTG | Pair with MB198 for WT reaction or with GKB5 for insert reaction. |
| GKB5 | Genotyping | LBb1.3 SALK BP | ATTTTGCCGATTTCGGAAC | LB primer for SALK T-DNA lines |
Quantification of Gene Expression.
Real-time PCR and data normalization were performed as described (4) using QuantPrime. All primer sequences are listed in the Table S2.
Luciferase-Activity Quantification.
Quantification and statistical analysis of RSRE:LUC activity were performed as previously described (10).
Hormone and MEcPP Measurement.
The analyses of hormones and MEcPP were conducted as previously described (14, 30).
Acknowledgments
We thank members of the K.D. laboratory, Yanmei Xiao, Mark Lemos, and Jin-Zheng Wang, for critical discussions and for providing experimental material. This work was supported by National Science Foundation Grants IOS-1036491 and IOS-1352478 and NIH Grant R01GM107311 (to K.D.).
Footnotes
The authors declare no conflict of interest.
This article is a PNAS Direct Submission.
This article contains supporting information online at www.pnas.org/lookup/suppl/doi:10.1073/pnas.1602582113/-/DCSupplemental.
References
- 1.Gasch AP, et al. Genomic expression programs in the response of yeast cells to environmental changes. Mol Biol Cell. 2000;11(12):4241–4257. doi: 10.1091/mbc.11.12.4241. [DOI] [PMC free article] [PubMed] [Google Scholar]
- 2.Kültz D. Molecular and evolutionary basis of the cellular stress response. Annu Rev Physiol. 2005;67:225–257. doi: 10.1146/annurev.physiol.67.040403.103635. [DOI] [PubMed] [Google Scholar]
- 3.Ma S, Bohnert HJ. Integration of Arabidopsis thaliana stress-related transcript profiles, promoter structures, and cell-specific expression. Genome Biol. 2007;8(4):R49. doi: 10.1186/gb-2007-8-4-r49. [DOI] [PMC free article] [PubMed] [Google Scholar]
- 4.Walley JW, et al. Mechanical stress induces biotic and abiotic stress responses via a novel cis-element. PLoS Genet. 2007;3(10):1800–1812. doi: 10.1371/journal.pgen.0030172. [DOI] [PMC free article] [PubMed] [Google Scholar]
- 5.Weber H, Polen T, Heuveling J, Wendisch VF, Hengge R. Genome-wide analysis of the general stress response network in Escherichia coli: SigmaS-dependent genes, promoters, and sigma factor selectivity. J Bacteriol. 2005;187(5):1591–1603. doi: 10.1128/JB.187.5.1591-1603.2005. [DOI] [PMC free article] [PubMed] [Google Scholar]
- 6.Walley JW, Dehesh K. Molecular mechanisms regulating rapid stress signaling networks in Arabidopsis. J Integr Plant Biol. 2010;52(4):354–359. doi: 10.1111/j.1744-7909.2010.00940.x. [DOI] [PubMed] [Google Scholar]
- 7.Kobayashi N, McEntee K. Identification of cis and trans components of a novel heat shock stress regulatory pathway in Saccharomyces cerevisiae. Mol Cell Biol. 1993;13(1):248–256. doi: 10.1128/mcb.13.1.248. [DOI] [PMC free article] [PubMed] [Google Scholar]
- 8.Bjornson M, et al. Distinct roles for mitogen-activated protein kinase signaling and CALMODULIN-BINDING TRANSCRIPTIONAL ACTIVATOR3 in regulating the peak time and amplitude of the plant general stress response. Plant Physiol. 2014;166(2):988–996. doi: 10.1104/pp.114.245944. [DOI] [PMC free article] [PubMed] [Google Scholar]
- 9.Whalley HJ, et al. Transcriptomic analysis reveals calcium regulation of specific promoter motifs in Arabidopsis. Plant Cell. 2011;23(11):4079–4095. doi: 10.1105/tpc.111.090480. [DOI] [PMC free article] [PubMed] [Google Scholar]
- 10.Benn G, et al. A key general stress response motif is regulated non-uniformly by CAMTA transcription factors. Plant J. 2014;80(1):82–92. doi: 10.1111/tpj.12620. [DOI] [PMC free article] [PubMed] [Google Scholar]
- 11.Yang T, Poovaiah BW. A calmodulin-binding/CGCG box DNA-binding protein family involved in multiple signaling pathways in plants. J Biol Chem. 2002;277(47):45049–45058. doi: 10.1074/jbc.M207941200. [DOI] [PubMed] [Google Scholar]
- 12.Rodríguez-Concepción M, Boronat A. Elucidation of the methylerythritol phosphate pathway for isoprenoid biosynthesis in bacteria and plastids. A metabolic milestone achieved through genomics. Plant Physiol. 2002;130(3):1079–1089. doi: 10.1104/pp.007138. [DOI] [PMC free article] [PubMed] [Google Scholar]
- 13.Xiao Y, et al. Retrograde signaling by the plastidial metabolite MEcPP regulates expression of nuclear stress-response genes. Cell. 2012;149(7):1525–1535. doi: 10.1016/j.cell.2012.04.038. [DOI] [PubMed] [Google Scholar]
- 14.Lemos M, et al. The pastidial retrograde signal MEcPP is a regulator of SA and JA crosstalk. J Exp Bot. 2016;67(5):1557–1566. doi: 10.1093/jxb/erv550. [DOI] [PMC free article] [PubMed] [Google Scholar]
- 15.Walley J, et al. Plastid-produced interorgannellar stress signal MEcPP potentiates induction of the unfolded protein response in endoplasmic reticulum. Proc Natl Acad Sci USA. 2015;112(19):6212–6217. doi: 10.1073/pnas.1504828112. [DOI] [PMC free article] [PubMed] [Google Scholar]
- 16.Wildermuth MC, Dewdney J, Wu G, Ausubel FM. Isochorismate synthase is required to synthesize salicylic acid for plant defence. Nature. 2001;414(6863):562–565. doi: 10.1038/35107108. [DOI] [PubMed] [Google Scholar]
- 17.Kilian J, et al. The AtGenExpress global stress expression data set: Protocols, evaluation and model data analysis of UV-B light, drought and cold stress responses. Plant J. 2007;50(2):347–363. doi: 10.1111/j.1365-313X.2007.03052.x. [DOI] [PubMed] [Google Scholar]
- 18.Lois LM, Rodríguez-Concepción M, Gallego F, Campos N, Boronat A. Carotenoid biosynthesis during tomato fruit development: Regulatory role of 1-deoxy-D-xylulose 5-phosphate synthase. Plant J. 2000;22(6):503–513. doi: 10.1046/j.1365-313x.2000.00764.x. [DOI] [PubMed] [Google Scholar]
- 19.Estévez JM, Cantero A, Reindl A, Reichler S, León P. 1-Deoxy-D-xylulose-5-phosphate synthase, a limiting enzyme for plastidic isoprenoid biosynthesis in plants. J Biol Chem. 2001;276(25):22901–22909. doi: 10.1074/jbc.M100854200. [DOI] [PubMed] [Google Scholar]
- 20.Doherty CJ, Van Buskirk HA, Myers SJ, Thomashow MF. Roles for Arabidopsis CAMTA transcription factors in cold-regulated gene expression and freezing tolerance. Plant Cell. 2009;21(3):972–984. doi: 10.1105/tpc.108.063958. [DOI] [PMC free article] [PubMed] [Google Scholar]
- 21.Du L, et al. Ca(2+)/calmodulin regulates salicylic-acid-mediated plant immunity. Nature. 2009;457(7233):1154–1158. doi: 10.1038/nature07612. [DOI] [PubMed] [Google Scholar]
- 22.Kim Y, Park S, Gilmour SJ, Thomashow MF. Roles of CAMTA transcription factors and salicylic acid in configuring the low-temperature transcriptome and freezing tolerance of Arabidopsis. Plant J. 2013;75(3):364–376. doi: 10.1111/tpj.12205. [DOI] [PubMed] [Google Scholar]
- 23.Rivas-San Vicente M, Plasencia J. Salicylic acid beyond defence: Its role in plant growth and development. J Exp Bot. 2011;62(10):3321–3338. doi: 10.1093/jxb/err031. [DOI] [PubMed] [Google Scholar]
- 24.Zhang L, Du L, Shen C, Yang Y, Poovaiah BW. Regulation of plant immunity through ubiquitin-mediated modulation of Ca(2+) -calmodulin-AtSR1/CAMTA3 signaling. Plant J. 2014;78(2):269–281. doi: 10.1111/tpj.12473. [DOI] [PubMed] [Google Scholar]
- 25.Ostrovsky D, et al. Effect of oxidative stress on the biosynthesis of 2-C-methyl-D-erythritol-2,4-cyclopyrophosphate and isoprenoids by several bacterial strains. Arch Microbiol. 1998;171(1):69–72. doi: 10.1007/s002030050680. [DOI] [PubMed] [Google Scholar]
- 26.Grieshaber NA, Fischer ER, Mead DJ, Dooley CA, Hackstadt T. Chlamydial histone-DNA interactions are disrupted by a metabolite in the methylerythritol phosphate pathway of isoprenoid biosynthesis. Proc Natl Acad Sci USA. 2004;101(19):7451–7456. doi: 10.1073/pnas.0400754101. [DOI] [PMC free article] [PubMed] [Google Scholar]
- 27.Hulsen T, de Vlieg J, Alkema W. BioVenn - a web application for the comparison and visualization of biological lists using area-proportional Venn diagrams. BMC Genomics. 2008;9:488. doi: 10.1186/1471-2164-9-488. [DOI] [PMC free article] [PubMed] [Google Scholar]
- 28.Katari MS, et al. VirtualPlant: A software platform to support systems biology research. Plant Physiol. 2010;152(2):500–515. doi: 10.1104/pp.109.147025. [DOI] [PMC free article] [PubMed] [Google Scholar]
- 29.Lagisetti C, Urbansky M, Coates RM. The dioxanone approach to (2S,3R)-2-C-methylerythritol 4-phosphate and 2,4-cyclodiphosphate, and various MEP analogues. J Org Chem. 2007;72(26):9886–9895. doi: 10.1021/jo0711900. [DOI] [PubMed] [Google Scholar]
- 30.Savchenko T, et al. Arachidonic acid: An evolutionarily conserved signaling molecule modulates plant stress signaling networks. Plant Cell. 2010;22(10):3193–3205. doi: 10.1105/tpc.110.073858. [DOI] [PMC free article] [PubMed] [Google Scholar]
- 31.Czechowski T, Stitt M, Altmann T, Udvardi MK, Scheible WR. Genome-wide identification and testing of superior reference genes for transcript normalization in Arabidopsis. Plant Physiol. 2005;139(1):5–17. doi: 10.1104/pp.105.063743. [DOI] [PMC free article] [PubMed] [Google Scholar]
- 32.Wrzaczek M, et al. Transcriptional regulation of the CRK/DUF26 group of receptor-like protein kinases by ozone and plant hormones in Arabidopsis. BMC Plant Biol. 2010;10:95. doi: 10.1186/1471-2229-10-95. [DOI] [PMC free article] [PubMed] [Google Scholar]
- 33.Walley JW, et al. The chromatin remodeler SPLAYED regulates specific stress signaling pathways. PLoS Pathog. 2008;4(12):e1000237. doi: 10.1371/journal.ppat.1000237. [DOI] [PMC free article] [PubMed] [Google Scholar]
- 34.Mishiba K, et al. Defects in IRE1 enhance cell death and fail to degrade mRNAs encoding secretory pathway proteins in the Arabidopsis unfolded protein response. Proc Natl Acad Sci USA. 2013;110(14):5713–5718. doi: 10.1073/pnas.1219047110. [DOI] [PMC free article] [PubMed] [Google Scholar]


