Significance
In resting T cells, CRBN normally represses expression of the Kv1.3 potassium channel by regulating histone modifications to prevent hyperactivation of T cells. It does this by controlling recruitment of EZH1 to the potassium channel region of the Kcna3 gene (or locus). However, lack of CRBN causes up-regulation of Kv1.3 expression, which in turn increases potassium flux, thereby triggering increased calcium flux during T-cell activation.
Keywords: T-cell activation, CRBN, Kv1.3, calcium flux, potassium flux
Abstract
The role of cereblon (CRBN) in T cells is not well understood. We generated mice with a deletion in Crbn and found cereblon to be an important antagonist of T-cell activation. In mice lacking CRBN, CD4+ T cells show increased activation and IL-2 production on T-cell receptor stimulation, ultimately resulting in increased potassium flux and calcium-mediated signaling. CRBN restricts T-cell activation via epigenetic modification of Kcna3, which encodes the Kv1.3 potassium channel required for robust calcium influx in T cells. CRBN binds directly to conserved DNA elements adjacent to Kcna3 via a previously uncharacterized DNA-binding motif. Consequently, in the absence of CRBN, the expression of Kv1.3 is derepressed, resulting in increased Kv1.3 expression, potassium flux, and CD4+ T-cell hyperactivation. In addition, experimental autoimmune encephalomyelitis in T-cell–specific Crbn-deficient mice was exacerbated by increased T-cell activation via Kv1.3. Thus, CRBN limits CD4+ T-cell activation via epigenetic regulation of Kv1.3 expression.
Recent studies have identified cereblon (CRBN) as a thalidomide-binding protein (1, 2). CRBN is expressed in the cytoplasm, nucleus, and peripheral membranes of a wide variety of cells and tissues (1, 3–5). CRBN forms an E3 ubiquitin ligase complex with damaged DNA-binding protein (DDB) 1 and Cul4A, and this complex is involved in limb outgrowth and controls fibroblast growth factor 8 expression in zebrafish and chicks (1). When thalidomide binds to CRBN, it inhibits formation of the E3 ubiquitin ligase complex, which in turn reduces the activity of the ubiquitin ligase and results in defective limb development (1).
Recent work suggests that immunomodulatory drugs (IMiDs) stimulate increased IL-2 production in T cells by binding to CRBN. This binding alters the substrate specificity of CRBN-containing ubiquitin ligase complexes (6, 7) even though IMiDs reduce the overall activity of E3 ubiquitin ligase (1). As a result, binding promotes abnormal degradation of the Ikaros zinc finger proteins 1 and 3 (IKZF1 and IKZF3), which in turn increases IL-2 production in T cells (6–8). However, although the CRBN-mediated effects of IMiDs are known, the physiological role of CRBN in T cells remains unclear.
We deleted the Crbn gene from murine T cells to examine the physiological role of CRBN during T-cell activation, with the aim of gaining new insight into the regulation of potassium flux during T-cell signaling. Deletion of Crbn from T cells led to IL-2 production and differentiation of CD4+ T cells into Th17 effector cells, as well as worsening of the phenotype associated with experimental autoimmune encephalitis (EAE). CRBN represses T-cell activation by binding to the chromosomal regions adjacent to the Kcna3 locus, a gene encoding the Kv1.3 potassium channel, which participates in calcium influx in T cells. The binding of CRBN to Kcna3 leads to epigenetic modification of the Kcna3 locus and reduces the expression of Kv1.3. Triggering of TCR signaling in CRBN-deficient T cells results in (i) increased potassium and calcium flux, (ii) increased activation of transcription factor NF-AT, and (iii) increased production of IL-2. Our data identify CRBN as an important regulator of T-cell activation, restricting calcium influx via epigenetic repression of Kcna3.
Results
CRBN Deficiency Does Not Affect T-Cell Development, but Does Increase T-Cell Activation.
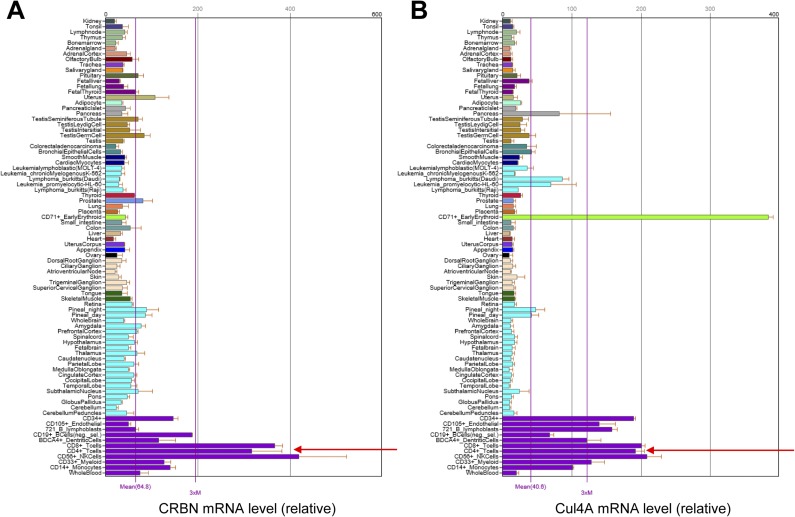
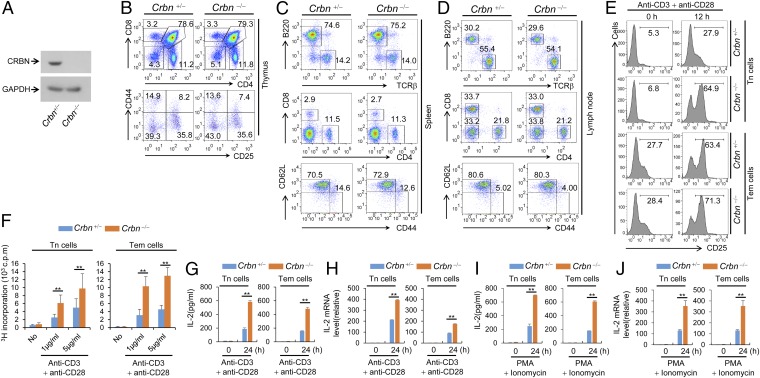
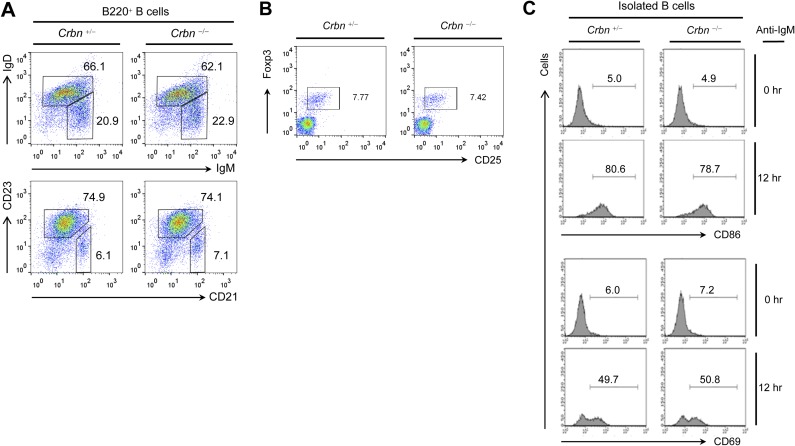
Analysis of the relative levels of CRBN transcripts in multiple tissue types using the Novartis BioGPS expression array database (biogps.org) (9) suggested that the expression of CRBN mRNA is higher in lymphoid cells, including CD4+ T cells, than in other cell types (Fig. S1A). Thus, we used Crbn gene-targeted mice to examine the effect of CRBN deficiency in T-cell development and activation. First, we confirmed the loss of CRBN protein from CD4+ T cells isolated from Crbn-deficient (Crbn−/−) mice (Fig. 1A). There were no obvious changes in thymic T-cell development (Fig. 1B). In addition, peripheral T-cell and B-cell populations in 6- to 8-wk-old Crbn−/− mice were no different from those in 6- to 8-wk-old littermate control (Crbn+/−) mice (Fig. 1 C and D and Fig. S2A). Moreover, the Foxp3+ CD4+ T-cell population in the spleens of Crbn−/− mice was similar to that in Crbn+/− mice, suggesting that CRBN does not affect the selection of T cells during development (Fig. S2B). However, when CRBN-deficient CD4+ T cells, including CD4+ naïve T (Tn) cells and effector memory T (Tem) cells, from Crbn−/− mice were stimulated with anti-CD3 and anti-CD28 antibodies, both CD4+ Tn and Tem cells expressed more CD25 on the cell surface compared with the control CD4+ Tn and Tem cells from their Crbn+/− littermates (Fig. 1E). In contrast to T cells, on B cells a loss of CRBN did not affect the activation-induced cell surface expression of CD69 and CD86 (Fig. S2C).
Fig. S1.
CD4+ T cells express higher levels of CRBN and Cul4A than other cells. Analysis of the relative amounts of CRBN (A) and Cul4A (B) transcripts in multiple tissue types using the Novartis BioGPS expression array database shows that CRBN and Cul4A mRNA expression levels are higher in lymphoid cells, including CD4+ T cells, than in other cell types.
Fig. 1.
CRBN deficiency does not affect T-cell development, but does increase T-cell activation. (A) Loss of CRBN protein expression in CD4+ T cells from Crbn−/− mice was confirmed by immunoblot analysis with an anti-CRBN antibody. (B) T-cell development in the thymus was analyzed by flow cytometry. (C and D) Lymphocytes in the spleen (C) and lymph nodes (D) were analyzed by flow cytometry. (E) CD4+ Tn and Tem cells from Crbn−/− mice and Crbn+/− mice were stimulated with anti-CD3 and anti-CD28 antibodies for the indicated times, after which cell surface expression of CD25 was analyzed by flow cytometry. (F) Proliferation of CD4+ Tn and Tem cells stimulated with anti-CD3 and anti-CD28 antibodies was measured by [3H]thymidine incorporation. (G–J) IL-2 secretion and IL-2 mRNA expression in CD4+ Tn and Tem cells stimulated by either anti-CD3 or anti-CD28 antibodies (G and H) or PMA and ionomycin (I and J) were analyzed by ELISA and quantitative RT-PCR. Data are representative of two (A), four (B–D), or three (E–J) independent experiments. Results are expressed as the mean ± SD. *P < 0.05; **P < 0.01, unpaired two-tailed Student’s t test.
Fig. S2.
Crbn deficiency does not affect B-cell and Foxp3+CD4+ regulatory T-cell populations and B-cell activations. (A) Total spleen cells were isolated from Crbn−/− and Crbn+/− mice. B-cell populations, including immature B cells (B220+IgM+IgD−), mature B cells (B220+IgM+IgD+), follicular B cells (B220+CD21lowCD23+), and marginal zone B cells (B220+CD21+CD23−), were analyzed by flow cytometry. (B) Total spleen cells were isolated from Crbn−/− and Crbn+/− mice, and the Foxp3+CD4+ regulatory T-cell population was examined by flow cytometry. (C) B cells were isolated from the spleen of Crbn−/− mice and Crbn+/− mice. Isolated B cells were stimulated with an anti-IgM Fab antibody (20 μg/mL) for the indicated times, and the cell surface expression of CD86 and CD69 was analyzed by flow cytometry. Data are representative of three independent experiments.
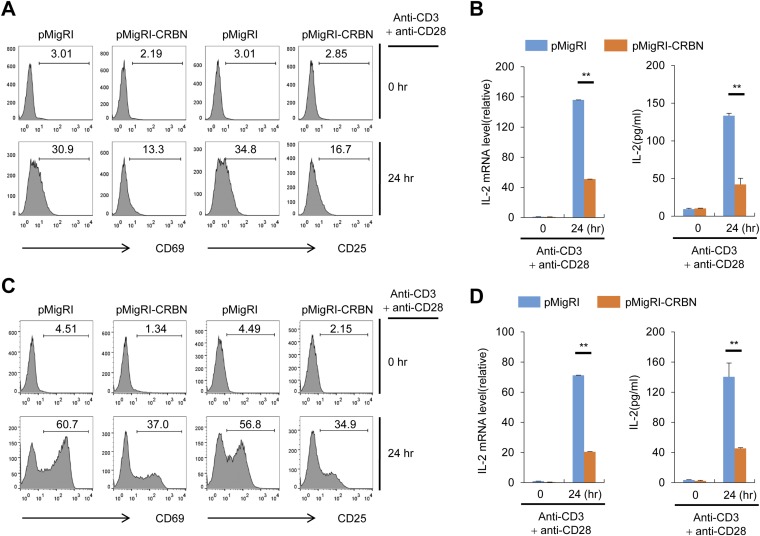
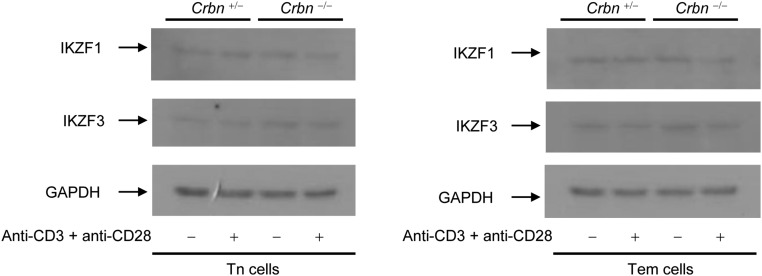
Along with the expression of activation markers on the cell surface, anti-CD3– and anti-CD28–stimulated CD4+ Tn and Tem cells from CRBN-deficient mice were more proliferative (Fig. 1F) and secreted higher levels of IL-2 compared with CD4+ Tn and Tem cells, respectively, from their littermate control mice (Fig. 1G) and showed increased transcription of IL-2 mRNA (Fig. 1H). Moreover, stimulation with phorbol 12-myristate 13-acetate (PMA) and ionomycin, which bypasses TCR- and CD28-mediated proximal signaling events, still led to increased IL-2 secretion and increased IL-2 mRNA levels in CRBN-deficient CD4+ Tn and Tem cells (Fig. 1 I and J). Consistent with these data, CRBN overexpression significantly reduced activation-induced expression of cell surface markers, such as CD69 and CD25, and IL-2 production in Jurkat T cells (Fig. S3 A and B) and in mouse CD4+ T cells (Fig. S3 C and D). The increased IL-2 production was not caused by alterations in IKZF1 and IKZF3 protein levels, because CRBN deficiency did not affect these proteins in CD4+ Tn and Tem cells (Fig. S4).
Fig. S3.
CRBN overexpression reduces anti-CD3/CD28–induced T cell activation. (A) Jurkat T cells overexpressing CRBN and control Jurkat T cells were activated with anti-CD3 and anti-CD28 antibodies for 24 h. The cell surface expression of activation markers (CD69 and CD25) was then analyzed by flow cytometry. (B) IL-2 mRNA expression and IL-2 production were analyzed by RT-PCR and ELISA, respectively. (C) The CRBN overexpression cassette was introduced into mouse primary CD4+ T cells using a recombinant retrovirus. The cells were then stimulated with anti-CD3 and anti-CD28 antibodies. The expression of activation markers (CD69 and CD25) was then analyzed after sorting of infected cells. (D) Expression of IL-2 mRNA and IL-2 production were analyzed by RT-PCR and ELISA, respectively. Data are representative of three independent experiments. Results are expressed as mean ± SD. **P < 0.01, unpaired two-tailed Student’s t test.
Fig. S4.
CRBN deficiency does not affect IKZF1 and IKZF3 protein levels in CD4+ Tn and Tem cells. Total protein was isolated from CD4+ Tn and Tem cells of Crbn−/− and Crbn+/− mice. IKZF1 and IKZF3 protein levels in the isolated CD4+ Tn and Tem cells were analyzed by immunoblot analysis with anti-IKZF1 and anti-IKZF3 antibodies. GAPDH served as an internal protein loading control. Data are representative of three independent experiments.
CRBN Regulates the TCR-Induced NF-AT Activation Pathway Through Kv1.3.
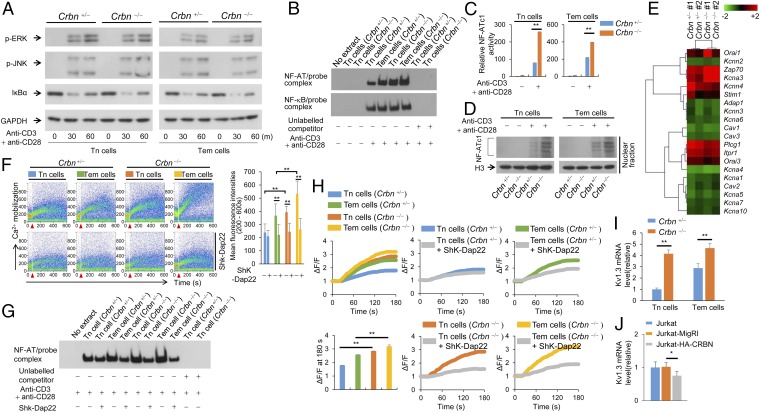
We examined the role of CRBN in various TCR signaling pathways in CD4+ Tn and Tem cells isolated from Crbn−/− and Crbn+/− mice. We found that TCR-induced phosphorylation of ERK and JNK was unaffected in CRBN-deficient CD4+ Tn and Tem cells (Fig. 2A). The NF-κB pathway in CD4+ T cells also was unaffected, because IκBα degradation (Fig. 2A) and NF-κB DNA-binding activity (Fig. 2B) were unchanged in CRBN-deficient CD4+ Tn and Tem cells. However, we found it interesting that NF-AT DNA binding (Fig. 2 B and C) and nuclear localization (Fig. 2D) in CRBN-deficient CD4+ Tn and Tem cells were increased after activation, suggesting that loss of CRBN in CD4+ T cells affects primarily the NF-AT activation signaling pathway.
Fig. 2.
CRBN deficiency increases NF-AT activation during anti-CD3/CD28–induced T-cell activation. (A) Immunoblot analyses were performed to examine ERK and JNK phosphorylation and IκBα degradation in primary CD4+ Tn and Tem cells from the Crbn−/− and Crbn+/− mice after stimulation with anti-CD3 and anti-CD28 antibodies for the indicated times. (B) CD4+ Tn and Tem cells were stimulated with anti-CD3 and anti-CD28 antibodies for 12 h (NF-AT) or 1 h (NF-κB). After activation, the nuclear fractions were isolated, and the DNA-binding activity of NF-AT (Upper) or NF-κB (Lower) was analyzed by electrophoretic mobility-shift analysis (EMSA). (C) The DNA-binding activity of NF-AT was quantified using the TransAM Transcription Factor ELISA Kit (Active Motif) with an NF-AT–specific probe and antibodies. (D) Nuclear localization of NF-ATc1 was analyzed by immunoblot analysis. (E) Heat map data for TCR signaling-related genes differentially regulated by CRBN deficiency in unstimulated CD4+ Tn cells (CD4+ Tn cells pooled from two mice for each sample). (F) Calcium flux in isolated CD4+ Tn and Tem cells was analyzed by Fluo3-AM with or without the addition of Kv1.3 inhibitor (100 nM Shk-Dap22). The arrow indicates activation initiated by the addition of anti-hamster IgG to anti-CD3– and anti-CD28–coated CD4+ T cells. (G) CD4+ Tn and Tem cells were stimulated with anti-CD3 and anti-CD28 antibodies for 12 h. After activation in the presence or absence of a Kv1.3 inhibitor (100 nM Shk-Dap22), the nuclear fractions were isolated, and the DNA-binding activity of NF-AT was analyzed by EMSA. (H) Potassium flux in isolated CD4+ Tn and Tem cells was analyzed using a FluxOR Thallium Detection Kit in the presence or absence of a Kv1.3 inhibitor (100 nM Shk-Dap22). (I) Kv1.3 mRNA levels in CD4+ Tn and Tem cells from Crbn−/− and Crbn+/− mice were analyzed by quantitative RT-PCR. (J) Levels of human Kv1.3 mRNA in CRBN-overexpressing Jurkat T cells and control Jurkat T cells were analyzed by quantitative RT-PCR. Data are representative of three (A–D and G–J) or four (F) independent experiments. Results are expressed as mean ± SD. *P < 0.05; **P < 0.01, unpaired two-tailed Student’s t test.
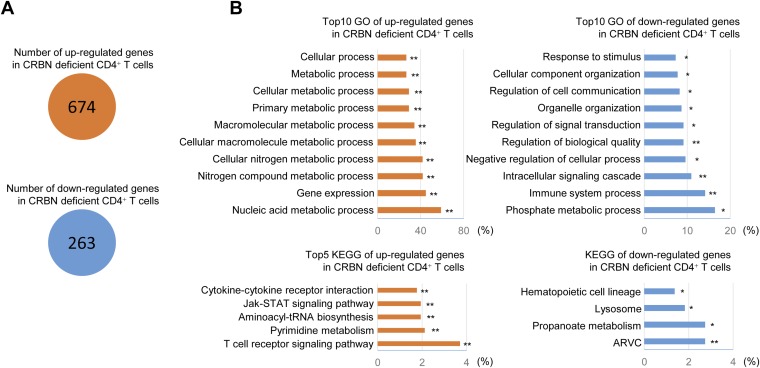
To identify the genes responsible for the increased activation of NF-AT observed in CRBN-deficient CD4+ T cells, we examined gene expression patterns in CD4+ Tn cells from CRBN-deficient mice and their normal littermates. We identified 674 down-regulated genes and 263 up-regulated genes in CRBN-deficient CD4+ Tn cells (Fig. S5A). When these differentially expressed genes were categorized, we found that genes related to TCR signaling were affected in the absence of CRBN (Fig. S5B). Of these TCR signaling-related genes, Zap70 and Kcna3 showed the greatest differences in CRBN-deficient CD4+ Tn cells (Fig. 2E). Although Zap70 is involved in most TCR signaling pathways, only NF-AT was specifically affected by CRBN deficiency. Thus, we narrowed our focus to Kv1.3, because this channel protein is involved in potassium flux, which is linked to calcium flux.
Fig. S5.
Differentially expressed gene analysis. (A) Total number of genes showing up- regulation or down-regulation in CRBN-deficient T cells. (B) Top 10 GO biological process categories involving up-regulated or down-regulated genes (Upper), and top five KEGG pathway categories involving up-regulated or down-regulated genes (Lower). All GO groups and KEGG groups demonstrated enhanced statistical representation (EASE score value <0.01). Bars represent the proportion of genes involved in each category, for which statistical significance and the number of genes is indicated. *P < 0.01; **P < 0.001.
Consistent with increased NF-AT activation, CD4+ Tn and Tem cells from Crbn−/− mice also had increased calcium flux compared with CD4+ Tn and Tem cells from Crbn+/− mice (Fig. 2F). This finding suggests that in the absence of CRBN, increased TCR-induced CD4+ T-cell activation results from increased calcium flux and the subsequent increase of NF-AT activation (Fig. 2G). In Tem cells, the voltage-dependent Kv1.3 channel is essential for optimal calcium flux during TCR stimulation, because these cells express more Kv1.3 compared with Tn cells (10). In addition, calcium flux was reduced in CRBN-deficient CD4+ Tn cells when Shk-Dap22, a specific inhibitor of Kv1.3 (11), was added, whereas calcium flux in control CD4+ Tn cells was barely affected (Fig. 2F). Calcium flux was also increased in CD4+ Tem cells deficient in CRBN compared with littermate control CD4+ Tem cells; moreover, Shk-Dap22 reduced calcium flux in CRBN-deficient CD4+ Tem cells to the same degree as in littermate control CD4+ Tem cells. Finally, increased NF-AT activity in activated CRBN-deficient CD4+ Tn and Tem cells, compared with the littermate control CD4+ Tn and Tem cells, was reduced by Shk-Dap22 in a manner similar to that observed with calcium flux (Fig. 2G).
To determine whether Kv1.3 function was also affected, we measured potassium mobilization directly. Potassium flux was also greater in CRBN-deficient CD4+ Tn and Tem cells compared with the littermate control CD4+ Tn and Tem cells and, similar to what we observed with calcium flux, this increase in potassium mobilization was reduced when Shk-Dap22 was added (Fig. 2H). Moreover, Kv1.3 mRNA expression was higher in CRBN-deficient CD4+ Tn and Tem cells than in littermate control CD4+ Tn and Tem cells (Fig. 2I). Thus, CRBN controls Kv1.3 expression in both CD4+ Tn and Tem cells, which affects potassium flux coupled to calcium flux. Consistent with this observation, overexpression of CRBN in Jurakt T cells significantly reduced Kv1.3 mRNA expression (Fig. 2J).
CRBN Controls Histone Modification of Kcna3 Regulatory Regions in CD4+ T Cells.
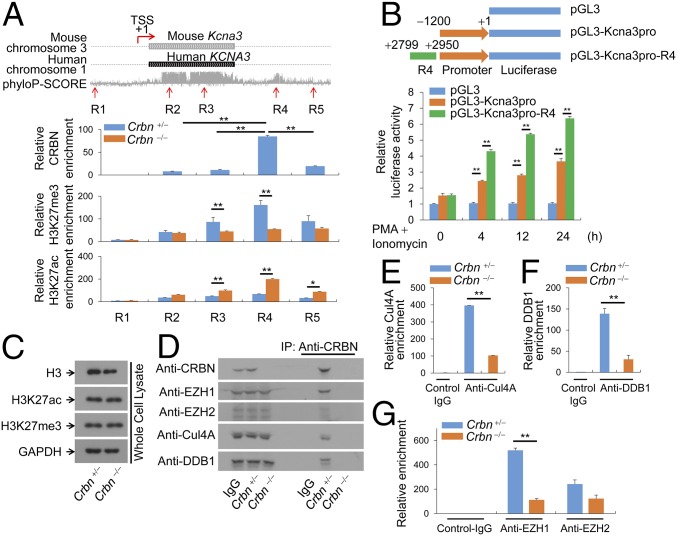
Recent studies have shown that Cul4A, which binds to CRBN, plays a role in histone modification (12–15). Moreover, analysis of the relative levels of Cul4A transcripts in multiple tissue types using the Novartis BioGPS expression array database (9) revealed that, like CRBN, Cul4A is expressed to the greatest extent in lymphoid cells (including CD4+ T cells) compared with other cell types (Fig. S1B). This led us to investigate whether CRBN is an epigenetic regulator of the Kcna3 gene, which encodes Kv1.3. To investigate this possibility, we used chromatin immunoprecipitation (ChIP) analysis to measure the trimethylation of lysine 27 on histone H3 (H3K27me3), which inhibits gene transcription, and the acetylation of lysine 27 on histone H3 (H3K27ac), which activates gene transcription. In the Kcna3 region of CD4+ T cells from Crbn+/− and Crbn−/− mice, we analyzed the status of H3K27 modification at five selected regions, including one 5′ upstream region (R1), two ORF regions (R2 and R3), and two 3′ downstream regions (R4 and R5), on Kcna3 itself (Fig. 3A). In addition, we verified that CRBN is recruited to Kcna3 (Fig. 3A), because CRBN regulates the expression of Kv1.3 mRNA (Fig. 2 I and J).
Fig. 3.
CRBN regulates histone modification at Kv1.3 regulatory regions. (A) The Kcna3 region in the mouse and human chromosomes. The phyloP-SCORE shows evolutionary conservation of the bases. TSS, transcription start site. Five regions on mouse Kcna3 are marked as R1, R2, R3, R4, and R5. ChIP was performed with anti-CRBN, anti-H3K27me3, or anti-H3K27ac antibodies, and quantitative PCR analyses for R1–R5 regions were performed. (B) Jurkat T cells were transfected with the indicated reporter plasmid and pRenilla. The cells were then activated with PMA and ionomycin. Renilla luciferase activity served as a reference to normalize gene expression. (C) H3K27me3 and H3K27ac levels in Crbn−/− and Crbn+/− CD4+ T cells were examined by immunoblot analysis with anti-H3K27me3 and anti-H3K27ac antibodies. (D) Binding of CRBN to Cul4A, EZH1, EZH2, or DDB1 in nuclear extracts of CD4+ T cells was analyzed by immunoblot analysis. (E–G) Enrichment of Cul4A (E), DDB1 (F), or EZH1 and EZH2 (G) at Kcna3 was examined by ChIP using anti-Cul4A, anti-DDB1, or anti-EZH1 and anti-EZH2 antibodies. Chromatin was prepared from CRBN-deficient and littermate control CD4+ T cells. After ChIP, DNA fragments were measured by quantitative RT-PCR. Data are representative of two (A) or three (B–G) independent experiments. Results are expressed as mean ± SD. *P < 0.05; **P < 0.01, unpaired two-tailed Student’s t test.
Our results indicate that the CRBN protein is enriched at the R4 region, which is a 3′ downstream conserved region of Kcna3 (Fig. 3A). Interestingly, CRBN deficiency altered the modification of H3K27 in the R4 region of CD4+ T cells (Fig. 3A). At regions inside the Kcna3 ORF, including the R3 region, loss of CRBN significantly reduced H3K27me3 levels, whereas H3K27ac levels increased significantly (Fig. 3A). Reporter gene analysis revealed that the R4 region can enhance the Kcna3 promoter (Fig. 3B).
Finally, we performed immunoblot analysis with H3K27ac- and H3K27me3-specific antibodies to determine whether CRBN alters global H3K27 modification. We found no global changes in H3K27 modification in CRBN-deficient CD4+ T cells (Fig. 3C), suggesting that CRBN does not regulate the global pattern of histone modifications in CD4+ T cells, similar to what has been reported about the regulation of histone modification by MSI4/FVE (12).
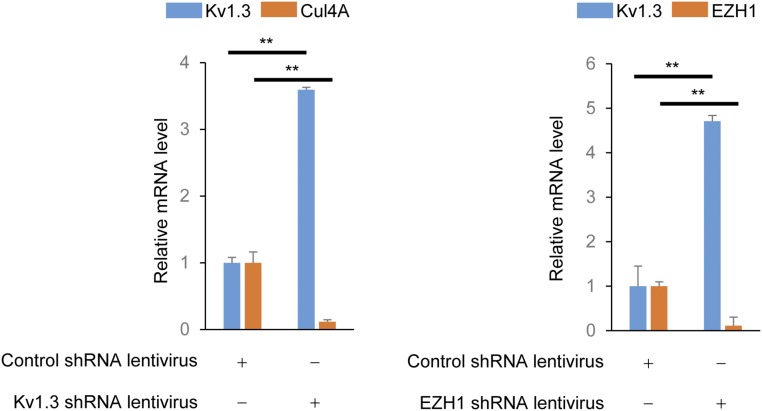
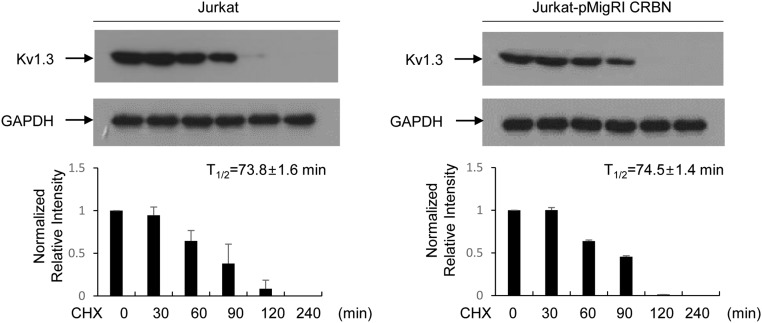
Because H3K27 methylation is mediated by EZH1 or EZH2, we attempted to identify the histone methyltransferase responsible for modifying H3K27me3 at Kcna3. We first examined the binding of CRBN to EZH1 or EZH2 in nuclear fractions, and found that CRBN bound to Cul4A, DDB1, and EZH1, but only weakly to EZH2 (Fig. 3D). In addition, ChIP analysis showed that Cul4A (Fig. 3E) and DDB1 (Fig. 3F) were recruited to Kcna3 in CD4+ T cells; however, the loss of CRBN adversely affected recruitment of Cul4A (Fig. 3E) and DDB1 (Fig. 3F). In addition, EZH1 was more enriched than EZH2 at the R4 region; however, EZH1 recruitment to Kcna3 was markedly reduced when CRBN was absent (Fig. 3G). Consistent with these results, down-regulation of EZH1 and Cul4A in CD4+ T cells increased Kv1.3 mRNA levels (Fig. S6). In addition, the half-life of the Kv1.3 protein was not altered by CRBN overexpression (Fig. S7).
Fig. S6.
Down-regulation of Cul4A and EZH1 in CD4+ T cells increases Kv1.3 mRNA expression level in CD4+ T cells. Here CD4+ T cells were isolated from C57BL/6 mice and shRNA for Cul4A (Sc-60470-V; Santa Cruz Biotechnology) or EZH1 (Sc-38188-V; Santa Cruz Biotechnology) was introduced into isolated CD4+ T cells using recombinant lentiviruses. Scramble shRNA lentivirus (Sc-108080; Santa Cruz Biotechnology) served as the control. After the lentivirus-mediated shRNA delivery, CD4+ T cells were cultured for 3 d with IL-7 (10 ng/mL), and total cellular RNAs were isolated from the cells. With the isolated RNAs, Kv1.3 and Cul4A or Kv1.3 and EZH1 mRNA levels were analyzed by quantitative RT-PCR analysis. GAPDH served as an internal gene expression control. Data are representative of three independent experiments. The results are expressed as mean ± SD. **P < 0.01, unpaired two-tailed Student’s t test.
Fig. S7.
CRBN does not affect Kv1.3 protein half-life. Jurkat-MigR1 and Jurkat-HA-CRBN cells were treated with cycloheximide (CHX; 20 μg/mL), and Kv1.3 protein levels in those cells were analyzed by using immunoblot analysis with anti-Kv1.3 antibody. GAPDH served as an internal control. Data are representative of three independent experiments. Results are expressed as mean ± SD.
The C-Terminal Domain of CRBN Is Crucial for CRBN Enrichment on Kcna3 Chromatin.
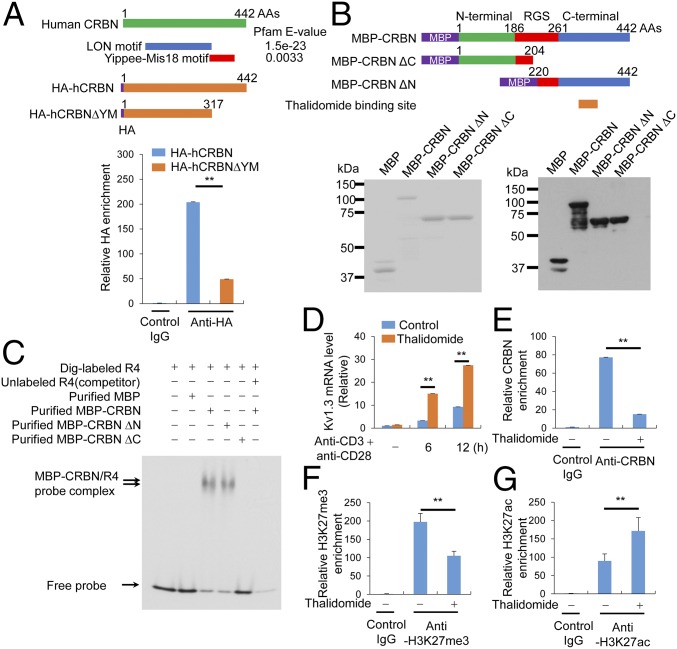
Analysis of the CRBN amino acid sequence using the Pfam domain library revealed the presence of the LON motif and Yippee, a novel DNA-binding motif (Fig. 4A). Moreover, the DNA-binding motif of CRBN is situated in an area in which substrates generally bind to WD40 DDB1/CUL4-associated factors, such as DDB2, to engage DNA (16). Therefore, we tested whether this potential DNA-binding motif of CRBN is required for binding to the Kcna3 R4 region. In Jurkat T cells, deleting the Yippee-Mis18 motif from CRBN abolished its ability to bind Kcna3 chromatin (Fig. 4A). In addition, to test whether CRBN can directly bind to Kcna3 DNA, we expressed maltose-binding protein (MBP)-tagged full-length CRBN, the N terminus of CRBN, and the C terminus of CRBN in E. coli and purified the proteins. The purity of the proteins, as assessed by SDS/PAGE and Coomassie blue staining, was >90% (Fig. 4B). The purified proteins were readily detected by immunoblot analysis with anti-MBP antibodies (Fig. 4B).
Fig. 4.
The C-terminal domain of CRBN is crucial for CRBN enrichment in Kcna3 chromatin. (A) The DNA-binding motif in CRBN was analyzed using a Pfam domain library (Upper), and HA-tagged CRBN enrichment on Kcna3 chromatin in Jurkat T cells was examined by ChIP (Lower). (B) MBP-CRBN proteins [i.e., full-length, C-terminal region-deleted (amino acids 1–204), and N-terminal region-deleted (amino acids 220–442) CRBN proteins] were expressed in E. coli and purified with MBPTrap HP (GE Healthcare Life Sciences). The purified proteins were analyzed by SDS/PAGE and Coomassie blue staining (Left) or immunoblot analysis (Right) with an anti-MBP monoclonal antibody (New England Biolabs). (C) EMSA was performed with the purified MBP-CRBN proteins and a Dig-labeled R4 DNA fragment. Analysis was performed using DIG Gel Shift Kit, 2nd generation (Roche). Unlabeled competition demonstrated that the EMSA probes specifically bound to the MBP-CRBN proteins. (D) Kv1.3 levels in CD4+ T cells activated with anti-CD3 and anti-CD28 antibodies were examined by quantitative RT-PCR. Before activation, CD4+ T cells were pretreated with 40 μM thalidomide for 6 h. (E) Relative levels of CRBN enrichment on Kcna3 chromatin from cells treated with or without thalidomide (40 μM) for 6 h were examined in ChIP assays incorporating anti-CRBN antibodies. (F and G) Relative levels of histone modification on Kcna3 chromatin in CD4+ T cells were examined in ChIP assays using anti-H3K27me3 (F) and anti-H3K27ac (G) antibodies after treatment with or without thalidomide for 6 h. Data are representative of two (A and B) or four (C–G) independent experiments. Results are expressed as mean ± SD. *P < 0.05; **P < 0.01, unpaired two-tailed Student’s t test.
Using these recombinant CRBN constructs, we determined whether CRBN binds directly to the R4 region of Kcna3 DNA. Full-length CRBN and the C-terminal CRBN fragment containing the Yippee-Mis18 motif, but not the N-terminal region, was able to bind to the Kcna3 DNA (Fig. 4C). Therefore, CRBN directly binds to the Kcna3 regulatory region R4 via the C-terminal Yippee-Mis18 motif (Fig. 4C). The thalidomide-binding region in CRBN is located within the C terminus of CRBN and is essential for CRBN binding to Kcna3 DNA; therefore, we hypothesized that thalidomide prevents CRBN from binding to Kcna3. Consistent with this hypothesis, we found that long-term thalidomide treatment (>6 h) increased activation-induced Kv1.3 expression in CD4+ T cells (Fig. 4D) and reduced recruitment of CRBN to Kcna3 R4 (Fig. 4E). Previous reports have shown that thalidomide affects histone modifications (17, 18), and our present results demonstrate that thalidomide alters the epigenetic modifications of the Kcna3 locus specifically (Fig. 4 F and G).
Crbn Deficiency Exacerbates EAE.
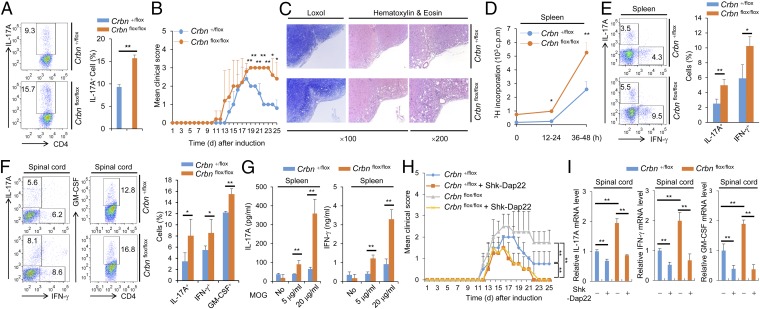
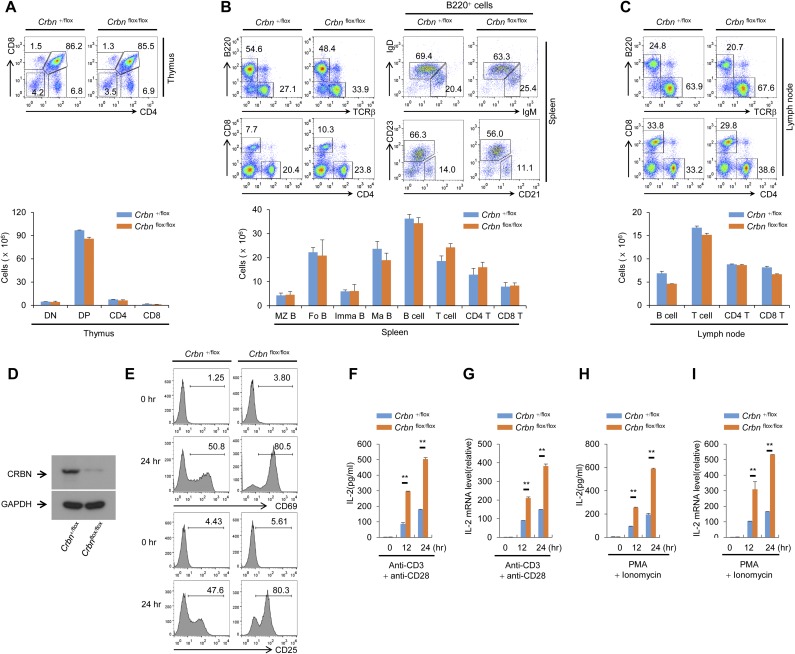
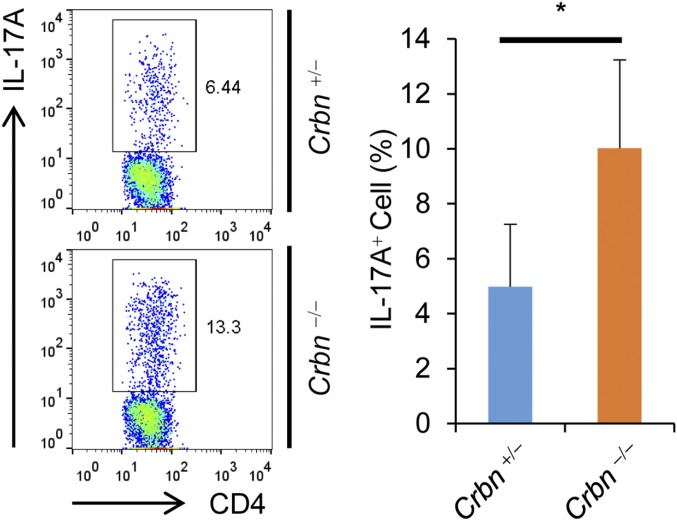
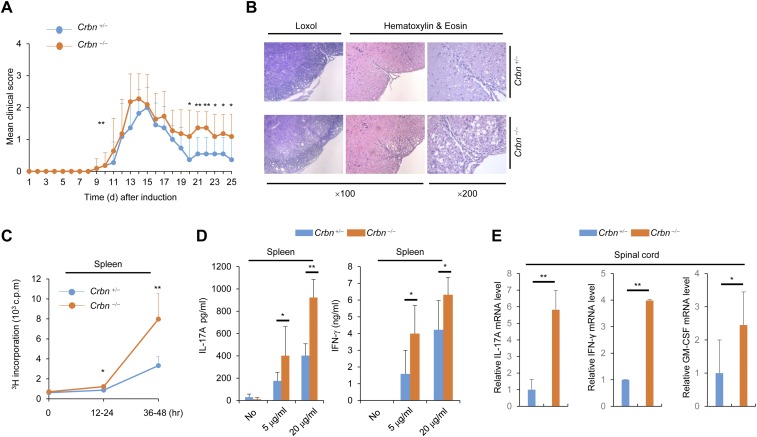
T-cell activation is important for disease progression in the mouse model for EAE, and the Th17 cell population is particularly important. In addition, NF-AT is important for Th17 cell differentiation. We found that CD4+ T cells lacking CRBN have a greater potential for differentiation into Th17 cells in vitro (Fig. 5A). Thus, we tested the susceptibility of Crbn-deficient mice for developing EAE, which is mediated by Th17 cells. We used T-cell–specific Crbn-deficient (Crbnflox/flox;Cd4-Cre) mice, because CRBN deficiency can affect the activity of other immune cells even though CRBN is preferentially expressed in T cells. In addition, T-cell–specific Crbn deficiency does not affect thymic T-cell development (Fig. S8A), nor does it alter the peripheral T-cell and B-cell populations in the littermate control (Crbn+/flox;Cd4-Cre) mice (Fig. S8 B and C). The absence of CRBN protein expression in CD4+ T cells from Crbnflox/flox;Cd4-Cre mice was confirmed by immunoblot analysis (Fig. S8D). In addition, surface expression of activation markers, such as CD69 and CD25 (Fig. S8E), and IL-2 production (Fig. S8 F–I) were higher in CD4+ T cells from T-cell–specific Crbnflox/flox;Cd4-Cre mice than in CD4+ T cells from Crbn+/flox;Cd4-Cre mice. Moreover, consistent with the increased T-cell activation observed in vitro, Crbnflox/flox;Cd4-Cre mice exhibited exacerbated and sustained EAE symptoms (Fig. 5 B and C). Mice lacking Crbn exhibited increased proliferation of peripheral myelin oligodendrocyte glycoprotein (MOG)35–55-specific T cells, as analyzed by [3H]thymidine incorporation after MOG35–55 immunization and recall stimulation ex vivo (Fig. 5D). The percentages of Th17 and Th1 cells in the periphery and spinal cord of immunized mice were significantly higher in Crbnflox/flox;Cd4-Cre mice than in Crbn+/flox;Cd4-Cre mice (Fig. 5 E and F). In addition, the population of GM-CSF–producing CD4+ T cells was also higher in the spinal cords of Crbnflox/flox;Cd4-Cre mice than in the spinal cords of Crbn+/flox;Cd4-Cre mice (Fig. 5F). Moreover, T-cell–specific deletion of Crbn also increased the production of IL-17A and IFN-γ cytokines by peripheral MOG35–55-specific T cells after MOG35–55 immunization and recall stimulation ex vivo (Fig. 5G). In addition, the EAE symptoms were reduced by the Kv1.3-specific inhibitor Shk-Dap22, and worsening of the EAE symptoms in Crbnflox/flox;Cd4-Cre mice was halted to levels seen in the EAE-induced Crbn+/flox;Cd4-Cre mice treated with Shk-Dap22 (Fig. 5 H and I). Crbn−/− mice exhibited effects similar to those seen in Crbnflox/flox;Cd4-Cre mice for in vitro Th17 cell differentiation (Fig. S9) and the EAE mouse model (Fig. S10). Thus, CRBN is an important antagonist of T-cell activation and limits disease pathogenesis in a mouse model for T-cell–mediated autoimmunity.
Fig. 5.
Exacerbated and sustained EAE symptoms in T-cell–specific Crbnflox/flox;Cd4-Cre mice. (A) Flow cytometry of IL-17A–producing CD4+ T cells among the in vitro-differentiated Th17 cell population within CD4+ T cells from Crbnflox/flox;Cd4-Cre (flox/flox) or Crbn+/flox;Cd4-Cre (+/flox) mice. (B) Clinical scores for EAE mice (n = 7 per group). (C) Spinal cord sections. (D) Proliferation of splenocytes in response to MOG35–55, was measured by [3H]thymidine incorporation, at the indicated time points for 12 h. (E) Percentage of CD4+IL-17A+ and CD4+IFN-γ+ T cells in the spleens of mice after EAE induction (n = 3 per group). (F) Percentages of CD4+IL-17A+, CD4+IFN-γ+, and CD4+GM-CSF+ T cells in the spinal cords of mice after EAE induction (n = 3 per group). (G) Concentration of cytokines in the supernatant from splenocyte cultures stimulated with MOG35–55 peptide (n = 3 per group). (H) Clinical scores for EAE mice (n = 8 per group) with or without Shk-Dap22 treatment. (I) Relative mRNA levels of IL-17A, IFN-γ, and GM-CSF in isolated spinal cord mononuclear cells (n = 3 per group). Data are representative of five (A), three (B–G), or two (H and I) independent experiments. Results are expressed as mean ± SD. *P < 0.05; **P < 0.01, unpaired two-tailed Student’s t test.
Fig. S8.
T-cell–specific deletion of Crbn gene does not affect T cell development or activation. (A) T-cell development in the thymus of Crbnflox/flox;Cd4-Cre mice and Crbn+/flox;Cd4-Cre mice was analyzed by flow cytometry. (B and C) Lymphocytes in the spleen (B) and lymph nodes (C) were analyzed by flow cytometry. (D) Loss of CRBN protein expression in CD4+ T cells from T-cell–specific Crbnflox/flox;Cd4-Cre mice was confirmed by immunoblot analysis with an anti-CRBN antibody. (E) CD4+ T cells from T-cell–specific Crbnflox/flox;Cd4-Cre and Crbn+/flox;Cd4-Cre mice were stimulated with anti-CD3 and anti-CD28 antibodies for the indicated times. After activation, surface expression of CD69 and CD25 was analyzed by flow cytometry. (F–I) IL-2 secretion and IL-2 mRNA expression in CD4+ T cells stimulated with either anti-CD3 and anti-CD28 antibodies (F and G) or PMA and ionomycin (H and I) were analyzed by ELISA and quantitative RT-PCR. Data are representative of three independent experiments. Results are expressed as mean ± SD. *P < 0.05; **P < 0.01, Student’s t test.
Fig. S9.
CD4+ T cells from Crbn−/− mice show increased differentiation onto Th17 cells in vitro. CD4+ T cells were isolated from Crbn−/− and Crbn+/− mice and differentiated into Th17 cells as described in the text. IL-17A–producing CD4+ T cells among the in vitro-differentiated Th17 cell population were analyzed by flow cytometry. Data are representative of two independent experiments. Results are expressed as mean ± SD. *P < 0.05, Student’s t test.
Fig. S10.
Exacerbated and sustained EAE symptoms in Crbn−/− mice. (A) Clinical scores of EAE mice. (B) Spinal cord sections. (C) Proliferation of splenocytes in response to MOG35–55, as measured by [3H]thymidine incorporation, at the indicated time points for 12 h. (D) Concentration of cytokines in the supernatant from splenocyte cultures stimulated with MOG35–55 peptide. (E) Relative mRNA levels of IL-17A, IFN-γ, and GM-CSF in isolated spinal cord mononuclear cells (n = 3 per group). Data are representative of three independent experiments. Results are expressed as mean ± SD. *P < 0.05; **P < 0.01, Student’s t test.
Discussion
Our experiments demonstrate that Crbn gene deficiency in CD4+ T cells increases both calcium influx and IL-2 production. In addition, we found that CRBN regulates expression of the Kv1.3 potassium channel by directly binding to the 3′ conserved region of Kcna3 chromatin, thereby influencing the types of histone modifications of the locus. Moreover, we noticed that Cul4A and DDB1 fail to be recruited to the Kcna3 chromatin in the absence of CRBN. This finding is significant, because Cul4A and DDB1 are components of the CRBN E3 ubiquitin ligase complex that not only participate in ubiquitin ligase activity, but also are involved in H3K27 modifications, such as H3K27me3 and H3K27ac (12, 15). We found that CRBN is responsible for EZH1 (a histone methyltransferase for H3K27 modification) recruitment to Kcna3 chromatin. Finally, increased expression of Kv1.3 in T cells lacking CRBN results in increased potassium flux and, subsequently, increased calcium flux, T-cell activation, and IL-2 production in vitro. These changes were associated with increased susceptibility to T-cell–mediated autoimmunity in vivo.
These observations are consistent with reports showing that Kv1.3 blockade reduces both T-cell activation and the susceptibility of mice to T-cell–mediated autoimmune disorders, such as EAE (19, 20). This suggests that CRBN acts as an important controller of calcium influx in T cells by regulating Kcna3 expression. In addition, prolonged treatment of T cells with thalidomide can affect the expression of Kv1.3 by regulating histone modifications in Kcna3, because the thalidomide-binding region in CRBN is located within a newly identified DNA-binding domain. We found that thalidomide treatment blocks recruitment of CRBN to the Kcna3 locus and affects histone modifications (i.e., H3K27me3 was decreased and H3K27Ac was increased). Interestingly, however, whereas previous reports showed that specific enhancement of calcium signaling ameliorates EAE symptoms (21, 22), our data show that Crbn−/− mice and Crbnflox/flox;Cd4-Cre mice display exacerbated and sustained EAE symptoms even though potassium flux-coupled calcium flux is increased in the Crbn-deficient CD4+ T cells. Other reports have shown that thalidomide treatment relieves EAE symptoms (23) whereas CRBN deficiency increases these symptoms. Apparently, CRBN is capable of “off-target” degradation activity in the presence of IMiDs. Thus, although thalidomide inhibits the DNA-binding ability of CRBN, IMiDs can affect other CRBN functions, such as off-target degradation, which possibly results from differences in CRBN deficiency and thalidomide treatment in the EAE mouse model. Other unidentified targets of IMiDs can also affect these results. Therefore, it is possible that increasing the potassium flux-coupled calcium flux in the Crbn-deficient CD4+ T cells creates a different intracellular environment compared with increasing calcium flux only, because cytosolic calcium levels are increased by decreasing the cytosolic potassium concentration during T-cell activation. In addition, unidentified downstream signaling cascade differences between CRBN and other calcium-signaling regulators, such as Golli, may possibly contribute to the aforementioned differences in the EAE mouse model.
In conclusion, our results demonstrate that CRBN plays an important role during T-cell activation. CRBN restricts potassium flux by directly modulating the histone modification of Kcna3 chromatin, thereby inhibiting the expression of Kv1.3. Finally, the difference in expression of CRBN in T cells could serve to regulate sensitivity to TCR stimulation.
Materials and Methods
Information on mice, cells, antibodies, plasmids, flow cytometry analysis, the nuclear complex coimmunoprecipitation (co-IP) assay, the microarray analysis, quantitative RT-PCR, calcium and potassium flux, ChIP, Kcna3 sequence analysis, the Kcna3 gene luciferase assay, measurement of NF-AT– and NF-κB–specific DNA-binding activity, the EAE model, the proliferation assay, and cytokine measurement is provided in SI Materials and Methods. All animal experiments were approved by the Gwangju Institute of Science and Technology's Institutional Animal Care and Use Committee.
SI Materials and Methods
Mice and Cells.
Crbn−/− mice were generated by deleting exon 1 from the Crbn gene through gene targeting. The mice were then backcrossed with C57BL/6 mice for at least 20 generations. All mice were kept in pathogen-free conditions in the animal care facility at the Gwangju Institute of Science and Technology. Crbnflox/flox mice (Jackson Laboratory) were first bred with Cd4-Cre transgenic mice, and the offspring were bred with Crbnflox/flox mice to generate Crbnflox/flox;Cd4-Cre and Crbn+/flox;Cd4-Cre mice. All mice used in the experiments were 6–8 wk old. All animal experiments were approved by the Gwangju Institute of Science and Technology’s Institutional Animal Care and Use Committee.
Primary CD4+ Tn (CD62LhighCD44low) cells or CD4+ Tem (CD62LlowCD44high) cells were isolated using a FACSAria III cell sorter (BD Biosciences) from three Crbn−/− mice and three Crbn+/− mice (>95% purity). Primary CD4+ T cells were isolated from Crbn−/− and Crbn+/− mice, Crbnflox/flox;Cd4-Cre and Crbn+/flox;Cd4-Cre mice, and wild-type mice (C57BL/6) by negative depletion of non-T cells (CD4+ purity, >95%).
Antibodies, Plasmids, and Recombinant Lentivirus.
The anti-CRBN antibody was generated in rabbits immunized with the CRBN protein, followed by affinity purification. Anti-GAPDH (H-12), anti-IκBα (SC-371), anti–NF-ATc1 (7A6), and anti-DDB1 (B-1) antibodies were purchased from Santa Cruz Biotechnology. Anti-Myc (9B11), anti-Cul4A (2699), anti–phospho-ERK (20G11), anti-phospho-JNK (81E11), anti-MBP (8G1), anti-histone H3 (9715), anti-IKZF1 (D6N9Y), and anti-IKZF3 (D1C1E) antibodies were purchased from Cell Signaling Technology. Anti-Kv1.3 (L23/L27) antibody was purchased from NeuroMab. Anti-H3K27me3 (07–449) and anti-H3K27ac (06–599) antibodies were purchased from Millipore. Anti-EZH1 (ab13665) and anti-EHZ2 (ab3748) antibodies were purchased from Abcam. Anti-hemagglutinin (HA-7) antibody was purchased from Sigma-Aldrich. Anti-mouse CD3 (17A2) and anti-mouse CD28 (145-2C11) antibodies were purchased from Bio X Cell, and anti-human CD3 (UCHT1) and anti-human CD28 (CD28.2) antibodies were purchased from eBiosciences. Anti-mouse IgG and anti-hamster IgG antibodies were purchased from Sigma-Aldrich. Alexa Fluor 488-conjugated anti-mouse CD4 (GK1.5), FITC-conjugated anti-mouse TCRβ (H57-597), PE-conjugated anti-mouse CD69 (H1.2F3), FITC-conjugated anti-mouse CD8 (53-6.7), peridinin chlorophyll protein cyanine 5.5 (PerCP Cy5.5)-conjugated anti-mouse CD25 (PC61.5), allophycocyanin (APC)-conjugated anti-mouse CD4 (GK1.5), APC-conjugated anti-mouse B220 (RA3-6B2), APC-conjugated anti-mouse IL-17A (eBio17B7), PE-conjugated anti-mouse GM-CSF (MP1-22E9), PerCP Cy5.5-conjugated anti-mouse CD62L (MEL-14), PerCP Cy5.5-conjugated anti-mouse IFN-γ (XMG1.2) and PE-conjugated anti-human/mouse CD44 (IM7) antibodies were purchased from eBioscience. Live cells were stained for 1 h at 4 °C and then fixed in 2.5% (wt/vol) paraformaldehyde.
pMigR1-HA-mCRBN and pMigR1-HA-hCRBN were constructed by inserting an HA-tagged mouse or human Crbn ORF into pMigR1. pET-MBP-CRBN (for overexpression in E. coli) was constructed by inserting an MBP-tagged human Crbn ORF into the pET plasmid. pGL-Kcna3pro and pGL-Kcna3pro-R4 were constructed by inserting the Kcna3 promoter region (−1,200 to +1) or the Kcna3 promoter region plus R4 region (+2,799 to +2,950) into pGL3-Basic (Promega).
Flow Cytometry Analysis.
Isolated CD4+ Tn and Tem cells were activated using either anti-mouse CD3 (1 μg/mL) or anti-mouse CD3 (1 μg/mL) plus anti-mouse CD28 (1 μg/mL) antibodies for the indicated times and then stained with the indicated antibodies. The stained cells were analyzed on a FACSCanto II (BD Biosciences) or FACSCalibur (BD Biosciences) flow cytometer. For intracellular cytokine staining analysis, isolated splenic cells or spinal cord cells were stimulated for 6 h with PMA (50 ng/mL) and ionomycin (500 ng/mL) in the presence of GolgiPlug (BD Pharmingen). Cells were then stained for surface molecules such as CD4, fixed, permeabilized with a Cytofix/Cytoperm Plus Kit (BD Biosciences), and stained with anti-mouse IFN-γ, anti-mouse IL-17A, or anti-mouse GM-CSF antibodies. Data were collected using a FACSCanto II (BD Biosciences) and analyzed with FlowJo software.
For in vitro differentiation of CD4+ T cells isolated from Crbnflox/flox;Cd4-Cre mice and Crbn+/flox;Cd4-Cre mice into Th17 cells, isolated cells were cultured with anti-mouse CD3 (5 μg/mL), anti-mouse CD28 (5 μg/mL), anti-mouse IFN-γ (10 μg/mL; eBioscience), anti-mouse IL-4 (10 μg/mL; eBioscience), mouse IL-6 (20 ng/mL; PeproTech), and mouse TGF-β (20 ng/mL; eBioscience) for 4 d. IL-17A staining of differentiated cells was performed as described above. The stained cells were analyzed on a FACSCanto II (BD Biosciences) or FACSCalibur (BD Biosciences) flow cytometer. Data were analyzed with FlowJo software.
Nuclear Complex Co-IP Assay.
Primary CD4+ T cells (2 × 10⁷) were used to study the endogenous interactions within the nuclear fraction. This analysis was performed using a Nuclear Complex Co-IP Kit (Active Motif). CRBN protein was immunoprecipitated with an anti-CRBN antibody. Samples were separated by SDS/PAGE and analyzed by immunoblotting with anti-CRBN, anti-EZH1, anti-EZH2, anti-Cul4A, or anti-DDB1 antibodies.
Microarray Analysis.
For quality control, RNA purity and integrity were evaluated according to the OD260/280 ratio and analyzed using an Agilent 2100 Bioanalyzer. The Affymetrix Whole Transcript Expression Array process was performed following the manufacturer’s protocol using the Affymetrix GeneChip WT PLUS Reagent Kit. cDNA was synthesized using the Affymetrix GeneChip WT cDNA Synthesis and Amplification Kit in accordance with the manufacturer’s instructions. The sense cDNA was then fragmented and biotin-labeled with terminal deoxynucleotidyl transferase using the Affymetrix GeneChip WT Terminal Labeling Kit. Approximately 5.5 μg of labeled DNA target was hybridized to the Affymetrix GeneChip Mouse 2.0 ST Array at 45 °C for 16 h. Hybridized arrays were washed and stained on a GeneChip Fluidics Station 450 and scanned on a GeneChip GCS 3000 Scanner (Affymetrix). Raw data were extracted automatically following an Affymetrix data extraction protocol using Affymetrix GeneChip Command Console software. After the CEL files were imported, data were summarized and normalized using the robust multiaverage method implemented in the Affymetrix Expression Console software. The normalized data were subjected to differentially expressed gene analysis using expression-fold changes between control and test samples. Functional classification was performed using the Database for Annotation, Visualization, and Integrated Discovery (DAVID, release 6.7) online tools (https://david.ncifcrf.gov). The gene enrichment of functional pathways was measured by determining the number of genes belonging to the pathway in the list of significantly altered genes weighed against the total murine genome using the Fisher exact test.
Quantitative RT-PCR.
Total RNA was extracted from isolated CD4+ Tn and Tem cells, from isolated splenic and spinal cord cells, and from Jurkat T cells using the ReliaPrep RNA Cell Miniprep System (Promega), and complementary DNAs were generated by reverse transcription. Quantitative RT-PCR was performed using SYBR Green Master Mix (TaKaRa) and the Mx3005p quantitative PCR system (Stratagene). GAPDH served as an internal control.
Calcium and Potassium Flux.
Isolated primary CD4+ Tn and Tem cells were stained with 1× PBS (137 mM NaCl, 2.7 mM KCl, 10 mM Na2HPO4, and 2 mM KH2PO4) containing 4 μg/mL Fluo3-AM (Invitrogen), 2 mM CaCl2, and 1.1 mM MgCl2 for 30 min at 37 °C in the presence or absence of 100 nM Shk-Dap22 (Tocris Bioscience). The cells were then incubated with anti-mouse CD3 (1 μg/mL) and anti-mouse CD28 (1 μg/mL) antibodies (Bio X Cell) for 30 min at 4 °C. After washing with PBS, the cells were resuspended in PBS containing 1.3 mM CaCl2 and 1.1 mM MgCl2, followed by incubation at 37 °C for 20 min. Basal fluorescence was determined by flow cytometry for 1 min, and calcium influx was analyzed using a FACSCalibur cell analyzer (BD Biosciences) after the addition of 10 μg/mL goat anti-hamster IgG antibody (Sigma-Aldrich).
Potassium flux in CD4+ Tn and Tem cells was analyzed using the FluxOR Thallium Detection Kit (Invitrogen), according to the manufacturer’s protocol. In brief, isolated CD4+ Tn and Tem cells were stained with thallium-sensitive FluxOR dye in loading buffer at room temperature for 90 min. The cells were then washed three times with loading buffer, followed by preincubation at room temperature for 30 min in assay buffer in the presence or absence of 100 nM Shk-Dap22. After the cells were treated with a stimulus solution (final 20 mM free K+) without or with thallium (final 3.0 mM free Ti+), the FluxOR dye was excited at 490 nm and detected at 520 nm using a fluorescent plate reader (Molecular Devices). Fluorescence was measured every 4 s for a total of 180 s.
ChIP.
For the ChIP assays, 5 × 10⁶ cells were cross-linked and quenched using 1% formaldehyde and glycine. ChIP analysis was performed using a ChIP assay kit (Millipore). Sonicated cell lysates were used for immunoprecipitations in the presence of anti-H3K27me3, anti-H3K27ac, anti-CRBN, anti-Cul4A, anti-DDB1, anti-EZH1, anti-EZH2, or anti-IgG antibodies. Samples were separated using protein A agarose/salmon sperm DNA (50% slurry; Millipore). Quantitative PCR analyses were performed using SYBR Green Master Mix and the Mx3005p quantitative PCR system.
Kcna3 Sequence Analysis.
Gene information was extracted from RefSeq (www.ncbi.nlm.nih.gov/refseq). PhyloP was calculated by multiple alignment of sequences from 100 vertebrate species available from the UCSC Genome Browser. The mouse Kcna3 gene was inverted to align with the human version.
Kcna3 Gene Luciferase Assay.
Jurkat T cells were plated at 5 × 10⁵ cells per well in a 12-well plate and transfected with the indicated reporter plasmid (pGL3, pGL3-Kcna3pro, or pGL3-Kcna3pro-R4) and pRenilla. After 24 h, cells were stimulated for 6 h with PMA (50 ng/mL) and ionomycin (500 ng/mL). The stimulated cells were lysed in 1× passive lysis buffer. Debris was removed by centrifugation at 21,000 × g for 5 min at 4 °C. Firefly luciferase and Renilla luciferase activity was measured in 20-µL lysate samples. The fold stimulation was calculated for each sample by dividing the luciferase activity in the sample (normalized to Renilla luciferase activity) by the activity of a sample containing only empty expression vector.
Measurement of NF-AT– and NF-κB–Specific DNA-Binding Activity.
Nuclear extracts from purified primary CD4+ Tn and Tem cells were prepared using hypotonic lysis buffer and nuclear extraction buffer. Gel shift assays were performed using the DIG Gel Shift Kit, 2nd generation (Roche) according to the manufacturer’s instructions. The following oligonucleotides corresponding to the NF-κB– and NF-AT–binding sites were synthesized: NF-AT, 5′-GCCCAAAGAGGAAAATTTGTTTCATACAG-3′; NF-κB, 5′-AGTTGAGGGGACTTTCCCAGG-3′. In brief, probes were labeled at the 3′ end with digoxigenin-11-ddUTP. To check the specificity of binding, unlabeled probes were used as competitors. For quantitative analysis of NF-AT activity, NF-AT–binding activity to its target DNA sequence was measured using the TransAM NFATc1 Kit (Active Motif), according to the manufacturer’s instructions.
EAE Model.
Male Crbnflox/flox;Cd4-Cre and Crbn+/flox;Cd4-Cre mice (10 wk old) were immunized s.c. with 200 μg of MOG p35–55 (Anygen) mixed with supplemented complete Freund’s adjuvant (Sigma-Aldrich), followed by i.p. injection of Bordetella pertussis toxin (400 ng per mouse; List Biological Laboratories) on days 0 and 2. Clinical EAE was graded on a scale of 1–5 according to established criteria: 0, no observable disease; 1, limp tail; 2, limp tail and partial limb weakness; 3, hind limb paralysis; 4, hind and fore limb paralysis; 5, moribund or death.
For testing the effect of a Kv1.3-specific inhibitor on EAE symptoms, Shk-Dap22 (80 μg/kg) was injected s.c. every other day 11 d after MOG immunization. Spinal cord-infiltrating cells were isolated from the spinal cords of perfused mice. Spinal cord homogenates were incubated with collagenase (2.5 mg/mL; Roche) and DNase (1 mg/mL; Sigma-Aldrich) for 1 h at 37 °C, after which the cells were purified by a Percoll gradient [70% and 37% (vol/vol); GE Healthcare].
Proliferation Assay.
CD4+ T cells were isolated from EAE mice at day 20. The isolated (5 × 10⁴) CD4+ T cells were then cultured with 1 × 10⁵ T-cell–depleted wild-type spleen cells (irradiated with 3,000 rad) in the presence or absence of 20 μg/mL MOG for 24 h or 48 h. [3H]thymidine was added at 12 h and 36 h after activation to measure CD4+ T-cell proliferation. After 12 h, [3H]thymidine incorporation into the nuclear DNA of activated CD4+ T cells was measured. The isolated (5 × 10⁴) CD4+ Tn and Tem cells from three Crbn−/− mice or three Crbn+/− mice were stimulated with indicated amounts of anti-CD3 and anti-CD28 antibodies for 72 h. At 60 h after activation, [3H]thymidine was added to measure CD4+ Tn and Tem cell proliferation. After 12 h, [3H]thymidine incorporation into the nuclear DNA of activated CD4+ Tn and Tem cells was measured.
Cytokine Measurement.
To measure the levels of secreted IL-17 and IFN-γ, CD4+ T cells were isolated from the spleens of EAE-induced mice at day 20. Isolated CD4+ T cells (5 × 10⁵) were cultured for 72 h with 1 × 10⁶ T-cell–depleted wild-type spleen cells in the presence or absence of the indicated amounts of MOG. BD Cytometric Bead Array solution (BD Biosciences) and a FACSCanto II flow cytometer (BD Biosciences) were used to measure IL-17 and IFN-γ secreted into the culture medium.
Acknowledgments
This work was supported by the Korean Health Technology R&D Project, Republic of Korea Ministry of Health & Welfare (Grants HI14C1466 and HI16C1074), the Silver Health Bio Research Center of Gwangju Institute of Science and Technology, and the National Research Foundation of Korea (Grants NRF-2013R1A1A2010995 and NRF-2016R1A5A1007318).
Footnotes
The authors declare no conflict of interest.
This article is a PNAS Direct Submission.
This article contains supporting information online at www.pnas.org/lookup/suppl/doi:10.1073/pnas.1502166113/-/DCSupplemental.
References
- 1.Ito T, et al. Identification of a primary target of thalidomide teratogenicity. Science. 2010;327(5971):1345–1350. doi: 10.1126/science.1177319. [DOI] [PubMed] [Google Scholar]
- 2.Lopez-Girona A, et al. Cereblon is a direct protein target for immunomodulatory and antiproliferative activities of lenalidomide and pomalidomide. Leukemia. 2012;26(11):2326–2335. doi: 10.1038/leu.2012.119. [DOI] [PMC free article] [PubMed] [Google Scholar]
- 3.Xin W, et al. Primary function analysis of human mental retardation related gene CRBN. Mol Biol Rep. 2008;35(2):251–256. doi: 10.1007/s11033-007-9077-3. [DOI] [PubMed] [Google Scholar]
- 4.Jo S, Lee KH, Song S, Jung YK, Park CS. Identification and functional characterization of cereblon as a binding protein for large-conductance calcium-activated potassium channel in rat brain. J Neurochem. 2005;94(5):1212–1224. doi: 10.1111/j.1471-4159.2005.03344.x. [DOI] [PubMed] [Google Scholar]
- 5.Higgins JJ, et al. Temporal and spatial mouse brain expression of cereblon, an ionic channel regulator involved in human intelligence. J Neurogenet. 2010;24(1):18–26. doi: 10.3109/01677060903567849. [DOI] [PubMed] [Google Scholar]
- 6.Lu G, et al. The myeloma drug lenalidomide promotes the cereblon-dependent destruction of Ikaros proteins. Science. 2014;343(6168):305–309. doi: 10.1126/science.1244917. [DOI] [PMC free article] [PubMed] [Google Scholar]
- 7.Krönke J, et al. Lenalidomide causes selective degradation of IKZF1 and IKZF3 in multiple myeloma cells. Science. 2014;343(6168):301–305. doi: 10.1126/science.1244851. [DOI] [PMC free article] [PubMed] [Google Scholar]
- 8.Gandhi AK, et al. Immunomodulatory agents lenalidomide and pomalidomide co-stimulate T cells by inducing degradation of T cell repressors Ikaros and Aiolos via modulation of the E3 ubiquitin ligase complex CRL4(CRBN.) Br J Haematol. 2014;164(6):811–821. doi: 10.1111/bjh.12708. [DOI] [PMC free article] [PubMed] [Google Scholar]
- 9.Wu C, et al. BioGPS: an extensible and customizable portal for querying and organizing gene annotation resources. Genome Biol. 2009;10(11):R130. doi: 10.1186/gb-2009-10-11-r130. [DOI] [PMC free article] [PubMed] [Google Scholar]
- 10.Cahalan MD, Chandy KG. The functional network of ion channels in T lymphocytes. Immunol Rev. 2009;231(1):59–87. doi: 10.1111/j.1600-065X.2009.00816.x. [DOI] [PMC free article] [PubMed] [Google Scholar]
- 11.Kalman K, et al. ShK-Dap22, a potent Kv1.3-specific immunosuppressive polypeptide. J Biol Chem. 1998;273(49):32697–32707. doi: 10.1074/jbc.273.49.32697. [DOI] [PubMed] [Google Scholar]
- 12.Pazhouhandeh M, Molinier J, Berr A, Genschik P. MSI4/FVE interacts with CUL4-DDB1 and a PRC2-like complex to control epigenetic regulation of flowering time in Arabidopsis. Proc Natl Acad Sci USA. 2011;108(8):3430–3435. doi: 10.1073/pnas.1018242108. [DOI] [PMC free article] [PubMed] [Google Scholar]
- 13.Dumbliauskas E, et al. The Arabidopsis CUL4-DDB1 complex interacts with MSI1 and is required to maintain MEDEA parental imprinting. EMBO J. 2011;30(4):731–743. doi: 10.1038/emboj.2010.359. [DOI] [PMC free article] [PubMed] [Google Scholar]
- 14.Wang H, et al. Histone H3 and H4 ubiquitylation by the CUL4-DDB-ROC1 ubiquitin ligase facilitates cellular response to DNA damage. Mol Cell. 2006;22(3):383–394. doi: 10.1016/j.molcel.2006.03.035. [DOI] [PubMed] [Google Scholar]
- 15.Higa LA, et al. CUL4-DDB1 ubiquitin ligase interacts with multiple WD40-repeat proteins and regulates histone methylation. Nat Cell Biol. 2006;8(11):1277–1283. doi: 10.1038/ncb1490. [DOI] [PubMed] [Google Scholar]
- 16.Fischer ES, et al. Structure of the DDB1-CRBN E3 ubiquitin ligase in complex with thalidomide. Nature. 2014;512(7512):49–53. doi: 10.1038/nature13527. [DOI] [PMC free article] [PubMed] [Google Scholar]
- 17.Aerbajinai W, Zhu J, Gao Z, Chin K, Rodgers GP. Thalidomide induces gamma-globin gene expression through increased reactive oxygen species-mediated p38 MAPK signaling and histone H4 acetylation in adult erythropoiesis. Blood. 2007;110(8):2864–2871. doi: 10.1182/blood-2007-01-065201. [DOI] [PMC free article] [PubMed] [Google Scholar]
- 18.Fard AD, et al. 2013. Evaluation of H3 histone methylation and colony formation in erythroid progenitors treated with thalidomide and sodium butyrate. Laboratory hematology: official publication of the International Society for Laboratory Hematology 19(1):1-5.
- 19.Beeton C, et al. Selective blockade of T lymphocyte K(+) channels ameliorates experimental autoimmune encephalomyelitis, a model for multiple sclerosis. Proc Natl Acad Sci USA. 2001;98(24):13942–13947. doi: 10.1073/pnas.241497298. [DOI] [PMC free article] [PubMed] [Google Scholar]
- 20.Matheu MP, et al. Imaging of effector memory T cells during a delayed-type hypersensitivity reaction and suppression by Kv1.3 channel block. Immunity. 2008;29(4):602–614. doi: 10.1016/j.immuni.2008.07.015. [DOI] [PMC free article] [PubMed] [Google Scholar]
- 21.Feng JM, et al. Golli protein negatively regulates store depletion-induced calcium influx in T cells. Immunity. 2006;24(6):717–727. doi: 10.1016/j.immuni.2006.04.007. [DOI] [PubMed] [Google Scholar]
- 22.Ghosh S, et al. Hyperactivation of nuclear factor of activated T cells 1 (NFAT1) in T cells attenuates severity of murine autoimmune encephalomyelitis. Proc Natl Acad Sci USA. 2010;107(34):15169–15174. doi: 10.1073/pnas.1009193107. [DOI] [PMC free article] [PubMed] [Google Scholar]
- 23.Corrêa JO, Aarestrup BJ, Aarestrup FM. Effect of thalidomide and pentoxifylline on experimental autoimmune encephalomyelitis (EAE) Exp Neurol. 2010;226(1):15–23. doi: 10.1016/j.expneurol.2010.04.007. [DOI] [PubMed] [Google Scholar]


