

Abstract
Background. The emergence of drug-resistant malaria highlights the need for new agents. A desired characteristic of candidate antimalarials is rapid killing of parasites. This is typically measured by the rate of exponential clearance of parasitemia following treatment. However, this clearance rate excludes the highly variable lag phase, when the parasitemia level may increase, remain constant, or decrease. Understanding factors determining this lag phase is important for drug development.
Methods. We assessed the kinetics of parasitemia in 112 volunteers infected with blood-stage Plasmodium falciparum and treated with 8 different antimalarials. The parasitemia level was measured by quantitative polymerase chain reaction. We analyzed the relationship between the timing of treatment in the parasite growth cycle, and whether the parasitemia level rose or fell in the first 12 or 24 hours after treatment.
Results. The timing of treatment in the parasite life cycle predicted whether subjects experienced rises or falls in parasitemia level after treatment. Antimalarials were unable to prevent rises in the parasitemia level in the first 12 hours. However, in the first 24 hours after treatment, fast-acting but not slow-acting drugs reduced the parasitemia level independent of when treatment was administered.
Conclusions. The highly variable lag phase depends on the speed of action of an antimalarial and when in the periodic growth cycle it is administered.
Keywords: malaria, Plasmodium falciparum, antimalarial, lag phase, mathematical modeling, drug efficacy, human challenge, blood-stage
Most deaths due to severe malaria occur within the first 24 hours after admission [1–3]. Thus, controlling parasite numbers at the earliest stage after treatment is a priority for reducing mortality. The in vivo effectiveness of drugs is often measured by the rate of clearance of parasites from the blood during the exponential phase of parasite clearance [4]. However, there is significant variation in parasite levels during the first 24 hours after treatment [5, 6]. This is often referred to as the lag phase and describes a situation when the parasitemia level may increase, remain relatively constant, or drop rapidly [4, 7, 8]. A consequence of this is that assessment of drug efficacy in the very early phase after treatment is difficult. Accordingly, current measures of drug efficacy have focused on accurately estimating the exponential rate of decline after the lag phase [4, 6, 9] and have censored the early lag phase. Given that the first 24 hours of therapy are crucial for clinical outcome [10], understanding the mechanisms of the highly variable parasite dynamics immediately following treatment and relating this to drug action is important for the rational design of therapies aimed to save the lives of patients with severe malaria.
A variety of explanations for the variability in parasite kinetics immediately after treatment have been proposed. These include the parasite life cycle stages present in the patient at the time treatment commences [6, 11] and the differential activity of drugs on various life cycle stages [12–15]. In this work, we use data from a tightly controlled model of experimental blood-stage infection of naive volunteers with P. falciparum to explore the dynamics of parasitemia during the early lag phase after treatment. Experimental challenge with synchronized blood-stage infection and subsequent regular monitoring of parasitemia by quantitative polymerase chain reaction (qPCR) [16] and the distinctive cyclical nature of the P. falciparum growth enabled us to infer the stage of parasite growth at the time of treatment. We examine the relationship between the stage in the parasite growth cycle at which treatment was initiated and its subsequent pharmacodynamic effect. Using this understanding of parasite kinetics after treatment, we compared the effectiveness of 8 antimalarial drugs at reducing parasite numbers in the first 24 hours after treatment. Our findings suggest that studies using induced blood-stage infection systems to assess the effectiveness of antimalarials should account for the parasite stage present in a host at the time of treatment. This will provide more-informative data on drug efficacy. In addition, this work provides further support for the prioritization of development of drugs that act independently of the parasite's life cycle stage so as to minimize morbidity and mortality in the patients presenting with severe malaria.
MATERIALS AND METHODS
Human Challenge Studies
A series of open label, single-center, controlled studies was undertaken in accordance with methods previously described [17] (Supplementary 1). In brief, subjects were infected by intravenous injection of approximately 1800 viable P. falciparum–infected human erythrocytes. Parasitemia was monitored by qPCR (as described previously [16]) before and after treatment with a variety of antimalarial drugs (Table 1), all of which were administered orally.
Table 1.
Drugs Used in This Experiment and Their Proposed Speed of Action
Comparison of Fast-Acting and Slow-Acting Antimalarials
Given that most deaths among those hospitalized for malaria occur in the first day after admission [1–4], we sought to compare the effectiveness of drugs in reducing parasite growth in this early phase after treatment commences. To compare antimalarial efficacy, we grouped drugs as “slow-acting” or “fast-acting,” based on their pharmacological properties, results of in vitro studies, and results of clinical studies of the drugs (Table 1). When analyzing the growth or decline in parasitemia level after treatment, we excluded cohorts that were given noncurative drug doses (mefloquine cohort 1 and OZ439 cohort 1).
Ethical Considerations
The protocol and associated documents were reviewed and approved by the QIMR Berghofer Human Research Ethics Committee. All volunteers provided written informed consent before participating in these trials. The trials were registered at ANZCTR.org.au (ACTRN12612000323820, ACTRN12612000814875, ACTRN12613000565741, ACTRN12613001040752, ACTRN12613000527763, and ACTRN12611001203943) or ClinicalTrials.gov (NCT01055002).
Estimating Growth and Decay Rates
All growth and decay rates were estimated for an individual, at a particular time t, using a simple 2-point formula:
| (1) |
where Pt is the parasite concentration (calculated as the number of parasites/milliliter) in the blood at time t days, w is the interval over which the parasite growth is calculated (either 12 or 24 hours in our analyses, converted to units of days), and Pt+w is the parasite concentration (calculated as the number of parasites/milliliter) in the blood at time t + w days.
Modeling and Analysis
Calculations of growth and decay rates, as well as all statistical analyses, were performed using MATLAB R2014b (MathWorks, Massachusetts). Comparisons of means of each group were conducted using the Student t test. All correlations are Pearson correlations. All confidence intervals (CIs) are 95% CIs. Deming regression, assuming equivalent uncertainty in the x and y variables, is used for all linear regression analyses. Deming regressions were performed using the linear Deming regression package [25] from MATLAB Central File Exchange, and the inbuilt optimization procedure fmincon.m, with an objective function defined as the sum of squared orthogonal residuals. The standard errors and CIs of estimated coefficients were calculated using the jackknife bootstrap procedure [25]. Nested model comparisons were performed using the F test. We also modeled the cyclical nature of P. falciparum parasite growth dynamics as a distribution of parasites of different stages maturing together through time. A full description of this model is given in Supplementary 2.
RESULTS
Periodic Growth Curve of P. falciparum
Data from 112 volunteers infected with blood-stage P. falciparum parasites (3D7 strain) were available, comprising 17 cohorts of 4–9 subjects each (Supplementary Table 1), treated with 8 different drugs (Table 1). We observed periodic parasite growth patterns, typical of synchronous P. falciparum infection (Figure 1), with a period of approximately 40 hours (Supplementary 3), consistent with the observation of others regarding the P. falciparum 3D7 strain [26, 27]. The periodic nature of the parasite growth cycle was related to the synchronous development of parasites, a consequence of the fact that the blood-stage inoculum contained ring-stage parasites only (Figure 2).
Figure 1.

Parasitemia data for subjects before and after treatment. Time courses of parasitemia for each subject, determined by polymerase chain reaction. Concentrations before treatment are indicated by circles, and concentrations after treatment are indicated by x's. The solid line represents a fitted model of periodic parasite growth (only fitted to data before treatment), with synchronization of parasites given by a truncated normal distribution with standard deviation, σ, of 0.32 days.
Figure 2.
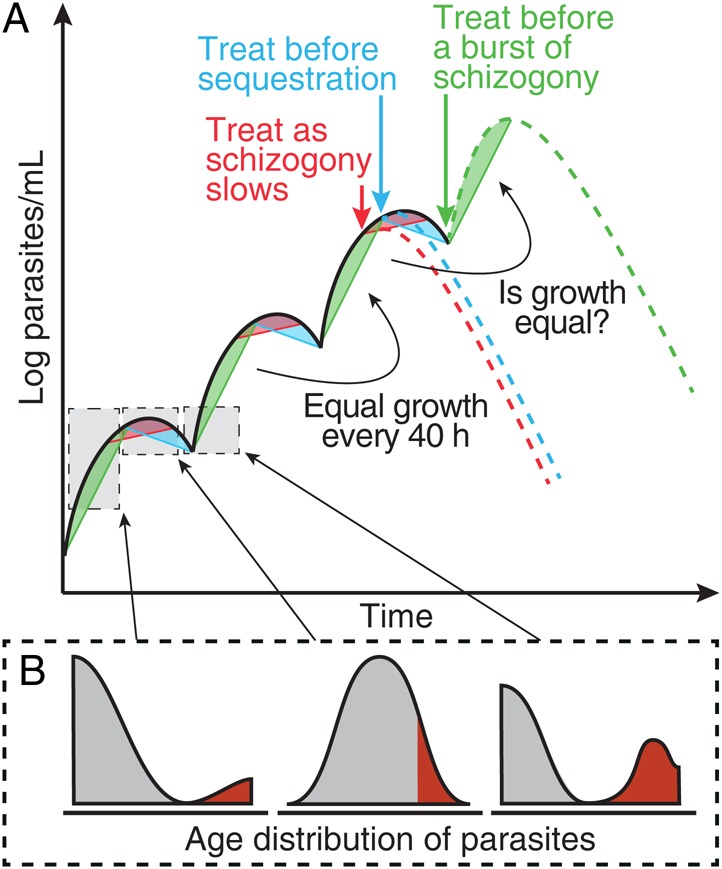
Illustration of the periodic growth cycle of parasitemia. A, A schematic of parasite growth in an individual with synchronous infection with Plasmodium falciparum. Parasites progress through their life stages synchronously, with a rapid increase every 40 hours following schizont rupture (green regions). Troughs occur every 40 hours as mature parasites sequester (blue regions). B, The expected age profile of parasite at each point in the life cycle, with gray shading indicating parasites in circulation and red shading indicates sequestered parasites. The green dashed line illustrates the hypothesis that individuals treated at a trough in parasite concentration (green arrow) tend to have an increase in parasite concentration immediately after treatment. Alternatively, individuals treated near a peak in parasite concentration (blue arrow) will tend to experience a decline in parasite concentration immediately after treatment. This figure is available in black and white in print and in color online.
Timing of Treatment Affects Parasite Kinetics in the Lag Phase After Therapy
We next explored how the point in this periodic growth cycle at which treatment commenced affected the outcome of treatment (Figure 2). To do this, we compared the growth rate of parasites in the first 12 hours after treatment in volunteers treated in the morning on either an odd day (generally, day 7) and an even day (generally, day 8). Two subjects were excluded because they were treated in the afternoon; also, cohorts that received noncurative doses were excluded, leaving 96 of 112 subjects available for analysis. In this inoculation schedule, peaks in parasitemia level tended to occur on odd days, and troughs tended to occur on even days (Figure 1). Of the 96 subjects, 90 had a 12-hour (posttreatment) sample available for analysis. Grouping all cohorts together, we found that volunteers treated on an even day (trough) exhibited parasite growth (2.1/day; 95% CI, 1.4–2.8) over the first 12 hours after treatment. Volunteers treated on an odd day (peak) showed a decline (−3.7/day; 95% CI, −4.3 to −3.1) in parasite numbers (Figure 3A). These dynamics occurred regardless of whether a fast-acting or slow-acting antimalarial was used (Figure 3B). By contrast, over the first 24 hours, subjects treated on an even day (trough) with fast-acting (but not slow-acting) drugs all showed a decline in parasitemia level (Figure 3C and 3D). The only subjects at risk of a rise in parasitemia level at 24 hours were those treated on an even day (trough) with slow-acting drugs (Figure 3D).
Figure 3.

Treatment at a peak or trough in parasitemia level. Changes in parasitemia level immediately following treatment among volunteers treated at different times after infection. Data are the aggregate of all available volunteers who were treated in the morning and for which necessary data were available. ***P < .0001, by a t test. A, Parasite numbers tended to increase in the first 12 hours after treatment in volunteers treated on an even day (n = 49; mean growth rate, 2.1/day). By contrast parasite numbers tended to decline in volunteers treated on an odd day (n = 41; mean growth rate, −3.7/day). B, This was true for subjects regardless of whether they received a fast-acting or slow-acting antimalarial. C, Parasite numbers were more likely to decline in the first 24 hours after treatment for those treated on an even day (n = 53; mean, −0.19/day), but the decline was still greater for those treated on an odd day (n = 37; mean, −3.17/day). D, Only those subjects treated on an even day with a slow-acting antimalarial experienced a rise in parasitemia level after treatment on average.
Before Treatment, Current Parasite Growth Is Predicted by Parasite Growth 36 Hours Ago
In addition to using the day of treatment as a proxy for the stage in the parasite growth cycle at which treatment commenced, we also considered the parasite kinetics before treatment. We hypothesized that this would provide a more specific predictor of parasite life cycle stage. Since the parasite growth curve was periodic, we expected that the parasite growth pattern observed at a specific time should approximate the growth pattern observed 1 cycle earlier (Figure 2 [green, red, and blue regions 1 cycle apart should be equivalent]). We examined this relationship by using data for 2 intervals before treatment was administered (Figure 4A [black points and dashed line]). Since measurement of parasitemia level was undertaken every 12 hours, we were unable to compare growth rates over a full parasite life cycle (40 hours); hence, we compared the growth rate of parasites at intervals separated by 36 hours (Figure 4A [black points]). We observed a significant correlation between the parasite growth rates 12 hours before treatment (growth rate from −12 hours to 0 hour) and 36 hours earlier (from −48 hours to −36 hours) in our volunteers before treatment (r = 0.68; P < .0001). Fitting these data, we estimated a slope of 0.86 (95% CI, .59–1.1) (Figure 4A [black dashed line]), similar to the expected 1:1 relationship. This suggests that, in the absence of treatment, the parasite growth now was predicted by the parasite growth observed 36 hours earlier.
Figure 4.

Predicted versus observed growth rates. The action of slow-acting and fast-acting drugs in the first 12 hours (A) and 24 hours (B) after treatment. The expected growth rate (growth rate 36 hours before treatment) is shown on the x-axis, and the observed growth rate (growth rate at the time of treatment) is shown on the y-axis. Red points indicate subjects who received a fast-acting drug, and blue points indicate subjects who received a slow-acting drug (subjects from mefloquine cohort 1 and OZ439 cohort 1 were excluded from this analysis because they received noncurative doses). Growth rates were calculated over a 12-hour window (A) and a 24-hour window (B), using a 2-point method, as illustrated schematically above each panel. Pretreatment growth rates are shown (black dots) for all patients for whom parasite growth rates were available 12 hours before treatment (from −12 hours to 0 hour) and 1 cycle earlier (−48 hours to −36 hours; A) and 24 hours before treatment (−24 hours to 0 hour) and 1 cycle earlier (−60 hours to −36 hours; B). A linear regression model of the relationship between expected growth and observed growth for pretreatment data (black dashed line), fast-acting drugs (red dashed line), and slow-acting drugs (blue dashed line) are shown (using Deming regression). The solid red line in panel B indicates the mean growth rate after treatment, since the slope of the regression for this group was not significant. This figure is available in black and white in print and in color online.
Parasite Kinetics Immediately After Treatment Are Predicted by What Was Expected With No Treatment
By using the principle that the growth rate 36 hours ago predicts the growth at the time of observation, we could obtain a more specific description of a drug's effect by comparing the observed parasite growth after drug was given to the expected parasite growth (that is, the growth expected based on the growth rate 36 hours before treatment; Figure 2). By plotting the growth (or decline) in parasitemia level 36 hours before treatment against the growth (or decline) in parasitemia level immediately after treatment, we estimated how much the treatment interrupts parasite growth (Figure 5). We used Deming regression to estimate the slope and intercept of this relationship. We interpreted these 2 estimates as follows. The slope of our regression measured how much the parasite kinetics after treatment depend on what was expected to occur without treatment. The intercept provided an estimate of the rate at which parasitemia level was expected to decline if treatment were administered at a point in the cycle when no parasite growth is expected—we called this the natural killing rate. There were a number of possibilities in this analysis. If the drug has no impact on parasite growth, then we would expect an approximately 1:1 correlation of the growth rates before and after treatment (Figure 5A), as was observed in the pretreatment data (Figure 4A). Alternatively, if a treatment has an effect but parasite growth after treatment is still dependent on parasite growth before treatment, then we would expected the line to have a positive slope but an intercept of <0 (Figure 5B). Finally, if the drug acts independently of the stage of the parasite growth cycle at which it was applied, then we would expect no significant positive slope between growth rates before and after treatment but a reduced intercept (Figure 5C).
Figure 5.

Illustration of the possible drug effects. A, Volunteers who are not treated or are treated with an ineffective drug would be expected to have the same parasite growth after treatment as was seen 40 hours prior to treatment. B and C, Volunteers treated with a drug that has an effect on parasite growth should show retarded parasite growth after treatment. The observed effect of an active drug may depend on when, in the parasite life cycle, it is administered (B), or it may be independent of the timing of administration (C). A very effective drug that interrupts parasite replication and causes the rapid removal of parasites produces a reduction in parasite numbers independent of what parasite growth was expected (C).
Looking at the growth or decline in parasitemia level in the first 12 hours immediately after treatment and comparing this to the growth observed 1 cycle earlier (Figure 4A), we found a strong correlation (r = 0.73; P < .0001). This suggests that the growth in the first 12 hours after treatment was well predicted by the growth that was observed 1 cycle earlier in the same individual. Fitting this relationship with a linear model by using Deming regression revealed that the slope was significantly <1 (0.74; 95% CI, .55–.92) but not significantly different from the slope for the pretreatment data (0.86; 95% CI, .59–1.1; P = .32). However, when we kept the slopes equal for the 2 groups, the intercept of the line fitted to the treatment data (−1.1/day; 95% CI, −1.7 to −.57) was significantly lower than the intercept of the line fitted to pretreatment data (−0.078/day; 95% CI, −.60–.45; P = .0052). This suggests that, although the kinetics of the parasitemia level after treatment (whether the level rises or falls in the first 12 hours after treatment) was largely predicted by the growth that was observed 1 cycle earlier, the growth after treatment was reduced (albeit only marginally), compared with what was observed in the previous cycle (this corresponds to Figure 5B).
Fast-Acting Drugs Show Higher Effectiveness Early After Treatment Commences
We compared the action of fast-acting and slow-acting antimalarials by looking for different degrees of activity early after treatment, as illustrated in Figure 5. We observed a significant positive correlation between the growth rate 36 hours before treatment and the growth rate in the first 12 hours after treatment for both fast-acting and slow-acting drugs (r = 0.69 and r = 0.75; P < .0001 and P < .0001, respectively; Figure 4A). We found no significant difference between the regression lines for fast-acting drugs and slow-acting drugs (slopes, 0.80 [95% CI, .48–1.1] and 0.63 [95% CI, .40–.86], respectively [P = .54]; intercepts, −1.2/day [95% CI, −2.1 to −.34] and −0.64/day [95% CI, −1.2 to −.071], respectively). However, both slow-acting and fast-acting drugs showed significantly lower intercepts, compared with the pretreatment data (P = .035 and P = .25, respectively). This suggests that, although treatment appears to reduce growth in the first 12 hours after treatment, we saw no evidence of a difference in action between slow-acting drugs and fast-acting drugs.
To consider what happens slightly later but still within the first day after treatment, we next compared the expected growth over the 24 hours immediately following treatment to the observed growth 36 hours earlier (Figure 4B). We once again found a significant positive correlation between expected and observed growth in volunteers treated with slow-acting drugs (r = 0.52; P < .002; Figure 4B), indicating that parasite growth in the first day after treatment with slow-acting drugs was still dependent on parasite growth before treatment. The estimated slope for slow-acting drugs (1.00; 95% CI, .43–1.6) was not significantly different from the estimated slope in the pretreatment data (0.93; 95% CI, .47–1.4; P = .78; Figure 4B [blue vs black dashed lines]). However, when we kept the slope equal for the 2 groups, the estimated intercept of the linear fit of the slow-acting drugs was significantly less than the intercept estimated for the pretreatment data (−2.0/day [95% CI, −3.0 to −1.1] and 0.18/day [95% CI, −.52–.87], respectively; P < .0001), indicating that slow-acting drugs were boosting the natural killing rate. In contrast, when considering volunteers treated with fast-acting drugs, we found no significant correlation between expected and observed growth in parasitemia level (r = −0.025; P = .88; Figure 4B), showing that, over the first 24 hours, fast-acting drugs acted independently of the stage of the parasite growth cycle at which they were administered. The mean growth rate over the first 24 hours after treatment with a fast-acting drug was −2.7/day (95% CI, −3.3 to −2.2).
Together these results suggest that both slow-acting drugs and fast-acting drugs reduce parasite growth in the first 24 hours after treatment. However, the fast-acting drugs reduce parasite growth in a manner independent of the time that treatment is administered in the periodic growth cycle (Figure 5C), whereas slow-acting drugs reduce parasite growth in a manner dependent on the timing in the first 24 hours after treatment (Figure 5B). When little parasite growth was expected in a volunteer after treatment, there was little difference in the effect of slow-acting drugs and fast-acting drugs (Figure 4B [left side of plot]), but when rapid parasite growth was expected in volunteers after treatment, fast-acting drugs caused much greater reductions in parasitemia levels, compared with slow-acting drugs (Figure 4B [right side of plot]).
DISCUSSION
Current approaches to estimating antimalarial efficacy involve analyzing the exponential rate of decline in parasitemia level. This is clearly important when the aim of treatment is parasite eradication and the prevention of recrudescence. Thus, this may be the ideal measure when selecting drugs for use in mass-administered drug therapy or intermittent preventive therapy or when monitoring drug resistance [28]. However, measuring the exponential decay rate may be less useful for prioritizing drugs for use in severe malaria, where rapid early action is considered essential. The ideal drugs for treatment of severe malaria are likely those that rapidly reduce parasite loads in the first 24 hours after treatment commences. This window is often included in the lag phase before exponential declines in parasitemia level begin and so is disregarded in standard efficacy assays.
In this study we used measurements of parasitemia level prior to treatment and the cyclical nature of parasite growth to successfully predict rises and falls in parasitemia level in the lag phase (Figure 4). We have demonstrated that rises in parasitemia level after treatment are the result of therapy commencing too late in the parasite maturation cycle to prevent parasites completing another round of multiplication (ie, when there are many late-stage parasites). The antimalarials examined did not have a major effect on parasite kinetics in the first 12 hours after treatment (Figure 4A). However, an effect on the parasite growth was seen for both slow-acting drugs and fast-acting drugs in the first 24 hours after treatment (Figure 4B). In particular, we observed that the fast-acting drugs reduced parasite numbers in the first 24 hours after treatment, regardless of where, in the parasite growth cycle, they were administered; this was not true of slow-acting antimalarials (Figure 4B). This is consistent with the suggestion that fast-acting drugs (such as the artemisinins) have a greater capacity to prevent schizogony [15], particularly when administered at a point where rapid parasite growth was expected (Figure 4B). Hence, it seems that both the speed of action of a drug, as well as its efficacy against late-stage parasites, may be crucial factors [12, 13, 29] in preventing further parasite growth in the first 24 hours after treatment. This highlights that some antimalarials may be superior to others in controlling early rises in parasitemia level after treatment and provides a means and strong justification for assessing antimalarials for their capacity for preventing these rises in parasitemia level.
Previous studies have shown that patients admitted to the hospital with many late-stage parasites are at highest risk of death due to malaria [30, 31]. It has been proposed that this is due to 2 main factors. First, since most mature parasites are sequestered, for a given level of parasitemia the total parasite burden is likely underestimated in mature-stage infections as compared to ring-stage infections. Second, with mature-stage parasites, there is a much shorter window of drug action to prevent rupture and subsequent increased parasite numbers. Here we provide a mechanistic link between treating patients at a trough in parasitemia level (with mainly mature-stage parasites) and an increased likelihood that parasite numbers will rise after treatment. Together these findings suggest that the presence of late-stage parasites at the time of treatment places patients at risk of fatal outcome because higher parasite loads are expected in these patients even after treatment commences.
We note that our study analyzed data from synchronous infection from blood-stage challenge, and the degree of synchrony may vary in natural infection. In the case of asynchronous infection, this means that there is always a cohort of parasites about to undergo schizogony. Thus, the proportion of the (asynchronous) population that undergoes schizogony will still be affected by the speed of onset of drug action.
In clinical studies of therapy in severe malaria, historical measurements of parasite growth in a patient prior to treatment are usually not available. Hence, the methods presented here, using a prospectively collected data set, that compare the expected and observed growth rates after treatment have a limited application to clinical trials where parasite growth data prior to treatment are not available. However, our work has indicated that the early variation in parasite dynamics after treatment is the result of the natural variation in the parasite life stages present in patients at the time of their treatment. Hence, by taking this natural variation in parasite life stages into account when assessing antimalarials, it will be possible to improve the power of clinical trials to identify differences between drugs and their ability to prevent further rises in parasitemia level. This could be achieved using alternate methods to estimate the stage in the periodic parasite growth cycle at which patients were treated. For example, quantifying the life stages present in a host at the time of treatment by microscopy or PCR may provide some indication of the stage in the parasite growth cycle at which treatment commenced [32, 33]. Alternatively, the proportion of people who experience a rise in parasitemia level after treatment should be reduced with faster-acting antimalarials [14], and it has been shown that the proportion of patients with early rises in parasitemia level is a useful indicator of drug failure [34].
The World Health Organizations guidelines for treatment of complicated and uncomplicated malaria differ, suggesting that, for complicated malaria, initial intravenous therapy with artesunate should be administered, followed by a slower-acting drug to prevent recrudescence [35]. Here we propose that 2 measures of drug efficacy might be considered separately. The first is the ability of a drug to eradicate the parasite and reduce the potential for recrudescence and further transmission (which is likely well measured by the exponential phase of parasite clearance under therapy, and is important for parasite eradication). The second is the effectiveness of a drug to rapidly reduce parasite loads immediately after treatment, which may be a better predictor of its efficacy at reducing morbidity and mortality in cases of severe malaria.
Supplementary Data
Supplementary materials are available at http://jid.oxfordjournals.org. Consisting of data provided by the author to benefit the reader, the posted materials are not copyedited and are the sole responsibility of the author, so questions or comments should be addressed to the author.
Notes
Financial support. This work was supported by the Australian Research Council DP120100064, the National Health and Medical Research Council (grants 1082022 [to D. S. K.], 1082022 [to D. C.], 1082022, 1080001 [to M. P. D.], and 1041802 [to J. M. C.]), the Australian Centre for Immunotherapy and Vaccine Development, the Medicines for Malaria Venture (through grants from the Wellcome Trust and the Bill and Melinda Gates Foundation), the Australian Federal Government (support to D. S. K.), and the Government of Queensland (support to J. M. C.).
Potential conflicts of interest. All authors: No reported conflicts. All authors have submitted the ICMJE Form for Disclosure of Potential Conflicts of Interest. Conflicts that the editors consider relevant to the content of the manuscript have been disclosed.
References
- 1.Marsh K, Forster D, Waruiru C et al. . Indicators of life-threatening malaria in African children. N Engl J Med 1995; 332:1399–404. [DOI] [PubMed] [Google Scholar]
- 2.Lackritz EM, Campbell CC, Ruebush TK et al. . Effect of blood transfusion on survival among children in a Kenyan hospital. Lancet 1992; 340:524–8. [DOI] [PubMed] [Google Scholar]
- 3.Bojang KA, van Hensbroek MB, Palmer A, Banya WA, Jaffar S, Greenwood BM. Predictors of mortality in Gambian children with severe malaria anaemia. Ann Trop Paediatr 1997; 17:355–9. [DOI] [PubMed] [Google Scholar]
- 4.Flegg JA, Guerin PJ, White NJ, Stepniewska K. Standardizing the measurement of parasite clearance in falciparum malaria: the parasite clearance estimator. Malar J 2011; 10:339. [DOI] [PMC free article] [PubMed] [Google Scholar]
- 5.White NJ, Chapman D, Watt G. The effects of multiplication and synchronicity on the vascular distribution of parasites in falciparum malaria. Trans R Soc Trop Med Hyg 1992; 86:590–7. [DOI] [PubMed] [Google Scholar]
- 6.White NJ. The parasite clearance curve. Malar J 2011; 10:278. [DOI] [PMC free article] [PubMed] [Google Scholar]
- 7.Silachamroon U, Phumratanaprapin W, Krudsood S et al. . Frequency of early rising parasitemia in falciparum malaria treated with artemisinin derivatives. Southeast Asian J Trop Med Public Health 2001; 32:50–6. [PubMed] [Google Scholar]
- 8.Gachot B, Houze S, Le Bras J, Charmot G, Bédos JP, Vachon F. Possible prognostic significance of a brief rise in parasitaemia following quinine treatment of severe Plasmodium falciparum malaria. Trans R Soc Trop Med Hyg 1996; 90:388–90. [DOI] [PubMed] [Google Scholar]
- 9.Farnert A, Snounou G, Rooth I, Bjorkman A. Daily dynamics of Plasmodium falciparum subpopulations in asymptomatic children in a holoendemic area. Am J Trop Med Hyg 1997; 56:538–47. [DOI] [PubMed] [Google Scholar]
- 10.Dondorp AM, Fanello CI, Hendriksen ICE et al. . Artesunate versus quinine in the treatment of severe falciparum malaria in African children (AQUAMAT): an open-label, randomised trial. Lancet 2010; 376:1647–57. [DOI] [PMC free article] [PubMed] [Google Scholar]
- 11.Ndour PA, Lopera-Mesa TM, Diakité SAS et al. . Plasmodium falciparum clearance is rapid and pitting independent in Immune malian children treated with artesunate for malaria. J Infect Dis 2015; 211:290–7. [DOI] [PMC free article] [PubMed] [Google Scholar]
- 12.Ter Kuile F, White NJ, Holloway P, Pasvol G, Krishna S. Plasmodium falciparum: in vitro studies of the pharmacodynamic properties of drugs used for the treatment of severe malaria. Exp Parasitol 1993; 76:85–95. [DOI] [PubMed] [Google Scholar]
- 13.Wilson DW, Langer C, Goodman CD, McFadden GI, Beeson JG. Defining the timing of action of antimalarial drugs against Plasmodium falciparum. Antimicrob Agents Chemother 2013; 57:1455–67. [DOI] [PMC free article] [PubMed] [Google Scholar]
- 14.White NJ. Assessment of the pharmacodynamic properties of antimalarial drugs in vivo. Antimicrob Agents Chemother 1997; 41:1413. [DOI] [PMC free article] [PubMed] [Google Scholar]
- 15.White NJ. Clinical pharmacokinetics and pharmacodynamics of artemisinin and derivatives. Trans R Soc Trop Med Hyg 1994; 88 (suppl 1):S41–3. [DOI] [PubMed] [Google Scholar]
- 16.Rockett RJ, Tozer SJ, Peatey C et al. . A real-time, quantitative PCR method using hydrolysis probes for the monitoring of Plasmodium falciparum load in experimentally infected human volunteers. Malar J 2011; 10:48. [DOI] [PMC free article] [PubMed] [Google Scholar]
- 17.McCarthy JS, Sekuloski S, Griffin PM et al. . A pilot randomised trial of induced blood-stage Plasmodium falciparum infections in healthy volunteers for testing efficacy of new antimalarial drugs. PLoS One 2011; 6:e21914. [DOI] [PMC free article] [PubMed] [Google Scholar]
- 18.Sanz LM, Crespo B, De-Cózar C et al. . P. falciparum in vitro killing rates allow to discriminate between different antimalarial mode-of-action. PLoS One 2012; 7:e30949. [DOI] [PMC free article] [PubMed] [Google Scholar]
- 19.Nakazawa S, Maoka T, Uemura H, Ito Y, Kanbara H. Malaria parasites giving rise to recrudescence in vitro. Antimicrob Agents Chemother 2002; 46:958–65. [DOI] [PMC free article] [PubMed] [Google Scholar]
- 20.Marquart L, Baker M, O'Rourke P, McCarthy JS. Evaluating the pharmacodynamic effect of antimalarial drugs in clinical trials by quantitative PCR. Antimicrob Agents Chemother 2015; 59:4249–59. [DOI] [PMC free article] [PubMed] [Google Scholar]
- 21.Barends M, Jaidee A, Khaohirun N, Singhasivanon P, Nosten F. In vitro activity of ferroquine (SSR 97193) against Plasmodium falciparum isolates from the Thai-Burmese border. Malar J 2007; 6:81. [DOI] [PMC free article] [PubMed] [Google Scholar]
- 22.Held J, Supan C, Salazar CLO et al. . Ferroquine and artesunate in African adults and children with Plasmodium falciparum malaria: a phase 2, multicentre, randomised, double-blind, dose-ranging, non-inferiority study. Lancet Infect Dis 2015; 12:1409–19. [DOI] [PubMed] [Google Scholar]
- 23.Charman SA, Arbe-Barnes S, Bathurst IC et al. . Synthetic ozonide drug candidate OZ439 offers new hope for a single-dose cure of uncomplicated malaria. Proc Natl Acad Sci U S A 2011; 108:4400–5. [DOI] [PMC free article] [PubMed] [Google Scholar]
- 24.Phillips MA, Lotharius J, Marsh K et al. . A long-duration dihydroorotate dehydrogenase inhibitor (DSM265) for prevention and treatment of malaria. Sci Transl Med 2015; 7:296ra111. [DOI] [PMC free article] [PubMed] [Google Scholar]
- 25.Hall J. Linear Deming regression. MATLAB Central File Exchange, 2011. Accessed 23 March 2016.
- 26.Dogovski C, Xie SC, Burgio G et al. . Targeting the cell stress response of plasmodium falciparum to overcome artemisinin resistance. PLoS Biol 2015; 13:e1002132. [DOI] [PMC free article] [PubMed] [Google Scholar]
- 27.Douglas AD, Edwards NJ, Duncan CJA et al. . Comparison of modeling methods to determine liver-to-blood inocula and parasite multiplication rates during controlled human malaria infection. J Infect Dis 2013; 208:340–5. [DOI] [PMC free article] [PubMed] [Google Scholar]
- 28.Phyo AP, Nkhoma S, Stepniewska K et al. . Emergence of artemisinin-resistant malaria on the western border of Thailand: a longitudinal study. Lancet 2012; 379:1960–6. [DOI] [PMC free article] [PubMed] [Google Scholar]
- 29.Geary TG, Divo AA, Jensen JB. Stage specific actions of antimalarial drugs on Plasmodium falciparum in culture. Am J Trop Med Hyg 1989; 40:240–4. [DOI] [PubMed] [Google Scholar]
- 30.Silamut K, White NJ. Relation of the stage of parasite development in the peripheral blood to prognosis in severe falciparum malaria. Trans R Soc Trop Med Hyg 1993; 87:436–43. [DOI] [PubMed] [Google Scholar]
- 31.Newton PN, Stepniewska K, Dondorp A et al. . Prognostic indicators in adults hospitalized with falciparum malaria in Western Thailand. Malar J 2013; 12:229. [DOI] [PMC free article] [PubMed] [Google Scholar]
- 32.Mok S, Ashley EA, Ferreira PE et al. . Population transcriptomics of human malaria parasites reveals the mechanism of artemisinin resistance. Science 2014; 347:431–5. [DOI] [PMC free article] [PubMed] [Google Scholar]
- 33.Pelle KG, Oh K, Buchholz K et al. . Transcriptional profiling defines dynamics of parasite tissue sequestration during malaria infection. Genome Med 2015; 7:19. [DOI] [PMC free article] [PubMed] [Google Scholar]
- 34.Watt G, Shanks GD, Phintuyothin P. Prognostic significance of rises in parasitemia during treatment of falciparum-malaria. Trans R Soc Trop Med Hyg 1992; 86:359–60. [DOI] [PubMed] [Google Scholar]
- 35.World Health Organization (WHO). Guidelines for the treatment of malaria. Geneva: WHO, 2010.
Associated Data
This section collects any data citations, data availability statements, or supplementary materials included in this article.