Abstract
Yeasts, which have been a component of the human diet for at least 7000 years, possess an elaborate cell wall α-mannan. The influence of yeast mannan on the ecology of the human microbiota is unknown. Here we show that yeast α-mannan is a viable food source for Bacteroides thetaiotaomicron (Bt), a dominant member of the microbiota. Detailed biochemical analysis and targeted gene disruption studies support a model whereby limited cleavage of α-mannan on the surface generates large oligosaccharides that are subsequently depolymerized to mannose by the action of periplasmic enzymes. Co-culturing studies showed that metabolism of yeast mannan by Bt presents a ‘selfish’ model for the catabolism of this recalcitrant polysaccharide. This report shows how a cohort of highly successful members of the microbiota has evolved to consume sterically-restricted yeast glycans, an adaptation that may reflect the incorporation of eukaryotic microorganisms into the human diet.
The microbial community in the human large bowel, the microbiota,1,2 is central to the health and nutrition of its host3–6. Glycan utilization is a key evolutionary driver underpinning the structure1,2 of this microcosm1,2 with the Bacteroidetes playing a dominant role in this process. The genomes of Bacteroidetes contain Polysaccharide Utilization Loci (PULs)7 that encode the apparatus required to utilize complex carbohydrates, with each PUL orchestrating the degradation of a specific glycan.
The microbiota contains a cohort of bacteria that target α-mannosidic linkages8,9, indicating that α-mannose-containing glycans, such as yeast and other fungal α-mannans are significant nutrients for these microbes (see Supplementary Information 1.0). Furthermore, these glycans are implicated in the immunopathology of the inflammatory bowel disease, Crohn’s disease10,11 (Supplementary Information 2.0). The genome of Bacteroides thetaiotaomicron (Bt), a dominant member of the microbiota, encodes 36 proteins predicted to display α-mannosidase or α-mannanase activity12. Here we unravel the mechanism by which Bt metabolizes the major α-mannose-containing glycans presented to the large bowel. The data show that Bt expresses a specific yeast α-mannan degrading system that is distinct from the high mannose mammalian N-glycan (HMNG) depolymerizing apparatus.
Bt polysaccharide utilization loci dedicated to yeast α-mannan degradation
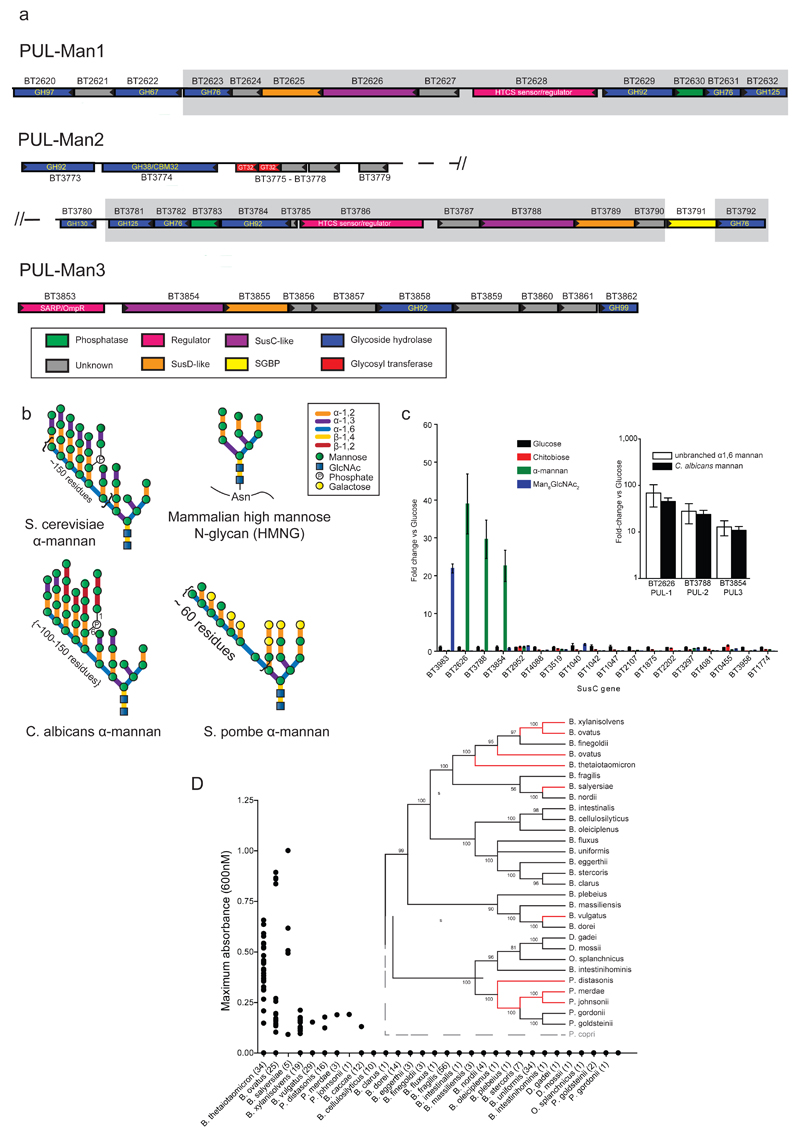
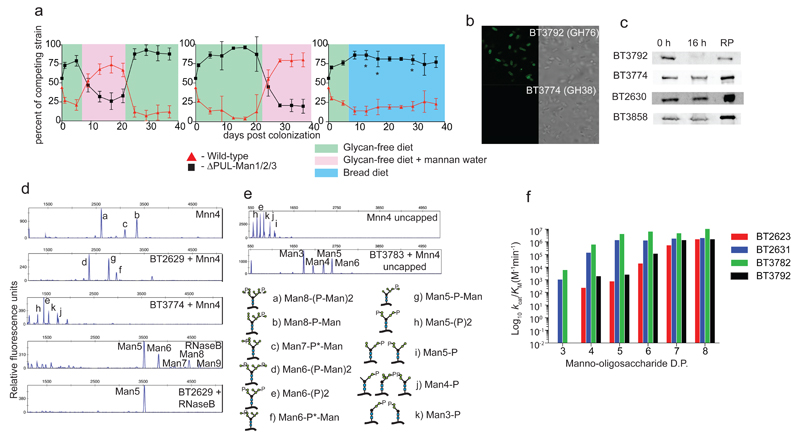
Bt utilizes α-mannan as a sole carbon source and transcriptional studies identified three Bt PULs (PUL-Man1, PUL-Man2 and PUL-Man3), Fig. 1a, that were activated by α-mannan from Saccharomyces cerevisiae13, Schizosaccharomyces pombe and the pathogenic yeast Candida albicans, Fig. 1b, Extended Data Fig. 1ab. Bt mutants lacking PUL-Man2 or PUL-Man1/2/3 were unable to grow on yeast mannan (YM) in vitro, Extended Data Fig. 1c. In gnotobiotic mice fed a diet lacking glycans the Bt mutant ΔPUL-Man1/2/3 outcompeted the wild type bacterium, while the wild-type strain was the dominant species in rodents fed a YM-rich diet, Fig 2a. These data underscore the importance of PUL-Man1/2/3 when Bt is exposed to yeast mannan in vivo, while the intriguing dominance of the mutant strain in animals fed a polysaccharide-free diet is further considered in Supplementary Information 3.2. To explore whether Bt degraded α-mannan and HMNG13 by distinct enzyme systems, the PULs activated by a HMNG, Man8GlcNAc2, were evaluated. A single PUL was activated by Man8GlcNAc2, which was distinct from PUL-Man1/2/3, Fig. 1c, demonstrating that degradation and thus utilization of α-mannan and HMNG are orchestrated by different PULs.
Fig. 1. B. thetaiotaomicron PULs involved in yeast α-mannan metabolism, and utilization of the glycan in Bacteroidetes.
a, Genes encoding known or predicted functionalities are color-coded and, where appropriate, annotated according to their CAZy family. SGBP; Surface Glycan Binding Protein. b, structures of yeast (S. cerevisiae) mannan and HMNG. c, cells were grown on media containing glycans as the sole carbon source (n=3 separate cultures per substrate), and susC transcripts derived from PULs that encode GH76 and/or, GH92 enzymes were quantified by qPCR. y-axis: fold-change relative to glucose grown cells. x-axis labels: genes probed. Inset: levels of susC transcripts derived from PUL-Man1/2/3 when Bt was cultured on mannan comprising only the α1,6-Man backbone or Candida albicans mannan. Data are averages and standard deviations of three biological replicates. d, strains of 29 different bacterial species of Bacteroidetes were inoculated into minimal media containing S. cerevisiae mannan as sole carbon source (n=2 replicate cultures per strain). Growth measured at 48 h at A600nm. Inset: phylogeny of Bacteroidetes species; organisms growing on mannan connected by red lines.
Fig. 2. Mannan PULs enable colonization of gnotobiotic mice; key biochemical and cellular features of the encoded enzymes.
a, colonization of gnotobiotic mice (n=5) by wild type Bt (red) and a mutant (black) lacking PUL-Man1/2/3. On day 0 mice were gavaged with ~108 CFUs of 50:50 of the two Bt strains and then fed a control diet lacking Bt-digestible glycans (green). Left: after 7 days the control diet was supplemented with 1% YM in drinking water (pink shading). Middle: identical treatment to the left Panel except no mannan was included after day 7 (shaded green). At day 21 mannan in the water was switched between the groups in the left and middle panels, indicated by the color panels (pink=mannan, green=no mannan). Right: mice fed the control diet (shaded green) were switched to a diet containing leavened bread (blue). The average abundance of the mannan utilization mutant (black) in mice fed the bread diet compared to the corresponding time points in mice fed the glycan-free diet (mean±s.e.m., 81%±1.2 in animals fed the bread diet versus 90%±1.7 in mice fed the glycan-free diet; P = 0.00005 by unpaired student’s t test). Time points at which there was a significant difference between the mutant and wild type Bt on the bread diet compared to the glycan-free diet (P ≤ 0.05) are indicated with an asterisk . b, fluorescent and light microscopic images of Bt incubated with polyclonal antibodies against BT3792 and BT3774. c, western blots of Bt cells cultured on YM that were untreated with proteinase K (0 h) or incubated with 2 mg/ml proteinase K for 16 h. RP; recombinant protein. Blots were probed with antibodies against the Bt enzymes. Localisation blots and microscopy images (b,c) are representative data from three biological replicates. d, e, phosphorylated high mannose N-glycan MNN4 and RNAaseB incubated with BT2629 (GH92 α-mannosidase), BT3783 (phosphatase) or BT3774 (GH38 α-mannosidase) and the products analyzed by capillary electrophoresis. M5 to M9 lack phosphate and mannose-1-phosphate groups. f, catalytic efficiency of the endo-α1,6-mannanases against α-1,6-mannooligosaccharides (SITable 4 full data).
Analysis of the growth profiles of 29 human gut Bacteroidetes species revealed that nine species metabolized S. cerevisiae α-mannan with 33 out of 34 strains of Bt growing on the glycan Fig. 1d. These data show that Bt, along with some of its phylogenetically related neighbours, dominates YM metabolism in the Bacteroidetes phylum of the microbiota. Within fully-sequenced genomes of 177 microbiota members, the presence of the enzyme families (GHs) integral to α-mannan degradation (GH38, GH92 and GH76) are restricted to five species of Bacteroides and three of Parabacteroides; no Firmicutes contained this grouping of GHs8.
Structure of the Bt α-mannan degrading PULs
Bt PUL-Man1 and PUL-Man2 display significant synteny, Supplementary Table 1, while PUL-Man3 displays no organizational similarity to the other two loci, Fig. 1a. Characterization of the 15 enzymes encoded by the mannan PULs revealed that these loci orchestrate α-mannan degradation from diverse yeasts and possibly other fungi. For example, PUL-Man1 contains an α-galactosidase, BT2620, which targets α-galactosyl linkages absent in S. cerevisiae mannan but present in other fungal α-mannans such as the yeast Sc. pombe14, Extended Data Fig. 1d, explaining why inactivation of PUL-Man1 affects growth of Bt on this polysaccharide, Extended Data Fig. 1b. Functional diversity is also evident in PUL-Man2, which, in addition to its catabolic role, encodes glycosyltransferases that mediate synthesis of the trisaccharide Man-α1,3-[Man-α1,6]-Man, Extended Data Fig. 2. Thus, PUL-Man2 comprises a unique example of the co-regulation of related catabolic and biosynthetic functions within a single PUL13.
α-Mannan degradation occurs at the cell surface and in the periplasm
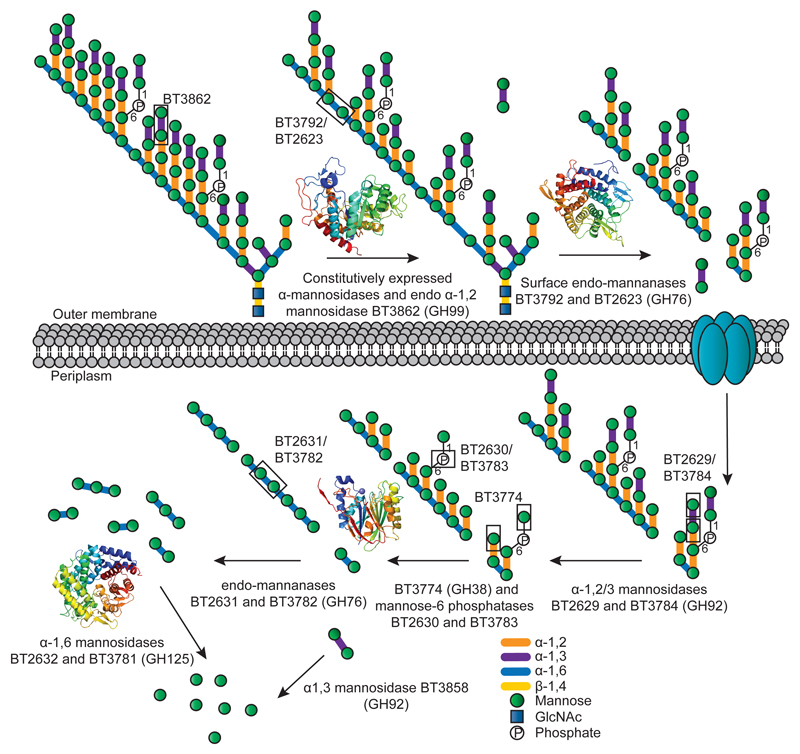
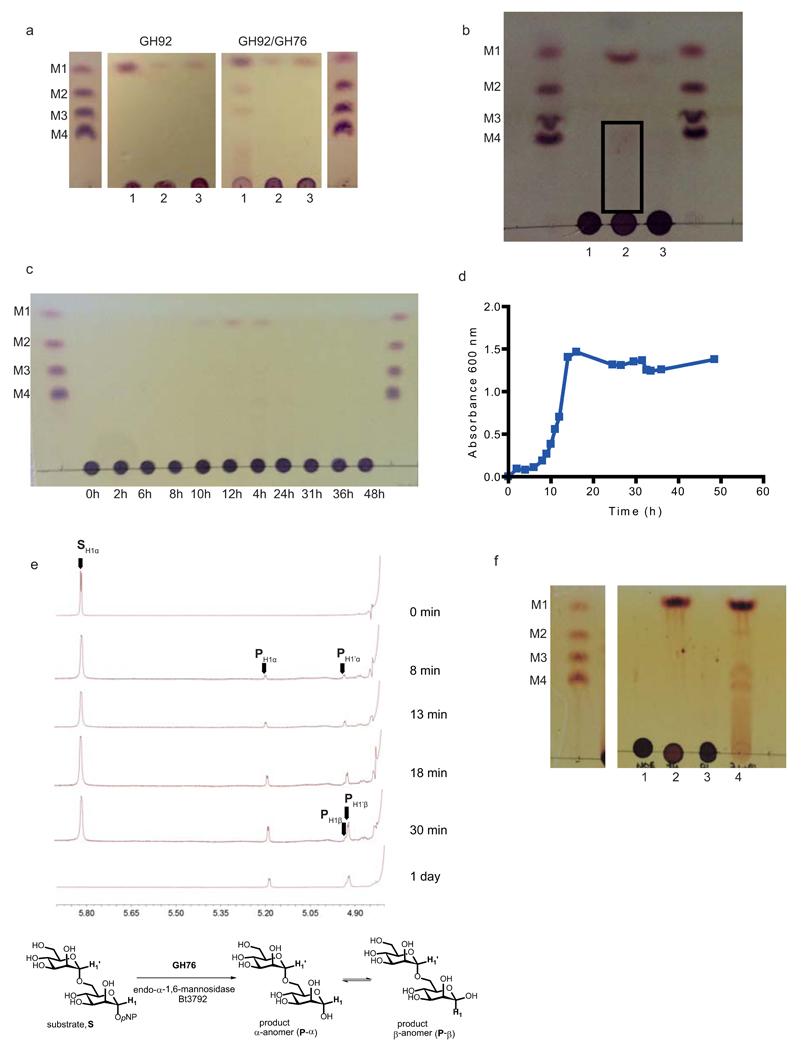
The enzymatic degradation of α-mannan is restricted through steric constraints imposed through the side chains appended to the backbone, Supplementary Table 2, Extended Data Fig. 1e and 4a. Critically, the α-1,6-Man-backbone is not accessible to the endo-α1,6-mannanases until the side chains have been removed, consistent with the topography of the substrate binding cleft of these enzymes, Extended Data Fig. 3ab. The PUL-Man3-encoded endo-α1,2-mannosidase, BT3862, released a limited proportion of the terminal Man-α1,3-Man disaccharides, thereby assisting in exposing the backbone. The structural basis for the specificity displayed by BT3862 is described in Extended Data Fig. 3cd. In addition to BT3862, other surface enzymes are required to partially expose the α-1,6-Man-backbone. Screening for such enzymes revealed a α-mannosidase, BT2199, that mediates very limited extracellular removal of side chains, Extended Data Fig. 4a, and thus facilitates limited cleavage of the mannan backbone by the surface endo-α1,6-mannanases, BT2623 and BT3792. The activity profiles of BT2199 and the surface endo-acting mannanases are consistent with the observed production of large oligosaccharides by non-growing cells of Bt incubated with YM, Extended Data Fig. 4bc.
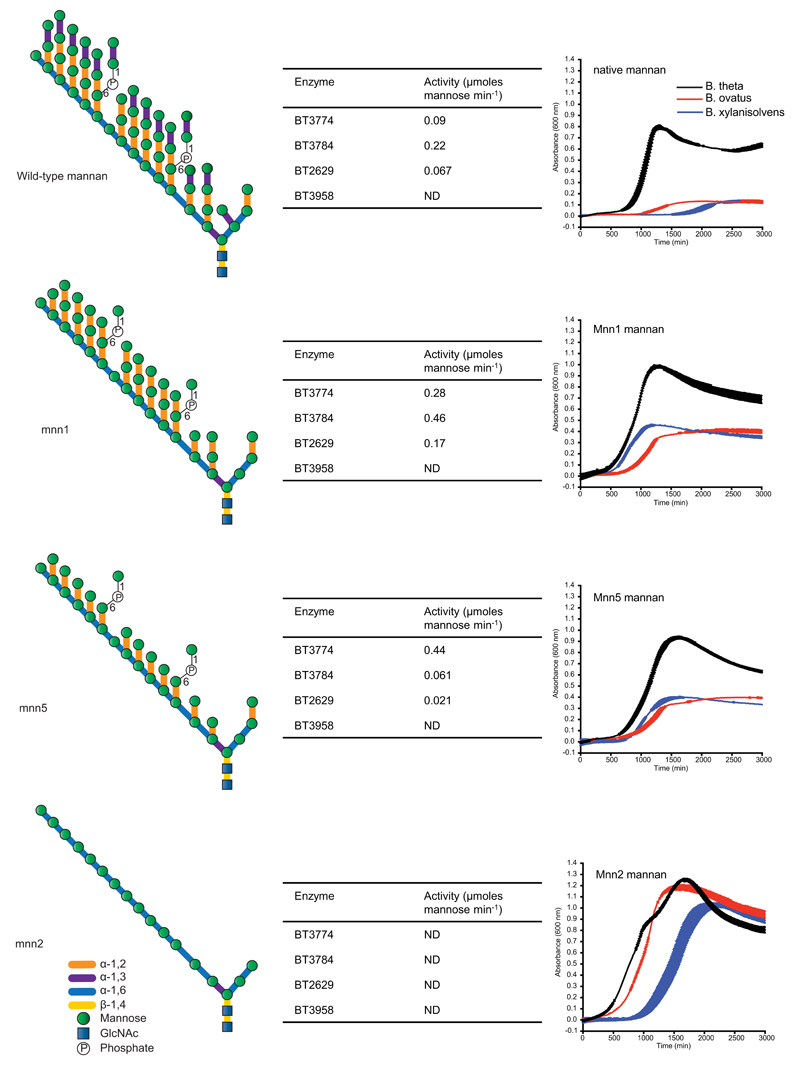
The cellular location of the key α-mannan hydrolysing enzymes, Fig. 2bc, indicates that the polysaccharide is degraded primarily in the periplasm where the side chains are removed by the synergistic action of α-mannosidases and sugar-6-monophosphatases, Extended Data Fig. 515, Fig. 2de, Supplementary Tables 2 and 3 and Supplementary Information 4.0. The broad specificity of BT3774 enables the α-mannosidase to play a key role in the removal of the uncharged side chains, being the only enzyme capable of removing the sterically-restricted α1,2-Man units linked to the α-mannan backbone, Fig. 3 and Extended Data Fig. 4f and 5, as well as cleaving the Man-1-phosphate linkage, a critical step in the removal of the phosphorylated branches, Fig. 2d. The importance of BT3774 in α-mannan is consistent with the growth profile of the Bt mutant Δbt3774, Extended Data Fig. 1d.
Fig. 3. Model of YM deconstruction by Bt.
Boxes show examples of bonds cleaved by the endo-α1,2-mannosidase BT3862, by the α-1,3- and α-1,2-mannosidase activities displayed by BT2629 and BT3784, and the Man-1-P and α-1,2-Man linkages targeted by BT3774. Structures of the enzymes that play a key role in mannan degradation, colour-ramped from the N (blue) to the C (red) terminus; ED Fig. 3 provides. In this model limited degradation occurs at the surface and the bulk of glycan degradation occurs in the periplasm. SusC-like proteins mediate transport across the outer membrane7.
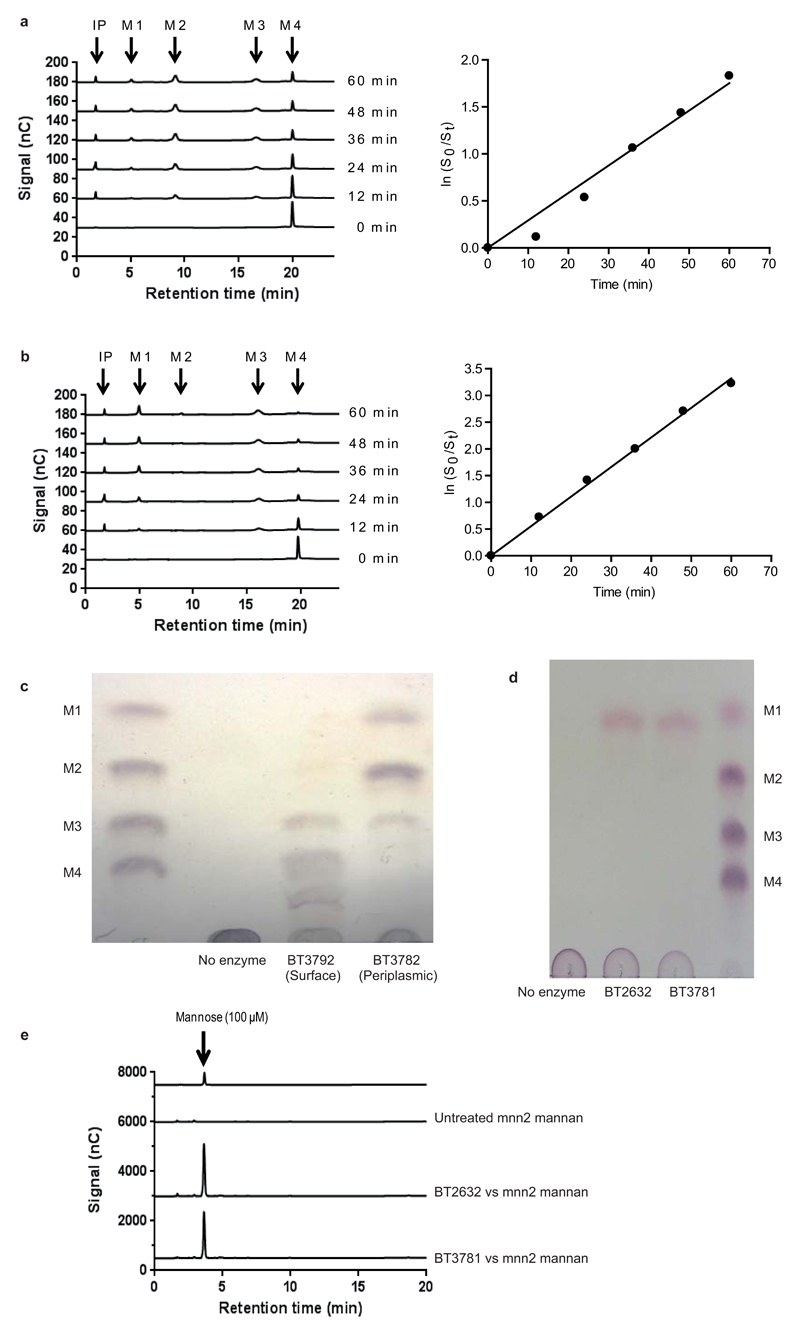
Hydrolysis of the α1,6-Man backbone of α-mannan by Bt was mediated by surface and periplasmic “retaining” endo-α1,6-mannanases, Extended Data Fig. 4e. The surface endo-mannanases BT2623 and BT3792, Fig. 2bc, generated large oligosaccharides, while the periplasmic mannanases, BT2631 and BT3782, produced small limit products, Extended Data Fig. 6a-c. Consistent with these product profiles, the periplasmic enzymes were ~100 to 1,000-fold more active than the surface mannanases against oligosaccharides with a degree of polymerization (d.p.) <6, while against large oligosaccharides (d.p. ≥6) the periplasmic and surface enzymes displayed broadly similar activities, Fig. 2f and Supplementary Table 4. The unadorned α1,6-mannooligosaccharides generated in the periplasm were hydrolyzed by the exo-α-1,6-mannosidases BT2632 and BT3781, Extended Data Fig. 6de and Supplementary Table 2, as previously proposed16. The inability of the backbone cleaving enzymes to attack wild type yeast α-mannan indicates that these glycoside hydrolases cannot accommodate α-1,6-linked Man decorated at O2 (side chains are appended α-1,2 to the mannan backbone) in the active site or proximal subsites, consistent with the structures of the substrate binding clefts of BT3792 and BT3781, Extended Data Fig. 3a-f.
A Bt PUL for HMNG catabolism
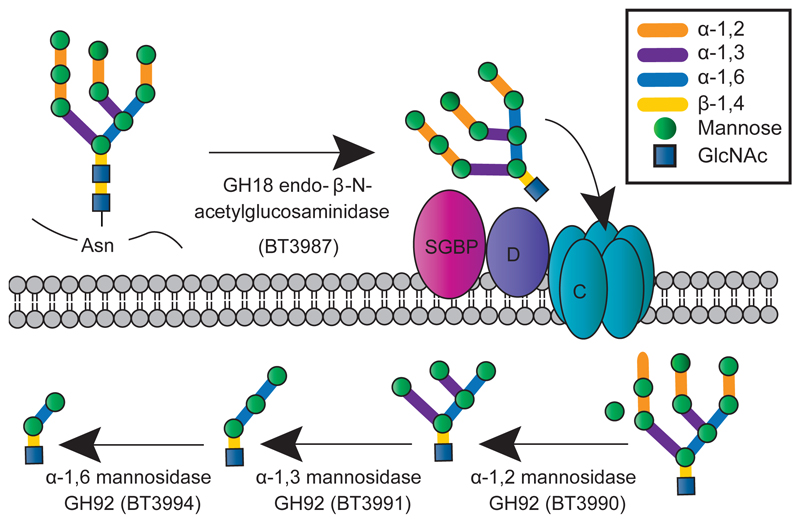
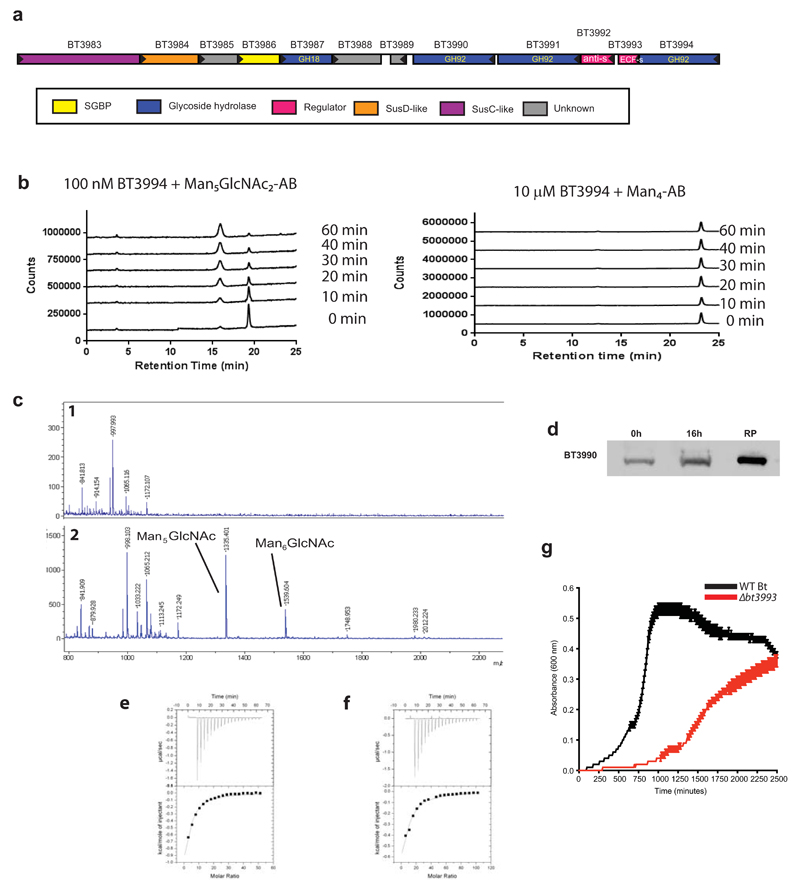
PUL-HMNG encodes four enzymes and two surface glycan binding proteins, Extended Data Fig. 7a. BT3990 and BT3991 target α1,2-Man and α1,3-Man linkages, respectively, in HMNGs17. The terminal undecorated α1,6-Man exposed by BT3990 is hydrolyzed by BT3994, which requires GlcNAc at the reducing end for activity, producing Man-α1,6-Man-β1,4-GlcNAc, Extended Data Fig. 7b. BT3987 is a surface endo-acting N-acetylglucosaminidase, which cleaves the oligosaccharide from its polypeptide, Extended Data Fig. 7cd. The released HMNG is held on the surface of Bt through the mannose-binding protein BT3986, while the SusD homolog, BT3984, by recognizing the reducing end GlcNAc, Extended Data Fig. 7ef and Supplementary Table 5, likely orientates the glycan into the outer membrane porin (SusC homolog BT3983) for transport into the periplasm, where the periplasmic α-mannosidases deconstruct the oligosaccharide into a trisaccharide that is degraded by enzymes that are not encoded by PUL-HMNG. A model for the enzymatic degradation of HMNG is displayed in Fig. 5. The importance of PUL-HMNG in the metabolism of the N-glycan is consistent with the reduced growth of the Δbt3993 mutant (lacking the ECF regulator of PUL-HMNG) cultured on Man8GlcNAc2, Extended Data Fig. 7g.
Fig. 5. Model of HMNG depolymerisation by Bt.
The interaction of mannose with the surface glycan binding protein (SGBP) is shown, while the binding of the SusD homolog (D) to the reducing end GlcNAc directs the N-glycan into the SusC-like (C) porin. In both the yeast mannan and the HMNG models the bulk of glycan degradation occurs in the periplasm (P) and not on the surface. The likely enzymes involved in the periplasmic degradation of the trisaccharide generated by the HMNG-PUL encoded system is addressed in Supplementary Information Section 4.3.
Yeast α-mannan degradation optimized to reduce nutrient loss
Substrate promiscuity is a hallmark of the α-mannan degradation apparatus of Bt as steric constraints limit enzymatic access to the glycan side chains, and consequently the polysaccharide backbone. Accordingly, Bt uniquely uses surface α-mannosidase(s), likely BT2199, to generate limited, but sufficient, side chain removal for the surface endo-acting enzymes to mediate infrequent cleavage of the backbone. The Bt mannan degrading apparatus is optimized to minimize nutrient loss, illustrated by the observation that no oligosaccharides were released into the culture supernatant when Bt was cultured on α-mannan, Extended Data Fig. 4c.
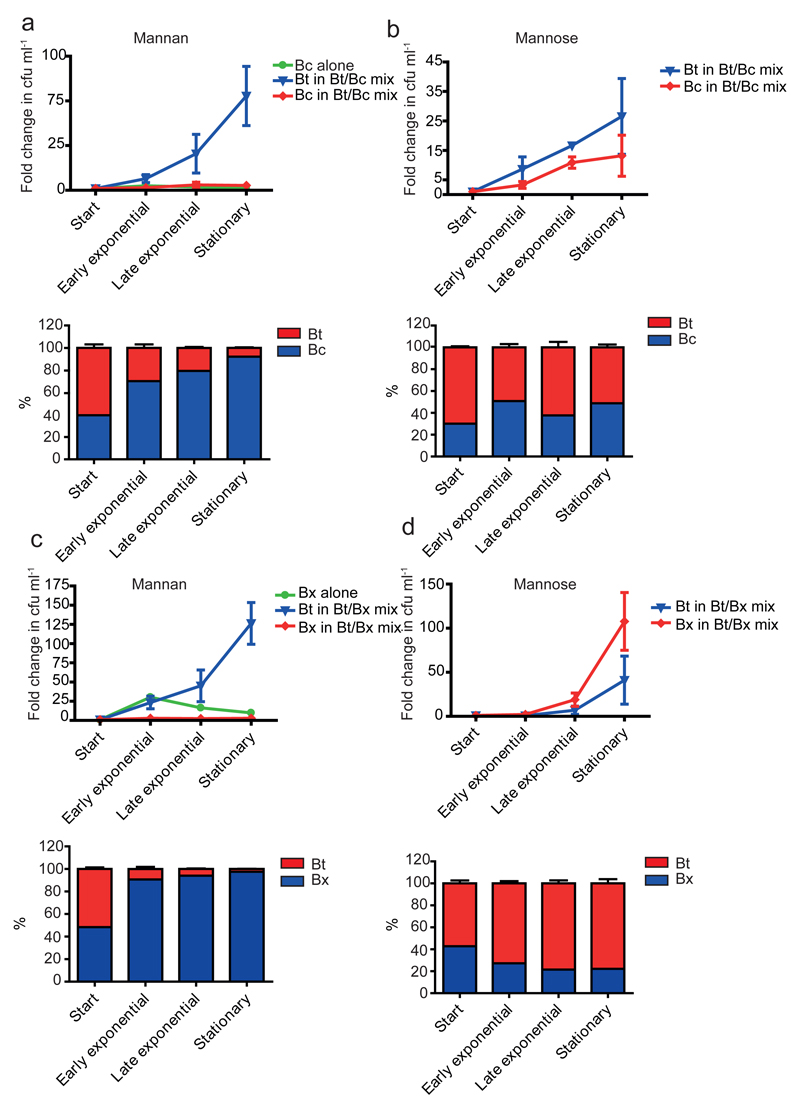
Endo-α1,6-mannanases are central to the hierarchical degradation of YM, reflecting their location and substrate specificities. The surface endo-acting enzymes generate large oligosaccharides minimizing extracellular metabolism and loss to other microbiota residents. The periplasmic endo-α1,6-mannanases generate numerous short oligosaccharides, maximizing the substrate available to the periplasmic exo-acting α-1,6-mannosidases. This “selfish” model is consistent with the inability of Bt to support growth of mannose- and mannan backbone-utilizing strains of Bacteroides, on intact S. cerevisiae α-mannan, Fig. 4. It should be emphasised, however, that the degradation of at least some polysaccharides is mediated through synergistic interactions between different members of the microbiota18,19, illustrating the diverse mechanisms by which nutrients are utilized in this microbial community.
Fig. 4. Bacteroides co-culture sharing experiments.
Bt was co-cultured with a, b, Bacteroides cellulosilyticus WH2 or with c, d, Bacteroides xylanisolvens NLAE-zI-p352 with either mannan (a and c) or mannose (b and d) as sole carbon source. Each non-mannan user was also cultured on mannan independently. The upper graph in each panel depicts the cfu ml-1 of each strain, relative to the cfu ml-1 at inoculation. Total cfu ml-1 were determined by colony counts, and the proportion of each bacteria was determined by qPCR of marker genes from genomic DNA (shown in the lower graph of each panel). Error bars represent s.d. of three biological replicates.
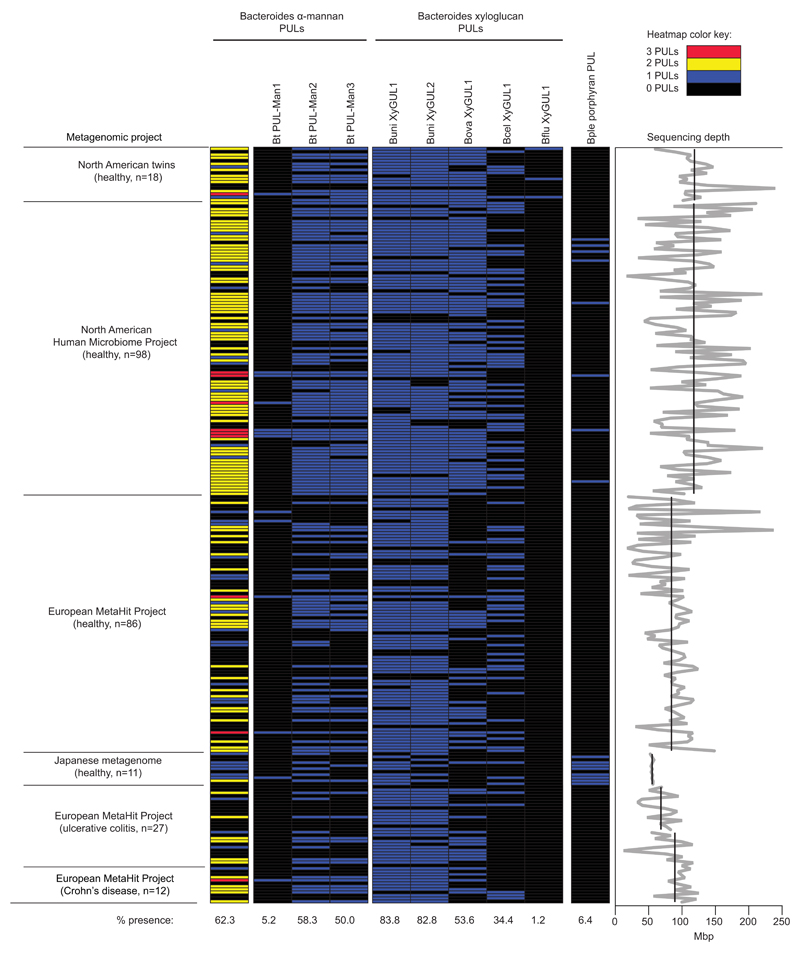
This work provide insights into the adaptation of the microbiota to yeast domestication in the human diet reflecting the regular consumption of yeast-leavened bread, fermented beverages and products such as soy sauce. Bt, and a limited number of other microbiota-derived Bacteroidetes, have evolved a complex machinery to digest and metabolize yeast cell wall mannans. Phylogenetic analysis suggests that this trait penetrated the human gut Bacteroidetes at least twice, once each in the Bacteroides and Parabacteroides. It is also possible, however, that close relatives of Bt have gained parts of this complex catabolic trait via separate events. Analysis of 250 human metagenomic samples revealed α-mannan-degrading PULs closely related to those from Bt in a majority (62%) of subjects, Extended Data Fig. 8, making it more common than culturally-restricted traits like red algal porphyran degradation20, but less common than plant cell wall xyloglucan degrading PULs, identified in divergent Bacteroides species21,22 (see Supplementary Information 3.3).
The α-mannan degrading capacity of Bt is consistent with the bacterium’s “glycan generalist” strategy7,12,23, enabling the microorganism to thrive in the competitive environment of the microbiota, where the omnivore diet of the host requires rapid adaption to the nutrients presented to the distal gut. Many of the organisms in the microbiota produce enzymes that attack the major components of the human diet such as starch and pectins. An additional survival strategy for some members of the microbiota, such as Bt, is the targeting of low abundance, highly complex dietary glycans that are not metabolized by most other organisms, exemplified here by YM. With respect to the human host the degradation of α-mannan by Bt may also be relevant to host immune-maladaptation and inflammatory bowel diseases such as Crohn’s disease. This work provides insights into a sophisticated α-mannan degrading apparatus that exists within widespread members of the human microbiota, thereby revealing the impact made by the historical domestication of yeast and other dietary fungi on the structure of this microbial consortium.
Methods
Biochemical studies
Producing recombinant proteins for biochemical assays
DNAs encoding the mature forms of the enzymes used in this study were amplified by PCR using appropriate primers. The amplified DNAs were cloned into NcoI/XhoI, Nco/BamHI, NdeI/XhoI or NdeI/BamHI restricted pET21a or pET28a, as appropriate. The encoded recombinants generally containing a C-terminal His6-tag although, where appropriate, the His-tag was located at the N-terminus of the protein. The GH92 enzymes encoded by PUL-HMNG were cloned in a previous study17. To express the recombinant genes encoding the mannan degrading enzymes, Escherichia coli strains BL21(DE3) or TUNER, harbouring appropriate recombinant plasmids, were cultured to mid-exponential phase in Luria Bertani broth at 37 °C. This was followed by the addition of 1 mM (strain BL21(DE3)) or 0.2 mM (TUNER) isopropyl β-D-galactopyranoside (IPTG) to induce recombinant gene expression, and the culture was incubated for a further 5 h at 37 °C or 16 h at 16 °C, respectively. The recombinant proteins were purified to >90% electrophoretic purity by immobilized metal ion affinity chromatography using Talon™, a cobalt-based matrix, and eluted with 100 mM imidazole, as described previously24.
Producing recombinant proteins BT3783, BT3792 and BxGH99 for crystallization
pET28a expression vectors encoding mature BT3783 (residues 27 to 314) and BT3792 (residues 155 to 514) were cloned into pET28a via NheI and XhoI sites. The gene encoding BxGH99 was constructed from synthesized oligonucleotide fragments (Genscipt, Inc.) and also subcloned into pET28a using NdeI and XhoI restriction sites. Plasmids encoding BT3783 and BT3792 were transformed into E. coli BL21(DE3) Star chemically competent cells, and grown in LB broth at 37 °C supplemented with 50 µg mL-1 kanamycin. Production of recombinant BT3783 was induced by the addition of 0.2 mM IPTG at a culture OD600 = 0.6, and incubation at 16 °C for 16 h. BT3792 was produced using the autoinduction method 25 by shaking inoculated 0.5 L cultures supplemented with 50 µg mL-1 kanamycin for 36 h at 37 °C and then 48 h at 20 °C. E. coli BL21 (DE3) cells harbouring the BxGH99-encoding plasmid were cultured in 0.5 L ZYM-5052 autoinduction media 25, supplemented with 50 µg mL−1 kanamycin, at 37 °C for 8 h, with induction occurring overnight at 16 °C.
To purify BT3783 and BT3792, cells were harvested by centrifugation and ruptured by chemical lysis procedure at 4 °C. Briefly, cells were resuspended in 25 mL of a solution consisting of 7 % (w/v) sucrose, 50 mM Tris-HCl (pH 7.5), for 5 min. Lysozyme (Sigma-Aldrich; 10 mg) was then added and stirred for 10 min. A solution (50 mL) consisting of 0.6 % (w/v) Triton-X, 0.6% (w/v) deoxycholate, 20 mM Tris-HCl (pH 7.5) was added and stirring continued, after which 5 mM MgCl2 was added followed by addition of DNase (Sigma-Aldrich) to a final 8.5 µg mL-1. The resulting solutions were then centrifuged for 45 min at 18,000 rpm. Similarly, cells harbouring BxGH99 were harvested and resuspended in 50 mM NaH2PO4, pH 8.0, 300 mM NaCl, and lysed by sonication.
BT3783 clarified cell lysates were purified by nickel Sepharose affinity chromatography by stepwise elution with imidazole. Positive fractions identified by SDS gel electrophoresis were dialyzed into 20 mM Tris pH 8.0 and concentrated to 11.25 mg mL-1 with an Amicon stirred ultrafiltration unit model 8200. BT3792 clarified cell lysates were purified via nickel-affinity chromatography, and positive fractions were buffer exchanged by dialysis into 25 mM Tris-HCl (pH 8.0) prior to further purification by anion exchange chromatography. Anion exchange purified BT3792 buffered in 25 mM Tris-HCl (pH 8.0), 500 mM NaCl, and 2 mM DTT was concentrated using a stirred cell Amicon with a 10kDa cutoff to 20 mg ml-1. For BxGH99 soluble lysate (isolated by centrifuging at 18,000 rpm) was applied to a NiSO4-charged 5 mL HiTrap chelating column (GE Healthcare), pre-equilibrated in the same buffer. Protein was eluted in an imidazole gradient, dialyzed, concentrated, and further purified on an S75 16/60 gel filtration column (GE) pre-equilibrated in 25 mM Na-Hepes, pH 7.0, 100 mM NaCl, 1 mM DTT.
Binding studies
Affinity gel electrophoresis was used to screen for potential glycan binding proteins, following the method described in26 with the target polysaccharide at 1 mg ml-1. The binding of proteins to their ligands was quantified by isothermal titration calorimetry (ITC), as described previously26. Titrations were carried out in 50 mM Na-HEPES buffer, pH 7.5 at 25 °C. The reaction cell contained protein at 50 µM, while the syringe contained either the oligosaccharide at 10 mM or polysaccharide at 3–5 mg ml-1. The titrations were analyzed using Microcal Origin version 7.0 software to derive n, Ka, and ΔH values, while ΔS was calculated using the standard thermodynamic equation, RTlnKa = ΔG = ΔH − TΔS.
Glycoside hydrolase and phosphatase assays
α-Mannosidase activity was determined by the continuous monitoring of mannose release using a linked enzyme assay system purchased from Megazyme International (mannose/fructose/glucose detection kit). The reaction was carried out at 37 °C in 50 mM Na-Hepes buffer, pH 7.0 containing 2 mM MgCl2, 1 mM ATP and 1 mM NADP+, excess concentrations of linker enzymes (hexokinase, phosphoglucose isomerase and glucose-6-phosphate dehydrogenase) and 1 mg ml-1 BSA. Through linker enzymes glucose-6-phosphate, generated from the released mannose, is oxidized by glucose-6-phosphate dehydrogenase with concomitant reduction of NADP+ to NADPH, which was monitored at 340 nm using an extinction coefficient of 6223 M−1 cm−1.
The polysaccharide substrates used were Saccharomyces cerevisiae α-mannans from wild type or appropriate mutant strains that produce variants of the polysaccharide (Extended Data Fig. 5); these mannans were purified from stationary phase cultures of the yeast grown in YEPD medium, as described previously15. The α1,6-mannooligosaccharides, which were also used as substrates, were generated as follows: 1 g α-mannan from the S. cerevisiae mutant mnn2 (comprises the α1,6-mannan backbone with no side chains) was digested to completion with the endo-mannanase BT3792. The products were freeze-dried and the small mannooligosacchardes (d.p. 2 to 5) were purified on two P2 Bio-gel columns set up in series, while the large oligosaccharides, with a d.p. of 6 to 8, were fractionated on two P4 Bio-gel columns also in series. The columns were run at 0.2 ml min-1 in distilled water. The 5 ml fractions were evaluated by TLC and those containing the same oligosaccharide were pooled. The activity of the endo-mannanases against α-mannans was determined in 50 mM Na-HEPES buffer pH7.5 containing an appropriate concentration of the polysaccharide (ranging from 0.1-6 mg ml-1) and 1 mg/mL BSA. Reactions were incubated for 30 min at 37 °C and, at regular time intervals, 500 µL aliquots were removed and the amount of reducing sugar was quantified deploying the dinitrosalicylic acid reagent27 and a standard curve of mannose in the reaction conditions used. TLC was also used to provide a qualitative profile of the mannooligosaccharides generated by the GH76 endo-mannanases from these reactions. Around 4 µL of the reaction was spotted on silica gel TLC plates and the plates were developed in butanol:acetic acid:water 2:1:1 and carbohydrate products detected by spraying with 0.5% orcinol in 10% sulphuric acid and heating to 100 °C for 10 min. Substrate depletion assays were used to determine the activity of the endo-mannanases against α1,6-mannooligosaccharides. Briefly 50 µM of the oligosaccharides in 50 mM sodium phosphate buffer, pH 7.5, containing 0.1 mg ml-1 BSA (NaP buffer), was incubated with an appropriate concentration of enzyme (10 to 500 nM). Aliquots were removed at regular intervals for up to 1 h and, after boiling for 10 min to inactivate the enzyme, the amount of the substrate mannooligosaccharide remaining was quantified by HPAEC using standard methodology. Briefly, the reaction products were bound to a Dionex CarboPac PA-200 column equilibrated with 100 mM NaOH. Mannose and mannooligosaccharides were eluted with a 0-200 mM sodium acetate gradient in 100 mM NaOH at a flow rate of 0.25 ml min-1, using pulsed amperometric detection. The data were used to determine catalytic efficiency (kcat/KM) as described previously28. To determine the activity of the GH99 endo-α1,2-mannosidase BT3862, the enzyme was incubated with Man-α1,3-Man-α1,2-Man-α1,2-Man-1-CH3. and, in combination with the α1,2-mannosidase BT3990, mannose release was monitored using the continuous assay described above (BT3990 is active on the product of BT3862, Man-α1,2-Man-α1,2-Man-1-CH3). The activity of BT3862 against aryl-mannosidases was as described previously29. A strategy deploying 2-aminobenzamide (2-AB) labelled glycans at the reducing end, using the Sigma GlycoProfile™ 2-AB labelling kit as per the manufacturer’s instructions, was used to determine the catalytic efficiency of BT3994. The enzyme (100 nM) was incubated with 5 µM Man5GlcNAc2 (generated by treating Man9GlcNAc2 with BT3990 an α1,2-mannosidases) or Man3GlcNAc2 (generated from Man5GlcNAc2 by treating with BT3991, α1,3-mannosidase17) in NaP buffer for up to 1 h. Aliquots were removed at regular intervals and the amount of glycan remaining was determined using HPAEC and a fluorometric detector.. A similar strategy, deploying labelled glycans in harness with HPAEC and fluorescence detection was used to measure the endo-β-N-acetylglucosaminidase activity of BT3987 against Man9GlcNAc2. The activity of the enzyme was also evaluated against glycoproteins using mass spectrometry using MALDI-TOF mass spectrometry as described below. BT2630 and BT3783 were assayed for phosphatase activity using the EnzChek Phosphate Assay kit to detect the release of phosphate from appropriate phosphorylated sugars. Prior to these assays the two proteins were treated with EDTA and the chelating agent was removed using a PD10 column. The assays were carried out in 50 mM Na-HEPES buffer, pH 7.5, containing 1 mM of MgCl2 or another divalent ion. In this discontinuous assay aliquots were removed at regular intervals, the enzyme was inactivated by boiling and phosphate release determined.
The specificity of enzymes against phosphorylated and neutral high mannose N-glycans was assessed by capillary electrophoresis. The methodology was essentially that described by Tiels et al.30. The two substrates were MNN4 (phosphorylated high mannose N-glycans released from glycoproteins expressed by a genetically modied strain of Yarrowia lipolytica) and N-glycan from RNAase B (primarily high mannose N-glycans), which were released from their respective glycoproteins with PNGaseF. The N-glycans were labelled at the reducing end with 8-aminopyrene-1,3,6-trisulfonic acid31, and incubated overnight at 30 °C with ~2 µM of enzyme in 10 mM Na-Hepes buffer, pH 7.0, containing 2 mM CaCl2. The reactions were analyzed by capillary electrophoresis with laser-induced fluorescence detection (CE-LIF) using an ABI 3130 capillary DNA sequencer as described previously31
Mannosyl-transferase assays
BT3775 and BT3776 at 30 µM were screened for activity using mannose and all possible α-mannobiose acceptors at a concentration of 10 mM. Reactions were performed in 10 mM Na-Hepes buffer, pH 7.5, 10 mM MnCl2, 50 mM GDP-Mannose at 37 °C over time course intervals of 0 min, 5 min, 15 min, 30 min, 60 min, and 16 h. Reactions were stopped by boiling for 10 min. To explore the synergy between the two GT32 glycosyltransferasess, reactions were performed with BT3775 and BT3776 simultaneously using mannose as an acceptor, and in a step-wise progression with BT3775 and mannose as the acceptor, followed by BT3776 on the purified products of the initial BT3775 reaction. Enzyme concentrations were maintained in both conditions at 30 µM.
MALDI-TOF MS of reaction products
To permethylate N-glycan fragments and mannooligosaccharides appropriate enzyme reactions were freeze-dried and suspended in dry DMSO (200 µl). Oligoglycans were per-O-methylated using standard methods32. Freshly prepared sodium hydroxide base in dry DMSO (300 µl) and then iodomethane (150 µl) was added to each sample. The tube was purged with nitrogen and vortexed vigorously. Permethylated oligosaccharides (PMOs) were extracted in 2 mL water. After removing excess iodomethane (CH3I), 2 mL dichloromethane was added and vortexed to extract lipophilic components. The aqueous layer was removed after centrifugation. This was repeated 5 more times. After final rinse, the dichloromethane layer was transferred into a fresh tube and dried down under N2 stream. The samples were then dehydrated and dissolved in 50% aqueous methanol and loaded onto C18 reverse phase resin (100 mg/1 mL, Resprep™ SPE Cartridges) and eluted with acetonitrile (AcN). AcN washes were dried down under N2 and dissolved in 20 µL methanol. Equal volumes of the sample and 2% DHBA in aqueous methanol, which was used as the matrix, were combined in a separate microfuge tube and loaded on the MALDI-TOF MS plate. MALDI-TOF MS analyses were performed with an AB4700 MS instrument (Applied Biosystems) in positive ion, reflector mode with 100 shots taken per spectrum. PMO mass values were queried online (http://www.expasy.org/tools/glycomod/) by GlycoMod tool that can predict possible oligosaccharide structures that occur on proteins from their experimentally determined masses.
NMR analysis of glycosyltransferase reaction products
The mannooligosaccharide products were separated by size exclusion chromatography on a Superdex-75 HR10/30column using a Dionex Ultimate 3000 HPLC equipped with a ShodexRI-101 refractive index detector. The column was eluted with water and fractions were collected and freeze-dried. The lyophilized fraction containing the trisaccharide was dissolved in D2O (0.3 mL, 99.9%; Cambridge Isotope Laboratories) and one- and two-dimensional NMR spectra were recorded at 298 K with a Varian Inova NMR spectrometer operating at 600 MHz equipped with a 3-mm NMR cold probe. The homonuclear (gCOSY, TOCSY and NOESY) and the hetereonuclear (gHSQC and gHMBC) experiments were recorded using standard Varian pulse programs. Chemical shifts were measured relative to internal acetone (δH 2.225). Data were processed using MestReNova software (Universidad de Santiago de Compostela, Spain). Interglycosidic scalar couplings observed in the gHMBC spectra were used to determine the sequence and glycosidic linkages of the mannosyl residues in the α-Man-(1,3)-[α-Man-(1,6)]-Man trisaccharide product.
Linkage analysis of GT32 glycosyltransferase mannooligosaccharide products
Overnight incubations were boiled for 5 min and then centrifuged to pellet denatured protein. A 200 µg aliquot of the sample was suspended in 200 µl DMSO and magnetically stirred for 5 d. The sample was then permethylated by the method of Anumula and Taylor33. Two hundred µL of the NaOH base were added and, after 10 min, 100 µL CH3I were added and the sample was stirred for 40 min. An additional 200 µL base and 100 µL CH3I were then added and stirring was continued for 40 min. The reaction was worked up by addition of 2 mL H2O, removal of excess CH3I by sparging with N2, and CH2Cl2 extraction. The permethylated material was hydrolyzed using 2 M TFA (2 h in a sealed tube at 121 °C), reduced with NaBD4, and acetylated using Ac2O/TFA. The resulting partially methylated alditol acetates were analyzed on a Hewlett Packard 5890 GC interfaced to a 5970 MSD (mass selective detector, electron impact ionization mode); separation was performed on a 30 m Supelco 2330 bonded phase fused silica capillary column.
Stereochemistry of endo-α1,6-mannanases
A solution of BT3792 (25 mg, approx 400 µmole) in buffered D2O (0.25 mL, 50 mM phosphate-citrate, 200 mM NaCl, pD 6.0) was added to a solution of 4-nitrophenyl α-D-mannopyranosyl-1,6-α-D-mannopyranoside (4.1 mg, 0.0086 mmol) in D2O (0.75 mL, 50 mM phosphate-citrate, 200 mM NaCl, pD 6.0) at 22 °C. The course of the reaction was monitored by 1H NMR (500 MHz) to identify the stereochemistry of the reaction by analyzing the appearance of the anomeric α- and β-proton signals. Signals were assigned by 2-D NMR analysis (HSQC).
Growth and transcriptomic studies, whole cell enzyme assays and metagenomic database searching
Bacteroides culture and whole cell assays
Bt was cultured anaerobically at 37 °C in minimal media containing an appropriate carbon source. or in TYG (tryptone yeast extract glucose medium) as described previously21. Growth curves presented in the paper are averages of six biological replicates. Bt was grown in 5 mL minimal media on 0.5% w/v Saccharomyces cerevisiae mannan (Sigma) or glucose as the sole source to mid exponential phase (OD600nm 0.6-0.8). Cells were harvested by centrifugation, 5000 x g 10min at room temperature and washed in 5 ml Phosphate buffered Saline pH 7.1 (PBS) before being resuspended in 500 µL PBS. Cells (50 µL) were assayed against yeast mannan (10 mg ml-1) at 37 °C for 16 h. Assays were analysed by thin layer chromatography, 5 µL of each sample was spotted onto silica plates and resolved in butanol/acetic acid/water buffer. The plates were dried and sugars visualised by orcinol/sulphuric acid heated to 70°C.
Cellular localization
Cultures of Bt (100 mL) were grown in minimal media on yeast mannan (0.5% w/v) as a sole carbon source, to mid exponential growth phase (OD600nm 0.6-0.8). Cells were harvested by centrifugation and washed in 10 mL PBS before being resuspended in 5 mL of the buffer. The cells were split into four 1 mL aliquots. To 3 of the aliquots 2 mg ml-1 Proteinase K was added and incubated at 37° C for 1-16 h, the fourth sample was left as an untreated control also for 16 h. Following incubation with the protease the samples were centrifuged at 5000 x g for 10 min and the supernatant discarded. The cell pellets were resuspended in 1 ml PBS and the proteins precipitated by the addition of 200 µL trichloroacetic acid and incubation on ice for 30 min. The precipitated proteins were pelleted by centrifugation and washed 4 times in 1 mL ice cold acetone. The protein pellets were resuspended in 250 µL Laemmli buffer and subjected to SDS/PAGE. Gels were transferred to Whatman Protran BA 85 nitrocellulose membrane. Proteins of interest were detected using anti-sera raised against the corresponding protein. The secondary antibody used was a chicken-anti rat conjugated to horseradish peroxidase. Antibodies were detected by chemi-luminescence using Biorad Clarity Western ECL Substrate.
Immunofluorescence microscopy
Bt suspensions (OD600nm = 0.8) in phosphate-buffered saline, pH 7.0 (PBS), were applied to clean Eppendorf tubes, fixed by an equal volume of 2 x formalin (9% formaldehyde in PBS), and rocked for 90 min at 25 °C. The cells were then pelleted by centrifugation for 3 min at 7000 x g and washed twice with 1 ml of PBS. Bacterial cell pellet was resuspended in 1ml of blocking solution (2% goat serum, 0.02% NaN3 in PBS) and incubated at 4 °C for 16 h. After incubation cells were centrifuged again at 7000 x g and the supernatant discarded. For labelling, the bacteria were incubated with 0.5 ml of primary rat IgG (1/500 dilution of IgG in blocking solution) for 2 h at 25 °C. The cells were then pelleted, by centrifugation, washed in 1 ml of PBS and resuspended in 0.4 ml goat anti-rat IgG Alexa-Fluor 488 (Sigma), diluted 1/500 in blocking solution, and incubated 1 h at 25 °C in the dark. The cells were then pelleted, washed with PBS and resuspended in 50 µl of PBS containing ProLong Gold antifade reagent (Life Technologies). Labelled bacterial cells were mounted onto glass slides and secured with coverslips. Fluorescence was visualized using a Leica SP2 UV microscope (Leica Microsystems, Heidelberg, GmbH) with x63 na1.32 lens. Alexa-Fluor 488-labelled bacteria were viewed under a UV microscope view and compared with bright-field phase-contrast of the same image.
Constructing mutants of the yeast mannan and HMNG PULs in B. thetaiotaomicron
The inactivation of the HMNG-PUL ECF regulator was described previously13. The other mutants deployed in this study, PUL knock outs and single gene clean deletions were introduced by allelic exchange using the pExchange vector as described in Koropatkin et al.34 The use of quantitative reverse transcriptase PCR to quantify appropriate transcripts followed the methods described by Martens et al.13.
Gnotobiotic mice experiments
All animal experiments were approved by the University Committee on Use and Care of Animals at the University of Michigan and were supervised by a veterinarian. Germ-free mouse experiments were conducted in a total of 24, 6–8-week-old male and female Swiss Webster mice (each was considered to be a single biological replicate in its respective experiment and treatment group). Mice were randomly assigned into groups by a technician who was not familiar with the project. The investigators were not blinded to the identities of the treatment groups during the experiment and no data were excluded from the final analysis. For in vivo gene expression studies, mice were randomly grouped into three groups containing three animals each, and then subjected to three different dietary regiments. Two groups were fed a gamma-irradiated custom diet (glycan-free diet) that contained only glucose as the available carbohydrate as well as cellulose, a polysaccharide that cannot be degraded by Bt, as a non-digestible fiber supplement35. One of the two groups maintained on this diet was provided with purified α-mannan (1% w/v) in drinking water (Harlan-Teklad). The third group was fed a custom version of the polysaccharide-free diet in which the glucose was replaced with dried/crumbed bread (50% w/w of final diet) that had been produced using yeast as a leavening agent (Zingerman’s Bake House, Ann Arbor, MI). Mice were pre-fed on each dietary condition for five days, colonized with Bt by oral gavage (~108 cfu/animal) and maintained for an additional 5 days before sacrifice and collection of cecal contents for gene expression analysis. For the in vivo competition experiment, wild-type and mannan PUL triple mutant strains were each labeled with a unique 24 bp oligonucleotide tag, which is contained in a pNBU2-based chromosomal integration vector and quantifiable by qPCR, as previously described.13 Each strain was grown overnight in TYG medium and combined at approximately equal amounts prior to being gavaged into mice as described above. For competition experiments, 5 mice were used in each group (chosen based on the sample size used in previous studies to observe significant changes in competitive index18,28) and fed varying regimens of the three diets described above for a total period of 38 days. All germfree mice used in the competition experiment were pre-fed the glycan-free diet for one week prior to colonization.
Bacteroides co-culturing experiments
Bt, B. xylanisolvens NLAE-zl p352 and B. cellulosilyticus WH2 were cultured in minimal media containing glucose (0.5% w/v) as a carbon source to mid exponential growth phase (OD600 0.7-0.8). Cells were harvested by centrifugation and washed twice with 5 ml of PBS to remove any residual glucose. The washed cells were resuspended in 5 ml of fresh minimal media with no carbon source. Minimal media (10 ml) containing mannose or yeast mannan as the carbon source was inoculated with equal volumes of Bt/B. xylanisolvens or Bt/B. cellulosilyticus. A control culture of minimal media containing yeast mannan was also inoculated with either B. xylanisolvens or B. cellulosilyticus. All cultures were set up in triplicate. Samples (1 ml) were taken at the point of inoculation, early exponential, late exponential and stationary phase of growth. Serial dilutions of each sample were plated on to rich media and incubated for 2 days before colony counts were recorded. Proportions of Bt, B.xylanisolvens and B.cellulosilyticus per sample were determined by quantitative PCR from genomic DNA using unique marker genes for each strain.
Searches of human gut metagenomic datasets for mannan PULs
A search of 250 different healthy and diseased (Crohn’s disease and ulcerative colitis) human metagenomic samples was conducted exactly as described previously35. Probes corresponding to the three Bt mannan PULs were first checked against database of complete and draft microbial genome sequences to identify regions that were present in species other than Bt, or the porcine B. xylanisolvens strains in the case of PUL-Man1. In the case of PUL-Man2 and PUL-Man3, the entire sequence was determined to be specific for sequenced Bt isolates; whereas, PUL-Man1 was trimmed to a region containing 15.059 kb that were unique to Bt and porcine B. xylanisolvens. The three probes used correspond to the following basepair coordinates in the Bt VPI-5482 genome sequences: PUL-Man1 (3262908‥3277966), PUL-Man2 (4893415‥4928241) and PUL-Man3 (5012915‥5031551).
Crystallization, Data Collection, Structure Solution and Refinement
3.1. Crystallization
BT3783 and BT3792 were crystallized using the sitting drop vapor diffusion method at 18 °C. BT3783 crystals were obtained by mixing equal volumes of purified, recombinant BT3783 protein at a concentration of 11.25 mg mL-1 with mother liquor solution consisting of 15% (w/v) polytheylene glycol 4,000, 5% (±)-2-methyl-2,4-pentanediol (v/v), 3 mM D-mannose, and 200 mM MgCl2. Crystals of BT3792 were obtained by mixing equal volumes of purified recombinant BT3792 at a concentration of 20 mg/ml buffered in in 25 mM Tris-HCl (pH 8.0), 500 mM NaCl, 2 mM DTT with a reservoir solution consisting of 5% glycerol (v/v), 24% (w/v) polyethylene glycol 2,000 monomethyl ether, 0.25 M sodium acetate, and Bis-Tris-HCl (pH 5.5). Large, thin plate crystals of BT3792 developed over a period of 5 days to a week. BT3792 crystals were cryoprotected in crystallization solutions supplemented with 25% ethylene glycol and cryo-cooled directly in a N2 stream at -160 °C prior to diffraction experiments.
BxGH99 crystals were grown at 19 °C using hanging-drop vapour diffusion with equal volumes of protein (30 mg ml-1) and reservoir solution consisting of 0.1 M sodium acetate pH 5.1, 20% w/v PEG 2000 MME (mono-methyl ether), 2.0% PGA-LM (poly-γ-glutamic acid low molecular weight). Ligand complex formation as a ternary with Man-IFG and α-1,2-mannobiose, was achieved by soaking native BxGH99 crystals in mother liquor supplemented with approximately 10 mM of respective ligand solutions for a period of 30 minutes prior to flash cooling in liquid N2. Crystals were cryo-protected by the stepwise addition of ethylene glycol, supplemented with appropriate ligand(s), to a final concentration of 20% v/v.
3.2. Data Collection, Structure Solution and Refinement
Diffraction data from both BT3783 and BT3792 crystals were collected at the Canadian Lightsource beamline 08B1-1 (CMCF-BM) in oscillation mode (λ = 0.97961 and 0.98005 Å, with data collected at 100 K respectively). The BT3783 and BT3792 datasets were processed with iMosflm36,37 and XDS38, respectively, and both were scaled with SCALA37. BT3783 and BT3792 structures were solved by molecular replacement with the program Phaser MR 39 using the coordinates of apo BT3783 (PDBID: 3MPR) and the coordinates of Lin0763 from Listeria innocua (PDBID: 3K7X). The asymmetric unit of BT3783 and BT3792 contain four and two protein molecules, respectively. The structures were subsequently improved with cycles of manual building with COOT40 and refinement with REFMAC37. Five percent of the reflections were flagged as “free” to monitor the refinement process. The structure of BT3783 extends from residues 26-309 with a magnesium ion coordinated in the putative active centre. The structure of BT3792 runs continuously from residue 151-525. Due to a lack of continuous density corresponding to this polypeptide region, residues 274-290 are absent in the model of BT3783. BT3792 structural refinement required amplitude correction for twinning. The final refined structures were validated with the aid of Molprobity41. Final BT3783 and BT3792 structures featured, respectively, 94.8 and 99.6% of all modeled residues within the Ramachandran “favored” region, with a further 4.2 and 0.4% within the “additional allowed” region.
Diffraction data for the BxGH99-Man-IFG-mannobiose ternary complex were collected at beamline I03 (λ = 0.97625 Å, data collected at 100 K) of the Diamond Light Source, Didcot, UK. The datasets were processed using XDS38 and AIMLESS 42 (also within CCP437). Phases were derived from a previously solved (native) BxGH99 atomic model, with initial refinement conducted using REFMAC37. Calculated electron density maps were visually assessed for evidence of ligand-binding, with subsequent completed atomic models, featuring appropriately assigned ligand coordinates, refined to convergence through numerous cycles of REFMAC37 and additional manual correction using COOT40. The final BxGH99 ternary structure featured, respectively, 96.5 and 96.9% of all modeled residues within the Ramachandran “favored” region, with a further 2.3 and 1.9% within the “additional allowed” region. Data collection and refinement statistics for all structures are presented below in Supplementary Table 6.
Accession Codes
Coordinates and structure factors for BT3783-Mg binary complex, BT3792 and the BxGH99/Man-IFG/mannobiose ternary complex have been deposited in the protein data bank with the accession codes 4C1R, 4C1S and 4UTF respectively.
Experimental group size and statistical analysis of data
For all quantitative enzyme assays at least three technical replicates were performed unless specifically stated in the Table legends. Standard errors of the mean are stated for kinetic parameters in Supplementary Tables 2, 3 and 4. For Table 5 the kinetic parameters are reported ± the error of the fit of the data using linear regression. For isothermal titration calorimetry experiments three technical replicates were performed for each titration. Standard errors of the mean are shown in Supplementary Table 5. In the Gnotobiotic mice experiments displayed in Figure 2A five mice were assigned to each diet and the error bars for the two bacterial strains respresent standard errors of the mean. Statistical significance of the persistence of different strains of Bt in the same mice was analysed by unpaired student’s t test. For the microbial sharing experiment detailed in Figure 4 the error bars represent standard deviations of the mean from three biological replicates.
Extended Data
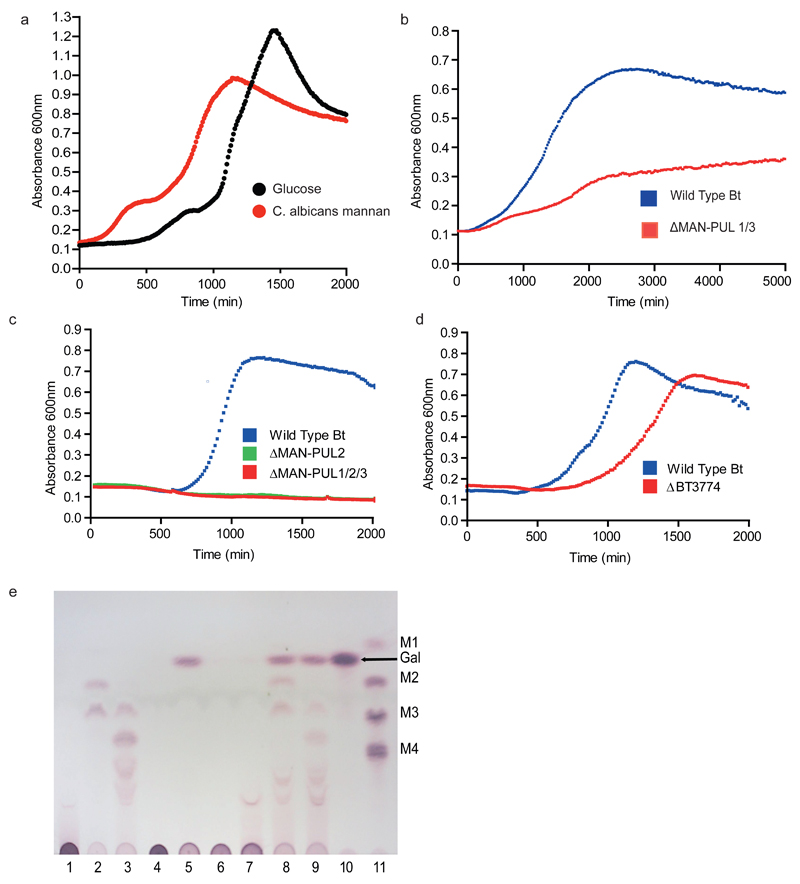
Extended Data Fig. 1. The role of specific Bt PULs and enzymes in utilization of mannan from S. cerevisiae and other yeast species.
a, growth of wild type Bt on Candida albicans mannan and glucose. b, growth of wild type Bt and the mutant lacking PUL-Man1 and PUL-Man3 (ΔPUL-Man1/3) on Schizosaccharomyces pombe α-mannan. c, growth of wild type Bt, and the Bt mutants lacking Pul-Man2 (ΔPUL-Man2), or all three mannan PULs (ΔPUL-Man1/2/3) on S.cerevisiae α-mannan. d, displays the growth profile of wild-type Bt and the Bt mutant lacking bt3774 (Δbt3774) on S. cerevisiae mannan. In panels a, b, c and d, each point on the growth curve represents the mean of three biological replicates. e, enzymes at 1 µM at 37 °C were incubated with either undecorated α-1,6-mannan (derived from mnn2 mutant of S. cerevisiae), lanes 1-3, or mannan from S. pombe, lanes 4-9. Lanes 1 and 4, the mannans incubated in the absence of the enzymes; lanes 2 and 6, mannans incubated with the periplasmic mannanase BT3782, and in lanes 3 and 7 the surface mannanase BT3792; lane 5, S. pombe mannan incubated with the GH97 α-galactosidase BT2620; lanes 8 and 9, S. pombe mannan incubated with BT2620/BT3782 and BT2620/BT3792, respectively. Lane 10 galactose standard; lane 11 α-1,6-mannooligosaccharides: mannose (M1), mannobiose (M2), mannotriose (M3) and mannotetraose (M4).
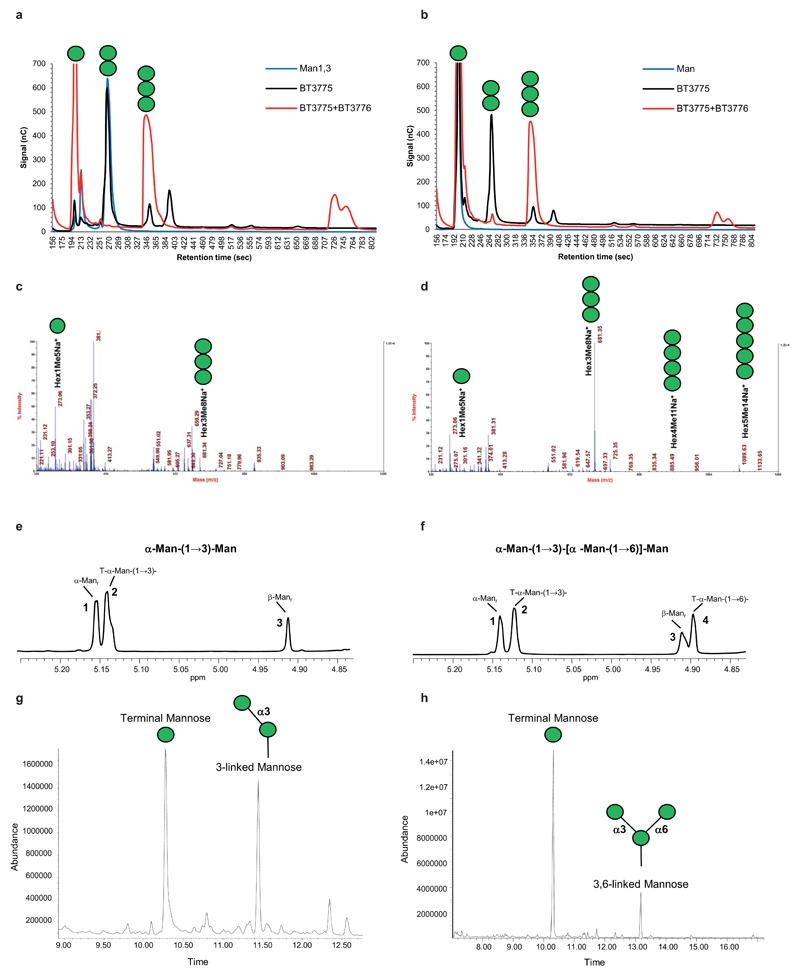
Extended Data Fig. 2. Product profiling of GT32 glycosyltransferases encoded by PUL-Man2.
a, HPAEC of biosynthetic reactions using mannose as an acceptor and GDP-α-Man as the donor. Mannobiose is formed in the presence of BT3775 (black) and mannotriose with BT3775 and BT3776 (red). The blue trace is a mannose standard. b, HPAEC of biosynthetic reactions with α1,3-mannobiose as the acceptor and GDP-α-Man as the donor. BT3775 is not capable of extending mannobiose (black). In the presence of BT3775 and BT3776 mannotriose is produced (red). The blue trace is an α1,3-mannobiose standard. MALDI-TOF analysis of the reaction products of BT3775 + BT3776 using c, mannose and d, α1,3-mannobiose as an acceptor. e, NMR analysis of the α1,3-mannobiose substrate. Peaks (1) and (3) correspond to the α-anomer and β-anomer of the mannose at the reducing end, respectively; peak (2) corresponds to the terminal α-mannosyl residue linked to O-3 of the mannose at the reducing end. f, NMR analysis of the α1,3,(α1,6)-mannotriose BT3776 product. The numbering of the peaks are the same as in e. Peak 4 corresponds to the terminal α-mannosyl residue linked to 0-6 of the 3,6-linked mannose at the reducing end. g, alditol-acetate linkage analysis of mannobiose produced by BT3775 from mannose. h, alditol-acetate linkage analysis of branched (α1,3),(α1,6)-mannotriose produced by BT3776 from α1,3-mannobiose. The green circles indicate the mannose residues present in carbohydrates identified by HPAEC, MALDI-TOF and NMR.
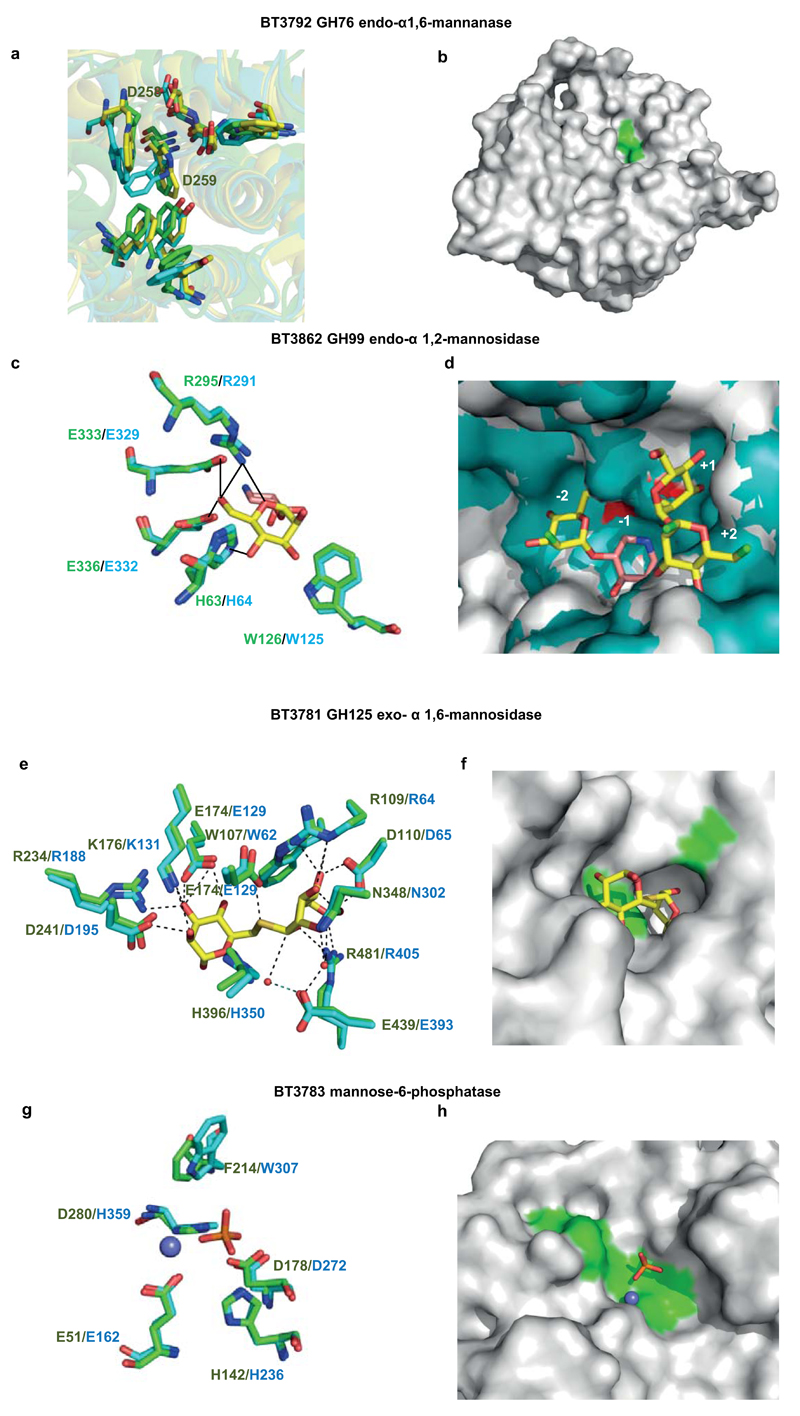
Extended Data Fig. 3. The structures of enzymes that play a key role in yeast mannan degradation.
a, overlay of the hydrophobic conserved residues in the predicted substrate-binding cleft of BT3792 (yellow), BT2949 (cyan) and the Listeria protein Lin0763 (green; PDB code 3K7X), and the predicted catalytic aspartates. b, solvent representation of BT3792 in which the predicted catalytic residues, Asp258 and Asp259, are coloured green. c, overlay of BT3862 (cyan) with a homolog of the enzyme from B. xylanisolvens, BxGH99 (green; PDB code 4UTF) in complex with Man-α1,3-isofagomine and α-1,2-mannobiose (Man residues coloured yellow and isofagomine pink). d, solvent exposed surface of the substrate binding cleft of the BxGH99 (teal) ligand complex overlaid with BT3862 (grey). The subsites are numbered with the catalytic residues, Glu333 and Glu336, coloured red and the solvent exposed O2 of Man bound at the -2 subsite and O1 and O6 of the Man located at the +2 subsite are coloured bright green. e, overlay of BT3781 (green; PDB code 2P0V) with the substrate and catalytic residues of the Clostridium perfringens GH125 α-mannosidase CpGH125 (cyan; PDB code 3QT9), in which the ligand 6-S-α-D-mannopyranosyl-6-thio-a-D-mannopyranose (Man-S-Man) is shown in yellow. f, solvent exposed surface of BT3781 in the vicinity of the active site in which the catalytic residues (Glu174 and Glu439) are depicted in green. The position of Man-S-Man is based on the overlay shown in e. g, overlay of BT3783 with the catalytic and substrate binding residues of a tyrosyl-DNA phosphodiesterase (PDB code 4GYZ) in complex with Mg2+ (slate blue sphere) and phosphate (coloured orange). h, a region of the solvent accessible surface of BT3783 in which the catalytic residues are coloured green. The figure was prepared using PyMOL. A detailed description of the structures of these proteins is provided in Supplementary Information Section 5.
Extended Data Fig. 4. The degradation of yeast mannan by Bt in culture and the selected enzymes expressed by the bacterium, and the stereochemistry of the reaction catalyzed by GH76 endo-α1,6-mannanases.
a, GH92 α-mannosidases at high concentrations (50 µM) were incubated with yeast mannan for 5 h in the absence (labelled GH92) or in the presence (GH92/GH76) of the endo-α1,6-mannanase BT3782. The GH92 α-mannosidases in this example were BT2199 (1), BT2130 (2) and BT3773 (3). The GH76 endo-α1,6-mannanase only releases mannooligosaccharides in the presence of BT2199; see also Supplementary Information Section 4.1. b, Bt was grown on yeast mannan or glucose. Yeast mannan was incubated with no bacterium (1), Bt previously cultured on yeast mannan (2) and Bt grown on glucose. The cells were incubated for 5 h at 37 °C with the polysaccharide without a nitrogen source and thus were not growing. The products released by the Bt cells, analysed by TLC, were mediated by the activity of enzymes presented on the surface of Bt, and not through the action of periplasmic mannanases and mannosidases. The black box highlights very low levels of high molecular weight mannooligosaccharides generated by the cells incubated in yeast mannan. c, Bt was cultured for up to 48 h (stationary phase) on yeast mannan. The supernatant of the culture at the time points indicated were analyzed by TLC. In all panels the samples were chromatographed with the following α1,6-mannooligosaccharides: mannose (M1); mannobiose, M2; mannotriose, M3; mannotetraose, M4. d, the absorbance of the culture used in C. e, BT3792 (GH76) endo-α-1,6-mannosidase is a retaining glycoside hydrolase. Enzymatic hydrolysis of 4-nitrophenyl α-D-mannopyranosyl-1,6-α-D-mannopyranoside (S) was monitored by 1H-NMR spectroscopy (500 MHz). The stacked spectra show the reaction progress over time. SH1α is the anomeric proton of the reducing end mannopyranoside of the substrate, and SH1’α is the anomeric proton of the non-reducing end mannopyranoside. The reaction proceeds with the initial formation of the product, the α-anomer of α-1,6-mannobiose (P-α, peaks PH1α and PH1’α), which slowly mutarotates to the β-anomer (P-β, peaks PH1β and PH1’β). f, TLC analysis of S. cerevisiae mannan incubated without enzyme (lane 1), BT3774 (lane 2), BT3792 (lane 3, BT3774 and BT3792 (lane 4). M1-M4 are α-mannnooligosaccharide standards numbered according to their d.p. f, GH76 mannanase BT3792 does not attack the backbone of S. cerevisiae mannan unless the side chains are first removed by the GH38 α-mannosidase BT3774, confirming that this enzyme cleaves the mannose linked α-1,2 to the mannan backbone. The data in a, b and c are representative of two biological replicates, while the data in f are representative of two technical replicates.
Extended Data Fig. 5. The activity of periplasmic α-mannosidases and the growth of different species of Bacteroides against yeast mannan.
Structures of the mannans derived from wild type and mutants of S. cerevisiae. The tables adjacent to the different yeast structures depict the initial rate of mannan hydrolysis by the four enzymes. The growth curves adjacent to the different mannan structures show the growth profile of Bt (black), B. ovatus (red) and B. xylanisolvens (blue) on the glycans (each point represents the mean growth of 3 separate cultures ± s.d.). The porcine-derived B. xylanisolvens strain shown here acquired PUL-Man1 by lateral gene transfer, Extended Data Fig. 9, explaining its capacity to degrade processed mannans. Vertical error bars represent standard deviation of three separate replicates in each condition.
Extended Data Fig. 6. The activity of GH76 α-mannanases and GH125 α-mannosidases.
a, b, BT3792 and BT3782, respectively, were incubated with α1,6-mannotetraose at a concentration ≪KM. Substrate depletion was measured using HPAEC and the rate (right hand of a and b) enabled kcat/KM to be determined. c, BT3792 and BT3782 were incubated with unbranched yeast mannan (derived from the S. cerevisiae mutant MNN2). The yeast mannan at 1% was incubated with the two GH76 α1,6-mannanases for 1 h at 37 °C in 50 mM sodium phosphate buffer, pH 7.0. The limit products were analyzed by TLC. d, e, BT2632 and BT3781 at 100 nM were incubated with 1 mg/ml of the debranched mannan for 1 h in the buffer described above. d displays TLC analysis of the reactions, while e shows HPAEC traces. α1,6-Mannooligosaccharides identified by their degree of polymerization (M1, mannose; M2, mannobiose; M3, mannotriose; M4, mannotetraose) and IP is the injection peak. The data in c and d are representative of two technical replicates.
Extended Data Fig. 7. HMNG deconstruction by Bt.
a, Structure of the HMNG PUL. Genes drawn to scale with its orientation indicated. Genes encoding known or predicted functionalities are color-coded and, where appropriate, are also annotated according to their CAZy glycoside hydrolase family (GH) number. SGBP represents a Surface Glycan Binding Protein. b, BT3994 was incubated with α1,6-mannotetraose (Man4-AB) or the high mannose N-glycan Man5GlcNAc2, with both oligosaccharides labelled with 2-aminobenzamide (AB). At the indicated time points aliquots were removed and analysed by HPAEC using a fluorescence detection system. While Man5GlcNac2-AB was hydrolyzed by BT3994, the enzyme was not active against Man4-AB. c, chicken ovalbumin was incubated with buffer (1) or 1 µM of BT3987 (2) in 20 mM Na-HEPES buffer, pH 7.5, for 5 h at 37 °C, and the soluble material was permethylated and analyzed by MALDI-TOF mass spectrometry. The high mannose N-glycans released are labelled. d, depicts a western blot of Bt cells cultured on yeast mannan that were untreated with proteinase K (0 h) or incubated with 2 mg/ml proteinase K for 16 h (16 h). The lane labelled RP contained purified recombinant form of BT3990. The blots were probed with antibodies against BT3990. The data in d are representative of two biological replicates. e, representative isothermal calorimetry titrations (ITCs) for BT3984 titrated with Gal-β1,4-GlcNAc (LacNAc; (25 mM), and f, for BT3986 titrated with mannose (50 mM). The top half of each panel shows the raw ITC heats; the bottom half, the integrated peak areas fitted using a one single binding model by MicroCal Origin software. ITC was carried out in 50 mM Na/HEPES, pH 7.5 at 25 °C. The affinities and thermodynamic parameters of binding are showing in Supplementary Table 5. g, shows the growth profile of wild type Bt (WT Bt; black) and the mutant Δbt3993 (red), which lacks the ECF-σ regulator gene of PUL-HMNG, cultured on Man8GlcNAc2(each curve shows the mean ± s.d. of 3 separate cultures).
Extended Data Fig. 8. Metagenomic analysis of the occurrence of the yeast mannan PULs in humans.
Abundance of Bacteroides mannan PULs in human from a survey of metagenomic sequencing data from a total of 250 adult human samples (211 healthy, 27 ulcerative colitis, 12 Crohn’s Disease; see Methods for references). Datasets were individually queried by BLAST using either each entire mannan PUL (PULs 2,3) or a sub-fragment that was trimmed to eliminate cross-detection of other species genomes beyond Bt and porcine B. xylanisolvens (PUL1; see Methods for additional search details). Each horizontal line represents the presence of a hit in a single individual. The leftmost column summarizes the total mannan PUL content in each person (annotated according to the color key in the upper right corner). The mannan PUL frequency across all 250 samples is shown at the bottom for each condition and is compared to the frequency of several other PULs implicated in xyloglucan and porphyran utilization. Graph at far right illustrates the variation in sequencing depth for each sample/study: black lines show the average depth in megabasepairs (Mbp) for each study; the light gray line shows the depth for each individual sample.
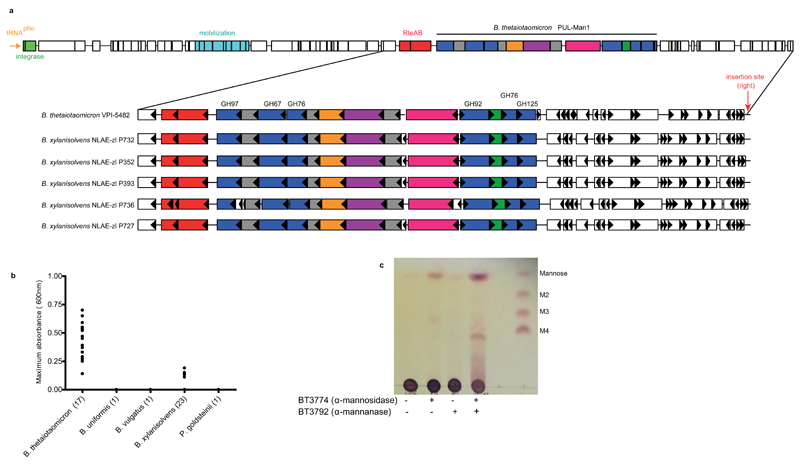
Extended Data Fig. 9. Presence of a conjugative transposon (cTn) that harbors PUL-Man1 in the genomes of porcine B. xylanisolvens strains and the mannan presented to these organisms.
a, shown across the top is a schematic of a cTn that has been integrated into the 3' end of a tRNAphe gene in Bt strain VPI-548243. Integration is mediated by a 22 bp direct repeat sequence that is contained in tRNAphe and repeated again at the other side of the cTn (insertion site right). The location of Bt PUL-Man1 is denoted within the larger cTn element using a colour scheme identical to Fig. 1a. The lower panel shows an expanded view of the PUL-Man1 locus in five sequenced strains of B. xylanisolvens from the feces of pigs fed a diet enriched with distillers grains that were fermented with yeast. A nearly identical copy (both by amino acid homology and syntenic organization) of this genomic region is present in Bt and the porcine B. xylanisolvens strains. Although the draft genomes of the B. xylanisolvens strains contains gaps in all 5 assemblies at the left side of the PUL-Man1, the right side insertion site was resolved in all genomes, suggesting that the B. xylanisolvens loci were also transferred by lateral transfer at some point in the history of these strains. b, 43 different strains from five Bacteroidetes isolated from animal guts (each indicated with a solid circle) were inoculated into minimal media containing S. cerevisiae mannan as the sole carbon source. The growth of the cultures was measured over 48 h by recording the optical density at 600 nm. c, TLC analysis of the products generated by incubating BT3774 and BT3792 with α-mannan extracted from the distillers grain fed to the pigs from which the B. xylanisolvens were isolated. The data are representative of two technical replicates.
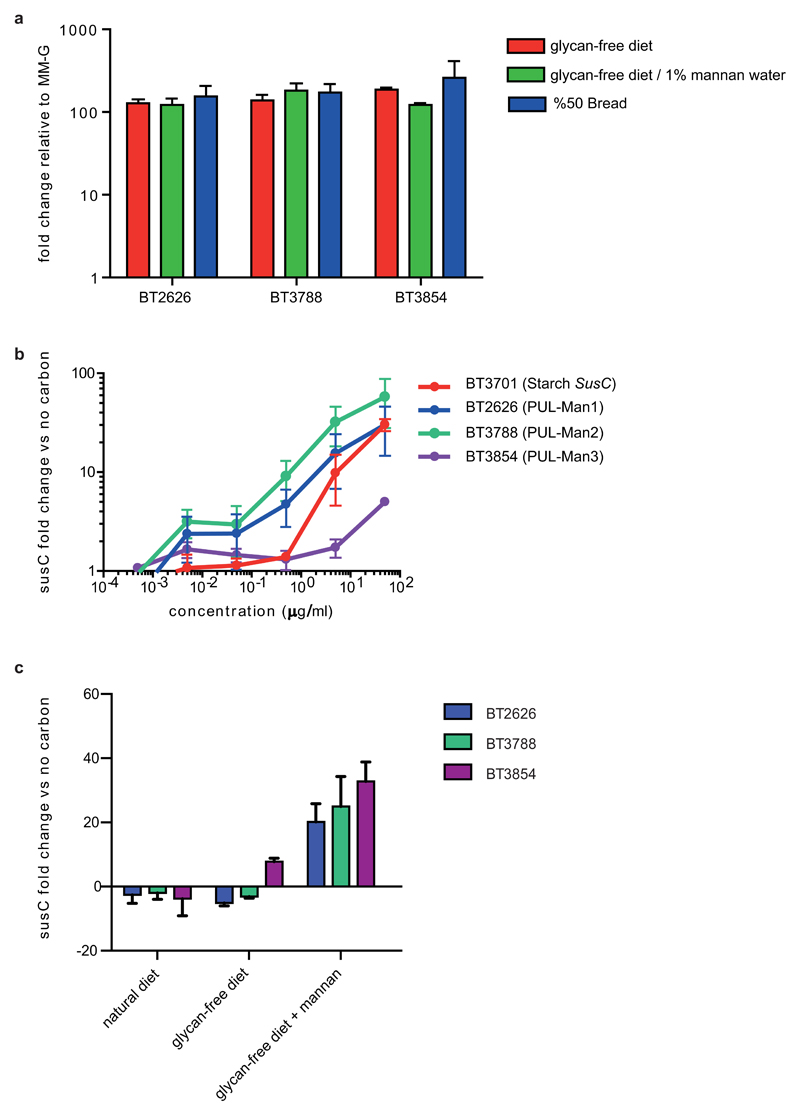
Extended Data Fig. 10. In vivo and in vitro expression of the mannan PULs.
a, level of susC-like transcripts derived from PUL-Man1 (BT2626), PUL-Man2 (BT3788) and PUL-Man3 (BT3854) from Bt in monocolonized gnotobiotic mice fed a “glycan-free” diet deficient in Bt-digestible glycans (red), the same diet with added yeast mannan (1% w/v in drinking water) as the only usable polysaccharide (green), and a diet containing 50% bread (blue). The levels of the susC transcripts were quantified relative to the same mRNA species in Bt cultured in vitro on glucose minimal medium (MM-G). Note that in all cases, expression of PUL-Man genes is equally high in vivo. b, transcription of the same mannan susC-like genes in response to increasing concentrations of yeast mannan in the media after 30 min exposure. The prototypic susC (BT3701) involved in starch metabolism is shown for comparison. c, an identical exposure experiment to that shown in Panel B, except that glucose-grown Bt cells were exposed to aqueous extracts of the cereal grain diet (natural diet) fed to mice prior to the experiment, or the digestible glycan free control diet (glycan-free diet) used as a base for all feeding treatments. Exposure was conducted for 30 min to determine if any diet extract contained contaminating levels of mannan that could be detected by Bt cells; inclusion of purified mannan (5 mg/ml) in addition to the glycan-free diet serve as positive controls. In all panels, the results represent the mean of 3 biological replicates and error bars represent s.d.
Supplementary Material
Acknowledgements
This work was supported by grants from the European Research Council (GJD, Glycopoise; HJG, No. 322820), The Welcome Trust (HJG, WT097907AIA), BBSRC (MJT, GJD; BB/G016127/1), U.S. Department of Energy (DOE) Bioenergy Research Center (BESC) supported by the Office of Biological and Environmental Research in the DOE Office of Science (MJP), NIH (ECM and TJT, GM090080), Gnotobiotic mouse experiments were supported by a subsidy from the University of Michigan Medical School Host Microbiome Initiative, Agriculture and Agri-Food Canada, AgriFlex (DWA, #2510), Canadian Institute of Health Research operating grant (ABB, MOP-68913), Australian Research Council; Mizutani Foundation (SJW). We would also like to thank various members of ICaMB for providing the yeast strains used in this work.
Footnotes
Author Contributions: FC, ECL and MJT contributed equally to this work. Enzyme characterization; FC, MJT, JMM, DWA. Capillary electrophoresis; DB, KP, WV. ECL created gene deletion strains and determined phenotypes with FC. ECL, FC and AR performed enzyme localisation. FC and ECL carried out the co-culturing experiments. Gene expression analysis; EAC, NAP, ECM. Growth analysis on purified mannans and HMNG; ECL, NAP, KU, ECM. Bt gene deletions; ECL. Phylogenetic reconstruction and metagenomic analysis; ECM. Gnotobiotic mouse experiments; EAC, NAP, NTP, ECM. Purification of HMNG; TJT, BSH and RC. Isolation and genomic analysis of pig gut strains; TA, CJZ. AC, ZH and GS performed NMR experiments on GH76 and MJP on GT products. ZH and GS synthesized substrates. Crystallographic studies by AT, GJD, MDS, ABB and RM. Experiments designed by FC, ECL, GJD, SJW, DWA, ECM and HJG. The manuscript was written primarily by HJG and ECM with contributions from SJW, GJD and DWA. ECL and ECM prepared the figures.
The authors have no competing interests.
Author Information: The PDB accession codes for the protein crystal structures reported in this study are as follows: BT3783-Mg binary complex, BT3792 and the BxGH99/Man-IFG/mannobiose ternary complex have been deposited in the protein data bank with the accession codes 4C1R, 4C1S and 4UTF respectively.
References
- 1.Arumugam M, et al. Enterotypes of the human gut microbiome. Nature. 2011;473:174–180. doi: 10.1038/nature09944. [DOI] [PMC free article] [PubMed] [Google Scholar]
- 2.Backhed F, Ley RE, Sonnenburg JL, Peterson DA, Gordon JI. Host-bacterial mutualism in the human intestine. Science. 2005;307:1915–1920. doi: 10.1126/science.1104816. [DOI] [PubMed] [Google Scholar]
- 3.Arpaia N, et al. Metabolites produced by commensal bacteria promote peripheral regulatory T-cell generation. Nature. 2013;504:451–455. doi: 10.1038/nature12726. [DOI] [PMC free article] [PubMed] [Google Scholar]
- 4.Flint HJ, Bayer EA, Rincon MT, Lamed R, White BA. Polysaccharide utilization by gut bacteria: potential for new insights from genomic analysis. Nat Rev Microbiol. 2008;6:121–131. doi: 10.1038/nrmicro1817. [DOI] [PubMed] [Google Scholar]
- 5.Kau AL, Ahern PP, Griffin NW, Goodman AL, Gordon JI. Human nutrition, the gut microbiome and the immune system. Nature. 2011;474:327–336. doi: 10.1038/nature10213. [DOI] [PMC free article] [PubMed] [Google Scholar]
- 6.Round JL, Mazmanian SK. The gut microbiota shapes intestinal immune responses during health and disease. Nat Rev Immunol. 2009;9:313–323. doi: 10.1038/nri2515. [DOI] [PMC free article] [PubMed] [Google Scholar]
- 7.Martens EC, Koropatkin NM, Smith TJ, Gordon JI. Complex glycan catabolism by the human gut microbiota: The bacteroidetes Sus-like paradigm. J Biol Chem. 2009;284:24673–24677. doi: 10.1074/jbc.R109.022848. [DOI] [PMC free article] [PubMed] [Google Scholar]
- 8.El Kaoutari A, Armougom F, Gordon JI, Raoult D, Henrissat B. The abundance and variety of carbohydrate-active enzymes in the human gut microbiota. Nat Rev Microbiol. 2013;11:497–504. doi: 10.1038/nrmicro3050. [DOI] [PubMed] [Google Scholar]
- 9.Lombard V, Golaconda Ramulu H, Drula E, Coutinho PM, Henrissat B. The carbohydrate-active enzymes database (CAZy) in 2013. Nucleic Acids Res. 2014;42:D490–495. doi: 10.1093/nar/gkt1178. [DOI] [PMC free article] [PubMed] [Google Scholar]
- 10.Konrad A, et al. Immune sensitization to yeast antigens in ASCA-positive patients with Crohn’s disease. Inflamm Bowel Dis. 2004;10:97–105. doi: 10.1097/00054725-200403000-00006. [DOI] [PubMed] [Google Scholar]
- 11.Mpofu CM, et al. Microbial mannan inhibits bacterial killing by macrophages: a possible pathogenic mechanism for Crohn’s disease. Gastroenterology. 2007;133:1487–1498. doi: 10.1053/j.gastro.2007.08.004. [DOI] [PubMed] [Google Scholar]
- 12.Xu J, et al. A genomic view of the human-Bacteroides thetaiotaomicron symbiosis. Science. 2003;299:2074–2076. doi: 10.1126/science.1080029. [DOI] [PubMed] [Google Scholar]
- 13.Martens EC, Chiang HC, Gordon JI. Mucosal glycan foraging enhances fitness and transmission of a saccharolytic human gut bacterial symbiont. Cell Host Microbe. 2008;4:447–457. doi: 10.1016/j.chom.2008.09.007. [DOI] [PMC free article] [PubMed] [Google Scholar]
- 14.Ballou CE, Ballou L, Ball G. Schizosaccharomyces pombe glycosylation mutant with altered cell surface properties. Proc Natl Acad Sci U S A. 1994;91:9327–9331. doi: 10.1073/pnas.91.20.9327. [DOI] [PMC free article] [PubMed] [Google Scholar]
- 15.Raschke WC, Kern KA, Antalis C, Ballou CE. Genetic control of yeast mannan structure. Isolation and characterization of mannan mutants. J Biol Chem. 1973;248:4660–4666. [PubMed] [Google Scholar]
- 16.Gregg KJ, et al. Analysis of a new family of widely distributed metal-independent alpha-mannosidases provides unique insight into the processing of N-linked glycans. J Biol Chem. 2011;286:15586–15596. doi: 10.1074/jbc.M111.223172. [DOI] [PMC free article] [PubMed] [Google Scholar]
- 17.Zhu Y, et al. Mechanistic insights into a Ca2+-dependent family of alpha-mannosidases in a human gut symbiont. Nat Chem Biol. 2010;6:125–132. doi: 10.1038/nchembio.278. [DOI] [PMC free article] [PubMed] [Google Scholar]
- 18.Rakoff-Nahoum S, Coyne MJ, Comstock LE. An Ecological Network of Polysaccharide Utilization among Human Intestinal Symbionts. Curr Biol. 2014;24:40–49. doi: 10.1016/j.cub.2013.10.077. [DOI] [PMC free article] [PubMed] [Google Scholar]
- 19.Ze X, Duncan SH, Louis P, Flint HJ. Ruminococcus bromii is a keystone species for the degradation of resistant starch in the human colon. ISME J. 2012;6:1535–1543. doi: 10.1038/ismej.2012.4. [DOI] [PMC free article] [PubMed] [Google Scholar]
- 20.Hehemann JH, et al. Transfer of carbohydrate-active enzymes from marine bacteria to Japanese gut microbiota. Nature. 2010;464:908–912. doi: 10.1038/nature08937. [DOI] [PubMed] [Google Scholar]
- 21.Larsbrink J, et al. A discrete genetic locus confers xyloglucan metabolism in select human gut Bacteroidetes. Nature. 2014;506:498–502. doi: 10.1038/nature12907. [DOI] [PMC free article] [PubMed] [Google Scholar]
- 22.Martens EC, Kelly AG, Tauzin AS, Brumer H. The Devil Lies in the Details: How Variations in Polysaccharide Fine-Structure Impact the Physiology and Evolution of Gut Microbes. J Mol Biol. 2014 doi: 10.1016/j.jmb.2014.06.022. [DOI] [PMC free article] [PubMed] [Google Scholar]
- 23.Martens EC, et al. Recognition and degradation of plant cell wall polysaccharides by two human gut symbionts. PLoS Biol. 2011;9:e1001221. doi: 10.1371/journal.pbio.1001221. [DOI] [PMC free article] [PubMed] [Google Scholar]
- 24.Charnock SJ, et al. Key residues in subsite F play a critical role in the activity of Pseudomonas fluorescens subspecies cellulosa xylanase A against xylooligosaccharides but not against highly polymeric substrates such as xylan. J Biol Chem. 1997;272:2942–2951. doi: 10.1074/jbc.272.5.2942. [DOI] [PubMed] [Google Scholar]
- 25.Studier FW. Protein production by auto-induction in high density shaking cultures. Protein Expr Purif. 2005;41:207–234. doi: 10.1016/j.pep.2005.01.016. [DOI] [PubMed] [Google Scholar]
- 26.Szabo L, et al. Structure of a family 15 carbohydrate-binding module in complex with xylopentaose. Evidence that xylan binds in an approximate 3-fold helical conformation. J Biol Chem. 2001;276:49061–49065. doi: 10.1074/jbc.M109558200. [DOI] [PubMed] [Google Scholar]
- 27.Miller GL. Use of Dinitrosalicylic Acid Reagent for Determination of Reducing Sugar. Anal Chem. 1953;31:426–428. [Google Scholar]
- 28.Charnock SJ, et al. The topology of the substrate binding clefts of glycosyl hydrolase family 10 xylanases are not conserved. J Biol Chem. 1998;273:32187–32199. doi: 10.1074/jbc.273.48.32187. [DOI] [PubMed] [Google Scholar]
- 29.Thompson AJ, et al. Structural and mechanistic insight into N-glycan processing by endo-alpha-mannosidase. Proc Natl Acad Sci U S A. 2012;109:781–786. doi: 10.1073/pnas.1111482109. [DOI] [PMC free article] [PubMed] [Google Scholar]
- 30.Stewart TS, Mendershausen PB, Ballou CE. Preparation of a mannopentaose, mannohexaose, and mannoheptaose from Saccharomyces cerevisiae mannan. Biochemistry. 1968;7:1843–1854. doi: 10.1021/bi00845a032. [DOI] [PubMed] [Google Scholar]
- 31.Laroy W, Contreras R, Callewaert N. Glycome mapping on DNA sequencing equipment. Nat Protoc. 2006;1:397–405. doi: 10.1038/nprot.2006.60. [DOI] [PubMed] [Google Scholar]
- 32.Ciucanu I. Per-O-methylation reaction for structural analysis of carbohydrates by mass spectrometry. Anal Chim Acta. 2006;576:147–155. doi: 10.1016/j.aca.2006.06.009. [DOI] [PubMed] [Google Scholar]
- 33.Anumula KR, Taylor PB. A comprehensive procedure for preparation of partially methylated alditol acetates from glycoprotein carbohydrates. Anal Biochem. 1992;203:101–108. doi: 10.1016/0003-2697(92)90048-c. [DOI] [PubMed] [Google Scholar]
- 34.Koropatkin NM, Martens EC, Gordon JI, Smith TJ. Starch catabolism by a prominent human gut symbiont is directed by the recognition of amylose helices. Structure. 2008;16:1105–1115. doi: 10.1016/j.str.2008.03.017. [DOI] [PMC free article] [PubMed] [Google Scholar]
- 35.Larsbrink J, et al. A discrete genetic locus confers xyloglucan metabolism in select human gut Bacteroidetes. Nature. 2014 doi: 10.1038/nature12907. [DOI] [PMC free article] [PubMed] [Google Scholar]
- 36.Leslie AW, Powell H. In: Evolving Methods for Macromolecular Crystallography Vol. 245 NATO Science Series. Read JR, Sussman JL, editors. Ch. 4. Springer; 2007. pp. 41–51. [Google Scholar]
- 37.Winn MD, et al. Overview of the CCP4 suite and current developments. Acta Crystallogr D. 2011;67:235–242. doi: 10.1107/S0907444910045749. [DOI] [PMC free article] [PubMed] [Google Scholar]
- 38.Kabsch W. Xds. Acta Crystallogr D. 2010;66:125–132. doi: 10.1107/S0907444909047337. [DOI] [PMC free article] [PubMed] [Google Scholar]
- 39.McCoy AJ, et al. Phaser crystallographic software. J Appl Crystallogr. 2007;40:658–674. doi: 10.1107/S0021889807021206. [DOI] [PMC free article] [PubMed] [Google Scholar]
- 40.Emsley P, Lohkamp B, Scott WG, Cowtan K. Features and development of Coot. Acta Crystallogr D. 2010;66:486–501. doi: 10.1107/S0907444910007493. [DOI] [PMC free article] [PubMed] [Google Scholar]
- 41.Chen VB, et al. MolProbity: all-atom structure validation for macromolecular crystallography. Acta Crystallogr D. 2010;66:12–21. doi: 10.1107/S0907444909042073. [DOI] [PMC free article] [PubMed] [Google Scholar]
- 42.Evans PR, Murshudov GN. How good are my data and what is the resolution? Acta Crystallogr D. 2013;69:1204–1214. doi: 10.1107/S0907444913000061. [DOI] [PMC free article] [PubMed] [Google Scholar]
Associated Data
This section collects any data citations, data availability statements, or supplementary materials included in this article.


