

Supplemental Digital Content is available in the text.
Key Words: Ovarian cancer, Histotype, Immunohistochemistry, Next-generation sequencing
Abstract
There are 5 major histotypes of ovarian carcinomas. Diagnostic typing criteria have evolved over time, and past cohorts may be misclassified by current standards. Our objective was to reclassify the recently assembled Canadian Ovarian Experimental Unified Resource and the Alberta Ovarian Tumor Type cohorts using immunohistochemical (IHC) biomarkers and to develop an IHC algorithm for ovarian carcinoma histotyping. A total of 1626 ovarian carcinoma samples from the Canadian Ovarian Experimental Unified Resource and the Alberta Ovarian Tumor Type were subjected to a reclassification by comparing the original with the predicted histotype. Histotype prediction was derived from a nominal logistic regression modeling using a previously reclassified cohort (N=784) with the binary input of 8 IHC markers. Cases with discordant original or predicted histotypes were subjected to arbitration. After reclassification, 1762 cases from all cohorts were subjected to prediction models (χ2 Automatic Interaction Detection, recursive partitioning, and nominal logistic regression) with a variable IHC marker input. The histologic type was confirmed in 1521/1626 (93.5%) cases of the Canadian Ovarian Experimental Unified Resource and the Alberta Ovarian Tumor Type cohorts. The highest misclassification occurred in the endometrioid type, where most of the changes involved reclassification from endometrioid to high-grade serous carcinoma, which was additionally supported by mutational data and outcome. Using the reclassified histotype as the endpoint, a 4-marker prediction model correctly classified 88%, a 6-marker 91%, and an 8-marker 93% of the 1762 cases. This study provides statistically validated, inexpensive IHC algorithms, which have versatile applications in research, clinical practice, and clinical trials.
Ovarian carcinomas are currently classified into 5 main histologic types: high-grade serous carcinoma (HGSC), clear-cell carcinoma (CCC), endometrioid carcinoma (EC), mucinous carcinoma (MC), and low-grade serous carcinoma (LGSC), which differ with respect to their biology, clinical presentation, and response to chemotherapy 1,2. Although women diagnosed with HGSC can achieve up to a 100-mo median overall survival (as shown in a recent clinical trial achieving optimal surgical outcome and administering a refined, dose-dense application of the taxol portion of the standard platinum-taxol chemotherapy 3), response rates of MC, CCC, and LGSC to DNA-damaging chemotherapy are dismal 4–6. Reproducible-type diagnosis is a sine qua non for histotype-specific management. With only minimal training in the use of contemporary typing criteria, high agreement (85%–94%) can be achieved among pathologists on the basis of conventional light microscopy alone 7,8. Retrospective research cohorts, however, may contain outdated histotype information because of recent diagnostic shifts 9–11. Because ancillary studies such as immunohistochemistry (IHC) increase reproducibility, IHC markers can assist in retyping these cohorts 8,12–18. Previously, we published 2 equations [termed the Calculator of Ovarian Subtype Probability (COSP)] that calculate probabilities for the 5 histotypes by nominal logistic regression models based on the categorical inputs of 9 or 10 IHC markers, respectively 15,16. Although the performance of these COSP versions (COSPv1 and COSPv2) was good, the requirement of a complex IHC panel hindered their implementation into clinical practice. Our objective was to create a practical algorithm that could be incorporated more easily into routine diagnostics and research. In 2011, Canada’s Terry Fox Research Institute funded the Canadian Ovarian Experimental Unified Resource (COEUR), which, to date, has collected tissue samples from >2000 women diagnosed with ovarian carcinoma from across Canada. We reclassified the COEUR cohort and a population-based cohort from Alberta, Canada [Alberta Ovarian Types (AOVT)], enriched for women diagnosed with MC, EC, and CCC, using COSP, and developed practical IHC algorithms for ovarian carcinoma histotyping.
MATERIALS AND METHODS
Study Cohorts and Tissue Microarray (TMA) Construction
The Conjoint Health Research Ethics Board of the University of Calgary approved this study (E-23527). For the COEUR cohort, formalin-fixed, paraffin-embedded (FFPE) tumor donor blocks were obtained from 10 tumor banks across Canada 19. All patients gave informed consent according to Ethics-approved protocols. A gynecologic pathologist (K.R.) reviewed a single available hematoxylin and eosin slide for the histotype. Nine TMA blocks were constructed, containing HGSC (813), EC (121), CCC (96), MC (61), and LGSC (8), resulting in a total of 1099 cases. Each tumor was represented by duplicate 0.6-mm cores. The year of diagnosis ranged from 1992 to 2013. For the AOVT cohort, eligible women diagnosed with CCC, EC, or MC were identified from the Alberta cancer registry between 1978 and 2009, supplemented by eligible patients diagnosed with CCC, EC, MC, or HGSC in 2010 20. A gynecologic pathologist (M.K. or C.A.E.) reviewed the full slide set for the histotype. Seven TMA blocks were constructed with each tumor represented by triplicate 0.6-mm cores containing EC (182), CCC (167), MC (99), HGSC (79), and mucinous borderline tumor (78). Mucinous borderline tumors were excluded, resulting in a total of 527 cases. As COEUR sourced cases from the same geographical area in overlapping time periods through the Alberta Cancer Research Biobank in Calgary and Edmonton, 18 duplicates between COEUR and AOVT were identified. However, due to specimen deidentification, this linkage could not be carried out for the Edmonton portion of the Alberta Cancer Research Biobank, which contributed 99 cases to COEUR. The 99 cases include a potential overlap between COUER and AOVT. Therefore, in the first part of the study, the reclassification of COEUR and AOVT was performed separately, and 18 duplicates and 99 potential duplicates were excluded from the second part of the study (the development of an IHC algorithm) to assure that no duplicate cases were used. For the purpose of this study, rare mixed carcinomas 21 were classified according to the predominant component represented on the TMA core.
A third cohort was assembled from previously reclassified cohorts represented on TMAs with 0.6-mm duplicate cores using COSPv1 or COSPv2 15,16. This cohort encompasses the training set (N=253) and a subset from the testing set 16 (N=372 cases with agreement of original histotype with COSPv2 prediction) to which cases from the Calgary HGSC and LGSC cohort 14 (N=95) and the Nordic Network of Gynecopathologists cohort 8 (N=54) were added. The purpose of this third cohort was to generate a refined COSP model: COSPv2a, and the cohort was therefore named the COSPv2a-generating cohort.
IHC and Refinement to COSPv2
For the current study, the most useful and stable IHC markers were selected. As opposed to the previous 10-marker COSPv2,16 2 markers (DKK1 and MDM2) were removed for reasons of antibody discontinuation (DKK1, an EC marker) and low expression level (MDM2, a CCC marker). This left an 8-marker IHC panel for COSPv2a generation: WT1, TP53 (p53), CDKN2A (p16), HNF1B, PGR (PR), TFF3, ARID1A, and VIM (Vimentin). Central standardized and automated IHC stains were performed for the COEUR and AOVT cohort and for 348 (253+95)/784 (44%) cases from the COSPv2a-generating cohort that were restained under the same conditions (Table, Supplemental Digital Content 1, http://links.lww.com/IJGP/A32). A total of 426 (372+54) cases from the COSPv2a-generating cohort were not available for central restaining, and previously published data were used. Hence, data for 56% of the COSPv2a-generating cohort pertaining to 5 IHC markers (WT1, TP53, CDKN2A, PGR, VIM) were derived from a different IHC platform than for the COEUR and AOVT cohort. New and restains were scored by a single pathologist (M.K. or P.R.) on TMA glass slides at 20× according to criteria listed in Supplemental Digital Content 1 (http://links.lww.com/IJGP/A32). NAPSA (Napsin A) was added during the study period for available TMAs and replaced HNF1B in the second part of the study.
Arbitration: a Biomarker-assisted Review
Cases with discordant original and predicted histotypes from the COEUR and AOVT cohort were subjected to a biomarker-assisted review. Arbitration by a gynecological pathologist (M.K.) involved a morphologic review of at least 1 representative full hematoxylin and eosin section of the tumor with a knowledge of COSPv2a prediction and an individual biomarker profile.
Arbitration: Targeted Gene Panel Sequencing Analysis
To support arbitration by the molecular reference, a subset of reclassified cases was subjected to targeted sequencing. For each case, tissue cores (0.6 mm) containing histologically viable tumor were obtained from FFPE blocks. DNA was extracted from the tissue cores using the Qiagen FFPE DNA extraction kit on the basis of the manufacturer’s protocols. We performed targeting sequencing analysis using the Illumina custom TruSeq amplicon panel to detect mutations in 28 genes previously implicated in ovarian neoplasms. These included the full coding regions of AKT1, ARID1A, BRCA1, BRCA2, FBXW7, FGFR2, JAK1, KRAS, MLH1, MSH2, MSH6, NRAS, PIK3CA, PIK3R1, PIK3R2, PMS2, POLE, PPP2R1A, PTEN, RNF43, RPL22, SMARCA4, STK11, SPOP, TP53, and in selected exons in FOXL2 (exon 1), CTNNB1 (exon 3), and BRAF (exon 15). The Illumina custom TruSeq amplicon panel was designed using Illumina’s DesignStudio and included 1173 amplicons (175 bp) that cover 98% of the targeted exons. Custom amplicon libraries were prepared starting with 250 ng of the FFPE DNA as per Ilumina’s Custom TruSeq Library Preparation protocol. Before pooling, normalization was performed by quantifying individual libraries using the Qubit fluorometer, and then pooled on the basis of equal concentrations. Library pools were then quantitated for amplifiable libraries using the Kapa Biosystems FAST qPCR SYBR quantification kit on the basis of the manufacturer’s protocols. Pooled TruSeq libraries were sequenced using the Illumina MiSeq using 300 cycle V2 kits. Analysis was performed using the Miseq Reporter and somatic variant caller 3.2.3.0. Known single-nucleotide polymorphisms were excluded and only nonsynonymous mutations passing the quality filter with at least a 10% variant allele frequency were further evaluated. These mutations were checked manually in bam files using an Integrated Genome Viewer, and validated orthogonally by direct Sanger sequencing using primer sets that target the regions containing the mutations.
Statistical Analysis
A nominal logistic regression model was used to generate prediction equations, as described previously 15, with an 8-marker IHC input on the COSPv2a-generating cohort using JMP version 11.0 (SAS Institute, Cary, NC). For model predictions, a receiver operator characteristic area under the curve was calculated for each histologic type category. The model predictions were then applied to the COEUR and AOVT cohort. To evaluate histologic-type assessments with the overall survival, survival curves were generated using the Kaplan–Meier method and compared with the log-rank test. Two IHC algorithms were constructed using the χ2 Automatic Interaction Detection (CHAID) method using SPSS, version 20, and recursive partitioning using JMP version 12.0 (SAS Institute). CHAID allowed a random split into equal training and testing sets. IHC results served as the independent variables, and the reclassified histotype served as the dependent variable. A P-value of <0.05 was required to split each node. A two-sided Fisher exact test or the Pearson χ2 test was used, where appropriate, to compare contingency tables. Significance values were considered <0.05 and adjusted using the Bonferroni method where appropriate.
RESULTS
Biomarker-assisted Reclassification
Clinicopathologic parameters of the cohorts are depicted in Table 1. The AOVT cohort was enriched for EC, CCC, and MC. Therefore, the patients are significantly younger and more likely diagnosed at Stages I/II. The COEUR and AOVT cohort was subjected to COSPv2a, a histotype prediction model based on an 8 IHC marker input derived from the COSPv2a-generating cohort. Figure 1 shows the reclassification for COEUR. The results for AOVT were similar (Supplemental Digital Content 2, http://links.lww.com/IJGP/A33). For COEUR, the COSPv2a prediction agreed with the original type in 81% of the cases. In 7%, no prediction could be generated due to incomplete data because the model requires data on all 8 markers. There was no agreement in 12% of the cases. Cases with no agreement or no prediction were subjected to arbitration.
TABLE 1.
Characteristics of the study cohorts
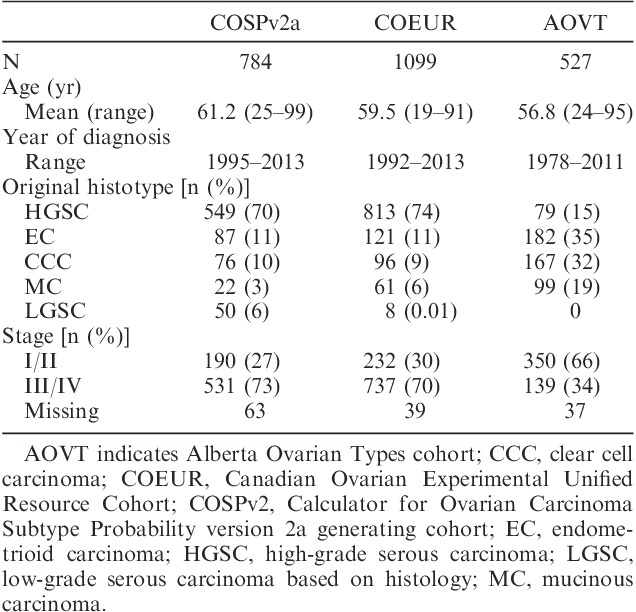
FIG. 1.
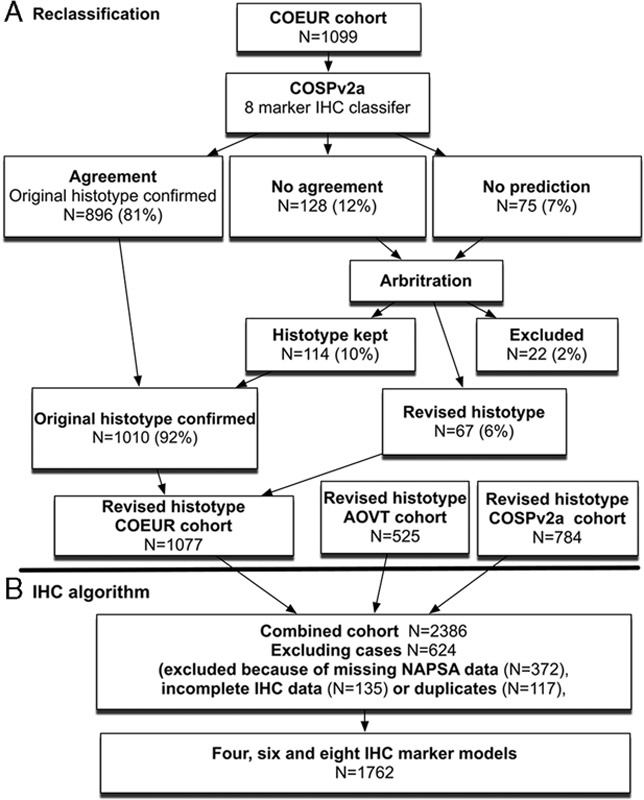
The study flow chart. (A): the first reclassification part of the study was performed on the Canadian Ovarian Experimental Unified Resource (COEUR) cohort and the Alberta Ovarian Tumor Type cohort (AOVT, not shown). The previously reclassified Calculator of Ovarian Subtype Probability (COSP) prediction version 2a-generating (COSPv2a-generating) cohort was used to generate a histotype prediction using the categorical input from 8 immunohistochemistry (IHC) markers. (B) cohorts used and exclusion criteria for the second part of the study (IHC algorithm development). NAPSA indicates Napsin A.
Arbitration
For COEUR, 22 cases (1%) were excluded because these could not be assigned to one of the 5 major histotypes. The initial arbitration (biomarker-assisted review) reclassified the histotype in 72 cases. The most common revisions were original EC to HGSC and vice versa (N=29 and 8, respectively), original HGSC to LGSC and vice versa (N=13 and 3), and original HGSC to CCC and vice versa (N=7 and 1).
Cases in the 2 largest reclassified groups EC to HGSC (N=29) and HGSC to EC (N=8) were subjected to targeted sequencing of genes that are known to be recurrently mutated in HGSC and EC 22,23. Three cases were excluded from our analysis because of a poor DNA read quality. Of the 34 tumor samples with DNA of sufficient quality, there was an average of 980-fold coverage per amplicon, and 92.3% of the amplicons had a median coverage of at least 50-fold. In 6 cases, no mutations were detected, including 2 HGSC with abnormal TP53 IHC. In a previous study, we were able to detect TP53 mutations in all HGSC that showed abnormal TP53 IHC either by reanalysis or resequencing. Therefore, the absence of TP53 mutations with an abnormal TP53 IHC was not used as evidence against HGSC. In 3 cases of reclassified HGSC with either TP53 mutation or BRCA1 mutation, additional mutations were found that are rare in HGSC, but common in other types (RNF43, MSH2, RPL22). Taken together, in these 12 cases, sequencing did not provide sufficient evidence to change the IHC-supported review. The mutational profile in the remaining 25 cases suggested either an HGSC or an EC-like profile. An HGSC-like profile was defined as showing TP53 mutation with or without BRCA1 or 2 mutation in the absence of EC-like mutations. EC-like mutations were defined as one or more mutations of CTNNB1, PIK3CA, ARID1A, KRAS, or PTEN with or without a concurrent TP53 mutation 22,24. Sequencing confirmed reclassification in 20 instances (16 EC to HGSC and 4 EC to HGSC), but refuted the reclassification from EC to HGSC in 5 instances, thus decreasing the number of reclassified diagnoses from original EC to HGSC to N=24 (Fig. 2).
FIG. 2.
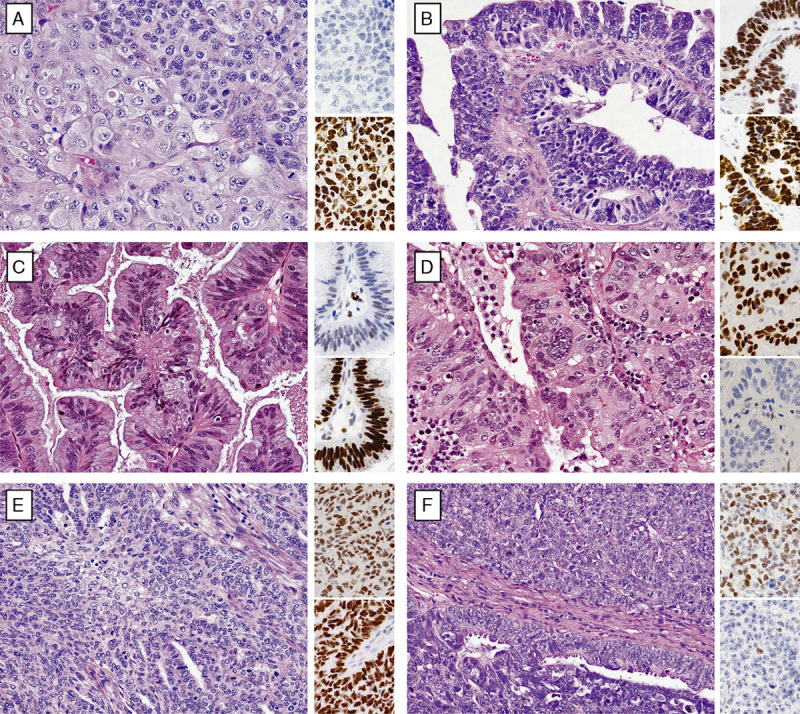
Challenging cases between endometrioid (EC) and high-grade serous carcinoma (HGSC). The smaller insets beside the hematoxylin and eosin staining indicate corresponding WT1 (upper) and TP53 (lower) staining. All cases, except (A), showed the presence of WT1 and abnormal TP53 expression. (A) EC (Grade 3) reclassified from HGSC on the basis of a biomarker-assisted review (the absence of WT1) and the morphology showing a solid neoplasm (upper right) with squamoid features (lower left). (B) HGSC reclassified from the EC-based biomarker-assisted review (the presence of WT1 and abnormal TP53 expression without specific features for EC, i.e. the absence of low-grade nuclear atypia and squamous or mucinous differentiation). (C) EC (Grade 1) with weak WT1 and abnormal TP53 expression that was not reclassified by a biomarker-assisted review due to the presence of low-grade nuclear atypia and mucinous differentiation. (D) EC (Grade 2, ATiM693 in Tab. S3) with WT1 and an abnormal TP53 expression and a similar morphology compared with (C), which was reclassified to HGSC by a biomarker-assisted review, but sequencing refuted the reclassification. Concurrent TP53/PIK3CA mutations favor EC. (E) EC (Grade 3) with WT1 and abnormal TP53 expression that was not reclassified by the biomarker-assisted review due to the presence of low-grade nuclear atypia and squamous differentiation. (F) EC (Grade 3, ATiM322 in Tab. S3) with WT1 and abnormal TP53 expression and a similar morphology compared with (E), which was reclassified to HGSC by the biomarker-assisted review, but sequencing refuted the reclassification. Concurrent TP53/PIK3CA mutations favor EC.
The disease-specific survival of reclassified EC to HGSC was compared with the reference group of EC and HGSC. Although there was a significant difference for disease-specific survival between HGSC and reclassified EC to HGSC (hazard ratio=1.81; 95% confidence interval, 1.10–3.25, P=0.017), the difference was larger between EC and reclassified EC to HGSC (hazard ratio=3.57, 95% confidence interval, 1.89–6.34, P=0.0002) (Fig. 3). The frequency of biomarker expression in reclassified EC to HGSC was similar to HGSC, with the exception of PGR, which with 73% is higher than expected for HGSC. Sixteen of the 24 (66%) reclassified EC to HGSC were Grade 3, 7 cases Grade 2, and 1 case Grade 1. The reclassification decreased the proportion of Grade 3 EC from 29% in the original diagnosis to 20% after reclassification. The 8 cases reclassified from HGSC to EC were either Grade 2 or Grade 3.
FIG. 3.
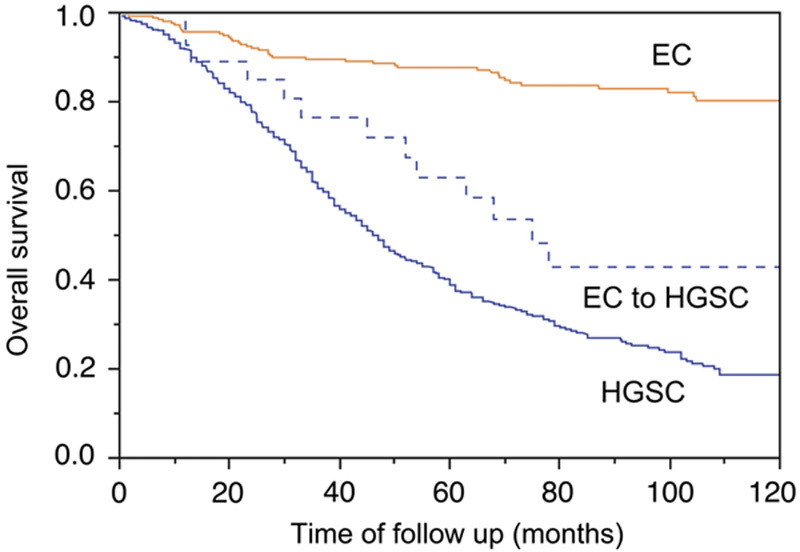
The Kaplan-Meier survival analysis for reclassified endometrioid carcinoma to high-grade serous carcinoma (EC to HGSC, N=31) from the Canadian Ovarian Experimental Unified Resource and the Alberta Ovarian Tumor Type cohort in comparison with reference EC (N=262) and HGSC (N=802) with available outcome data. EC indicates endometrioid carcinoma; HGSC, high-grade serous carcinoma.
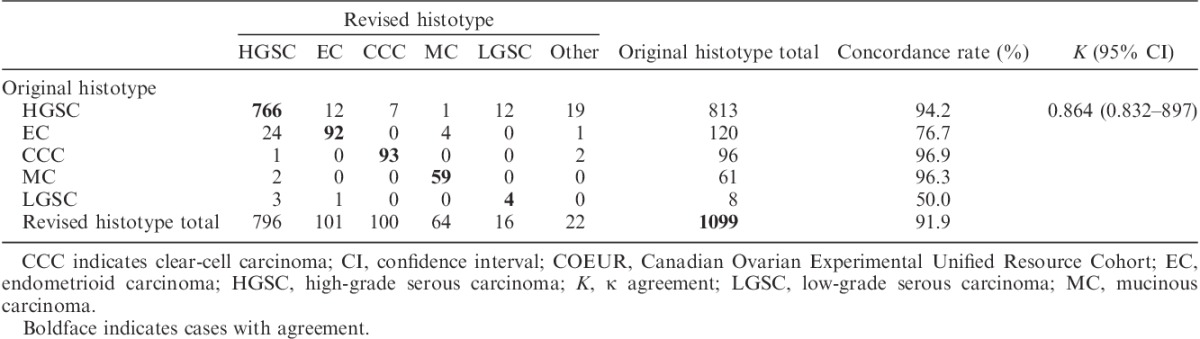
After arbitration using a combination of biomarker-assisted review and next-generation sequencing, the histotype was reclassified in 67 (6%) cases (Table 2). Confirmation rates were the highest for CCC (96.9%), followed by MC (96.3%), and HGSC (94.2%), but lower for EC (76.7%) and LGSC (50%); however, there were only N=8 original diagnosed LGSC in the COEUR cohort. Results for AOVT were highly similar [the histotype was reclassified in 18 cases (3%, 2 excluded)]. Although the confirmations rate for EC was higher at 95.6%, reclassification between HGSC and EC remained the highest (12/20, Supplemental Digital Content 2, http://links.lww.com/IJGP/A33).
TABLE 2.
Pair-wise agreement of the original histotype and the revised histotype after arbitration for COEUR
Development of IHC Algorithms
With the new reclassified histotype as the endpoint, we developed several IHC-based prediction models using different numbers of marker as the input, applying 3 statistical methods. Data from all cohorts were combined. Only cases with complete data for 8 IHC markers (WT1, TP53, CDKN2A, PGR, TFF3, NAPSA, ARID1A, and VIM) were included. Further, cases with missing NAPSA data or duplicates across the cohorts were excluded (Fig. 1). During the study period, available TMA were stained with NAPSA, a CCC marker previously shown to have a high sensitivity and specificity for CCC 25. Compared with HNF1B, NAPSA had a similar sensitivity for CCC (91.9%–90.8%, respectively), but a better specificity, particularly with respect to MC (97.0%–59.7%). Therefore, we replaced HNF1B with NAPSA.
First we used a nominal logistic regression model, which required the 8-marker panel described above. A total of 1641 out of 1762 cases were classified correctly (confusion matrix in Figure, Supplemental Digital Content 3, http://links.lww.com/IJGP/A34). The overall accuracy was 93.1%. This logistic regression model represents a further refinement of COSP: COSPv3. Receiver operator characteristic values by the histotype of COSPv3 are shown in Supplemental Digital Content 5 (http://links.lww.com/IJGP/A36). In comparison, a recursive partitioning model with 8 splits classified 1601/1762 (90.9%) cases correctly, similar to a recursive partitioning model with 6 splits that classified 1600/1762 cases correctly (90.8%, Figure, Supplemental Digital Content 3, http://links.lww.com/IJGP/A34). This model requires a 6-marker panel consisting of WT1, TP53, NAPSA, CDKN2A, PGR, and TFF3. A recursive partitioning model with only 4 splits classified 1559/1762 cases correctly (88.5%). It requires a 4-marker panel consisting of WT1, TP53, NAPSA/Napsin A, and PGR/PR. To minimize cohort selection bias and prevent model overfitting, we also used split-sample validation, which assigned roughly half of the cases to a new training set randomly and the other half of the cases to a new test set using an alternative statistical approach (the CHAID method). CHAID yielded exactly the same decision tree on the basis of the 4-marker panel consisting of WT1, TP53, NAPSA, and PGR (Fig. 4), with an overall accuracy of 88.5%. The overall accuracy for the new test set was 87.2% (Supplemental Digital Content 6, http://links.lww.com/IJGP/A37). Using this 4-marker panel, Figure 4 shows that IHC has a high specificity or sensitivity in certain scenarios. For example, a combination of WT1 expression with abnormal p53 staining is highly specific for HGSC, with only 6 cases with other histotype diagnoses showing this profile, as seen in Node 6 in Figure 4. A combination of WT1 expression with wild-type p53 staining is sensitive for LGSC with only 1 LGSC showing an IHC profile outside Node 5 in Figure 4. However, LGSC barely represents the majority of the cases in Node 5, and is therefore not very specific.
FIG. 4.
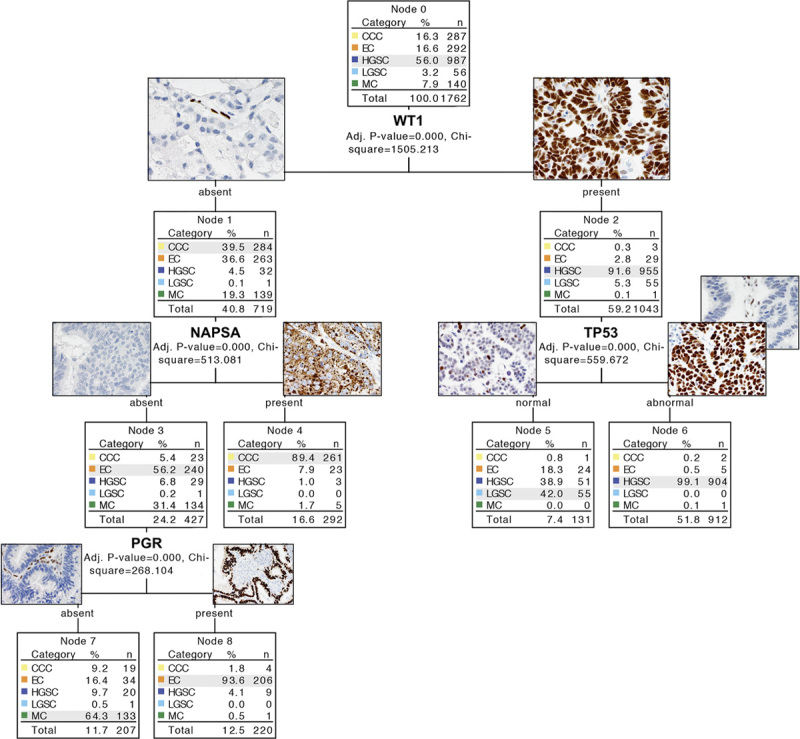
The four-marker χ2 Automatic Interaction Detection (CHAID)-based immunohistochemistry (IHC) algorithm. Examples of images of IHC marker expression are included. TP53 abnormal is characterized by 2 patterns: diffuse overexpression and complete absence (note internal control in the latter). NAPSA expression shows granular cytoplasmic staining. CCC indicates clear cell carcinoma; EC, endometrioid carcinoma; HGSC, high-grade serous carcinoma; LGSC, low-grade serous carcinoma; MC, mucinous carcinoma; NAPSA, Napsin A.
Because of the difference in histotypes in the stage distribution, the pretest likelihood of a certain histotype differs if the stage is known. We performed additional recursive partitioning stratified by Stages I/II against III/IV using a 6-marker input. The result for Stages III/IV is identical with that for all stages. In Stage I/II, NAPSA becomes the first split, followed by WT1 in the NAPSA-negative arm and PR in the NAPSA-positive arm (Figure, Supplemental Digital Content 3, http://links.lww.com/IJGP/A34).
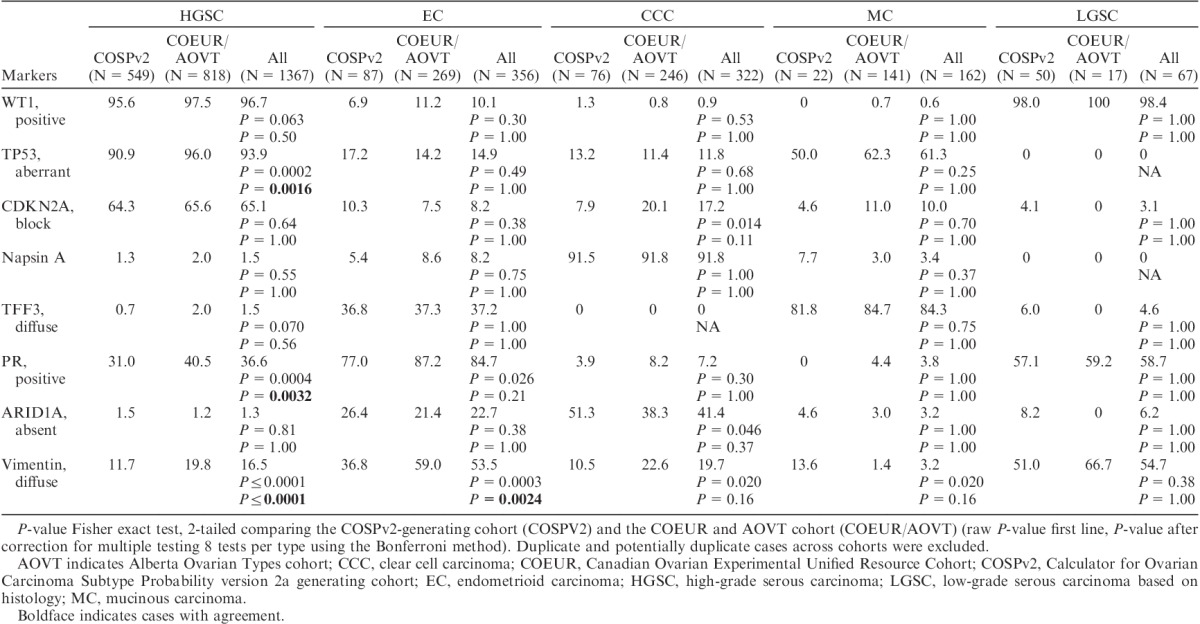
The Biomarker Expression Frequency
The frequency of biomarker expression by the reclassified histotype is shown in Table 3. Because of analytic and cohort selection differences between COSPv2a-generating and COEUR and AOVT cohorts, we show the marker expression comparing both as well as for all cases combined. After adjusting for multiple testing, TP53, PGR, and VIM show significantly different frequencies within HGSC and VIM within EC, comparing the COSPv2a-generating and the COEUR and AOVT cohorts. As HGSC represents the group with the largest case numbers, smaller P-values can be expected and absolute differences are more important. The PGR expression for HGSC was higher by 9% in the COEUR and AOVT cohort compared with the COSPv2a-generating cohort, as was 5% for TP53. For 2 of the 4 markers, which were stained on different platforms, we performed a head-to-head platform comparison in a subset of cases. Both platforms performed similarly for PGR and TP53 (Table, Supplemental Digital Content 7, http://links.lww.com/IJGP/A38), suggesting that the difference for PGR and TP53 staining between the COSPv2a-generating and the COEUR and AOVT cohorts is a reflection of preanalytic factors intrinsic to the cohorts rather than analytic factors related to the IHC platform. The most problematic biomarker is VIM, showing a variation of 8% in HGSC to 22% in EC across cohorts, which compares unfavorably with CDKN2A, which shows a 1% and 3% difference in HGSC and EC, respectively.
TABLE 3.
The frequency of the marker expression % across revised histotypes
DISCUSSION
In previous studies, we identified the most useful IHC markers (COSP, COSPv2) for histologic typing 15,16; however, the requirement for up to 10 IHC markers, some of which used antibodies that were not widely available, precluded their implementation in daily pathology practice. Here, we present statistically robustly validated IHC algorithms for typing of ovarian carcinomas in the form of a hierarchical decision tree, which is more relevant to human decision making. Most pathology laboratories have the minimal 4-marker IHC marker panel (WT1, TP53, NAPSA, and PGR) available. Alternatively, we also provide a new COSP prediction formula, which is a refined version 3 (COSPv3), and is now based on 8 IHC markers (WT1, TP53, CDKN2A, NAPSA, PGR, TFF3, ARID1A, VIM), which is also more feasible for cohort reclassification for research purposes.
The overall accuracy of the IHC-based classification ranges from 87% to 93% depending on the number of input markers (4–8, respectively) and the statistical model. A minimal panel of 4 markers already achieves 87% accuracy. A 6-marker panel increased the accuracy to 91% due to deeper splits, including CDKN2A and TFF3 to increase the identification of LGSC and MC, respectively. With an 8-marker panel and the nominal logistic regression model, there is only a slight increase by another 2%. Although the morphology and the expected IHC profile are concordant in the majority of the ovarian carcinomas, there is a subset of 7% to 13% cases where this is not the case. This discrepancy can be caused by an IHC assay error, a morphology error, or a true aberrant IHC phenotype. IHC assay error can occur due to the use of TMAs, limiting the sensitivity when the antigen is expressed only focally. Although the use of a full section may increase the sensitivity, this may or may not come at a cost of reduced specificity. For example, the sensitivity of NAPSA for CCC in our TMA study was 92% compared with 100% in the study using full sections. However, the specificity for CC against EC was slightly better on TMAs (92%) compared with that reported from full section (90%), perhaps due to the larger number of cases in this study 25. The 3 most important IHC markers (WT1, TP53, NAPSA) were recently a part of the Canadian Interlaboratory Immunohistochemistry Quality Control run 42 26. Whereas WT1 and NAPSA performed very well with error rates of <1% and 4%, respectively, TP53 showed an error rate of 9%, indicating the need for further optimization across pathology laboratories.
Discrepancy can also result from errors in morphologic assessment, which is subjective. In the first part of the study, we reclassified the histotype using IHC information and then we compared the IHC-reclassified histotype with the IHC profile. There is a danger of circular reasoning. To address this, we subjected the largest reclassified group (EC to HGSC and vice versa) to targeted sequencing. However, in 32% of the cases, sequencing was not used in the final typing due to reasons including poor DNA quality, no mutation detected, or mutation detected but difficult to interpret. This shows the limitations of current targeted sequencing panels for classification purposes if a significant subset remains uninformative. Although the mutational profile supported the reclassification in 80% of the informative cases, it refuted it in 20%, which suggests additional value of the mutational status in cases with a discordant morphology and IHC profile. As additional support for the validity of reclassifying a large group of EC to HGSC, we noticed that the outcome of reclassified EC to HGSC is very different from the reference EC. Although their outcome is worse than the reference EC, the reclassified cases also do not overlap with the reference HGSC. One explanation is that these represent HGSC with a higher PGR expression, which occur in a subset of HGSC associated with a favorable outcome, 27 and this subset could be particularly prone to misclassification as EC. The overall confirmation rate of 92% for COEUR and 96% for AOVT compares favorably with prior reports 16,17. The difference is that the current cases were already contemporarily reviewed with the full slide set available for AOVT and 1 representative slide for COEUR. However, results show that even in reviewed series, IHC algorithms can refine the histotype in 4% to 8% of the cases and that the most challenging scenario remains HGSC against EC, particularly involving Grade 2/3 cases.
There are several considerations for practical purposes. The presence of WT1 and abnormal TP53 expression was detected in 906 out of 987 (91.7%) HGSC. Only 8 of out 912 cases (1%) showing this combination were histotypes other than HGSC, including 5 EC. A diagnosis of a carcinoma other than HGSC in the presence of WT1 positivity and abnormal TP53 expression seems unwise and has to stand on sound morphologic grounds (low-grade nuclear atypia in glandular or villoglandular architecture with squamous or mucinous differentiation) or be supported by other molecular evidence such as EC-like mutations. The WT1 negativity rate in HGSC (3%) has decreased remarkably from 20% before 2008 1, mostly due to the increased sensitivity of IHC. Although almost all CCC and MC remain WT1 negative, WT1 expression in EC has also increased slightly from 4% 1 to 10% currently, which is similar to another study 28. Notably, WT1-positive EC are TP53 wild type and should therefore not be confused with HGSC. Only 5% of the HGSC are TP53 wild type by IHC. However, we have previously shown that 5% of the HGSC with the TP53 wild-type IHC pattern still contain the TP53 mutation in a different series because not all TP53 mutations alter the expression of the protein 29. These tumors are particularly challenging with respect to the differential diagnosis of LGSC, which share the same WT1-positive/TP53 wild-type IHC profile. A diagnosis of LGSC should be rethought if the tumor is WT1 negative or TP53 abnormal. Ninety-two percent of the CCC express NAPSA. Expression can be focal and there may be a small subset of NAPSA-negative CCC. The diagnosis of a NAPSA-negative CCC seems acceptable if the morphology is typical, and other evidence for HGSC (WT1 and TP53) or EC (PR) are lacking. MC usually do not cause problems on morphologic grounds when abundantly sampled and the associated precursor is present. However, there can be architectural and cytologic overlap with EC. PR (similarly, also ER, personal observations, M. Köbel, 2016) and TFF3, if available, discriminate most cases. Notably, MC show abnormal TP53 expression in 50% of the cases and higher-grade, “mucin-poor” MC may be confused with HGSC; however, WT1 (and rarely ER, personal observations) will not be expressed in MC. In summary, cases with unusual IHC profiles are interesting groups to study for classification purposes, and perhaps additional molecular markers will help in these situations.
IHC is a robust adjunct tool for the subclassification of ovarian carcinomas. We observed a relatively narrow expression range across cohorts with some exceptions. These can be attributed to preanalytical issues with a variable tissue quality because the range in tissue age was 32 yr (oldest specimen from 1978) and/or to postanalytical factors (intraobserver reproducibility for VIM). Analytical factors do not play a major role in the differences observed.
The presented IHC algorithms may be of use to practicing pathologists and researchers. An error rate of approximately 10% does not allow the use of IHC as a stand-alone, but supports its continued use as an adjunct in daily practice. In conjunction with morphology, the IHC algorithm developed has the power to improve interobserver reproducibility of histotype diagnosis. It can also be used to reclassify retrospective cohorts. For example, studies on CCC may be required to show that they are WT1 negative and NAPSA positive. This tool could also be considered to help select patients for histotype-specific clinical trials.
Supplementary Material
Supplemental Digital Content is available for this article. Direct URL citations appear in the printed text and are provided in the HTML and PDF versions of this article on the journal's Website, www.intjgynpathology.com.
Acknowledgments
The authors thank Jennifer M Koziak for AOVT study management and Mie Konno, Michelle Darago, Faye Chambers, and staff at the Tom Baker Cancer Centre Translational Laboratories for AOVT study tumor block retrieval and TMA construction. They thank Shuhong Liu and Christine Chow for immunohistochemical stains and Taryn Rutherford for study coordination. They also thank the anonymous reviewer for their constructive comments.
Footnotes
Supported by the Calgary Laboratory Services internal research competition (RS11-508). The specimen collection for the COEUR cohort was supported by a grant from the Terry Fox Research Institute. Clinical specimens from the province of Quebec were provided by the Banque de tissus et de données of the Réseau de recherche sur le cancer of the Fonds de recherché du Québec-Santé, which is affiliated to the Canadian Tumor Repository Network. Biologic materials from the province of Ontario were provided by the Ontario Tumour Bank, which is funded by the Ontario Institute for Cancer Research, Ottawa Ovarian Cancer Tissue Bank, and the University Health Network Biobank. Specimens from the province of British Columbia were provided by the BCCA Tumor Tissue Repository and the OvCare Gynecologic Tissue Bank. Finally, specimens from the province of Alberta were provided from the CBCF Tumor Biobank. The AOVT study was supported by the Canadian Institutes of Health Research (MOP-86727).
The authors declare no conflict of interest.
REFERENCES
- 1.Köbel M, Kalloger SE, Boyd N, et al. Ovarian carcinoma subtypes are different diseases: implications for biomarker studies. PLoS Med 2008;5:e232. [DOI] [PMC free article] [PubMed] [Google Scholar]
- 2.Köbel M, Kalloger SE, Huntsman DG, et al. Differences in tumor type in low-stage versus high-stage ovarian carcinomas. Int J Gynecol Pathol 2010;29:203–11. [DOI] [PubMed] [Google Scholar]
- 3.Katsumata N, Yasuda M, Isonishi S, et al. Long-term results of dose-dense paclitaxel and carboplatin versus conventional paclitaxel and carboplatin for treatment of advanced epithelial ovarian, fallopian tube, or primary peritoneal cancer (JGOG 3016): a randomised, controlled, open-label trial. Lancet Oncol 2013;14:1020–6. [DOI] [PubMed] [Google Scholar]
- 4.Kelemen LE, Köbel M. Mucinous carcinomas of the ovary and colorectum: different organ, same dilemma. Lancet Oncol 2011;12:1071–80. [DOI] [PubMed] [Google Scholar]
- 5.Anglesio MS, Carey MS, Köbel M, et al. Clear cell carcinoma of the ovary: a report from the first Ovarian Clear Cell Symposium, June 24th, 2010. Gynecol Oncol 2011;121:407–15. [DOI] [PubMed] [Google Scholar]
- 6.Diaz-Padilla I, Malpica AL, Minig L, et al. Ovarian low-grade serous carcinoma: a comprehensive update. Gynecol Oncol 2012;126:279–85. [DOI] [PubMed] [Google Scholar]
- 7.Köbel M, Kalloger SE, Baker PM, et al. Diagnosis of ovarian carcinoma cell type is highly reproducible: a transCanadian study. Am J Surg Pathol 2010;34:984–93. [DOI] [PubMed] [Google Scholar]
- 8.Köbel M, Bak J, Bertelsen BI, et al. Ovarian carcinoma histotype determination is highly reproducible, and is improved through the use of immunohistochemistry. Histopathology 2013;64:1004–13. [DOI] [PubMed] [Google Scholar]
- 9.Soslow RA. Histologic subtypes of ovarian carcinoma: an overview. Int J Gynecol Pathol 2008;27:161–74. [DOI] [PubMed] [Google Scholar]
- 10.McCluggage WG. My approach to and thoughts on the typing of ovarian carcinomas. J Clin Pathol 2008;61:152–63. [DOI] [PubMed] [Google Scholar]
- 11.Soslow RA. DNA repair mutations and outcomes in ovarian cancer—letter. Clin Cancer Res 2015;21:658. [DOI] [PubMed] [Google Scholar]
- 12.Köbel M, Kalloger SE, Carrick J, et al. A limited panel of immunomarkers can reliably distinguish between clear cell and high-grade serous carcinoma of the ovary. Am J Surg Pathol 2009;33:14–21. [DOI] [PubMed] [Google Scholar]
- 13.Madore J, Ren F, Filali-Mouhim A, et al. Characterization of the molecular differences between ovarian endometrioid carcinoma and ovarian serous carcinoma. J Pathol 2010;220:392–400. [DOI] [PubMed] [Google Scholar]
- 14.Altman AD, Nelson GS, Ghatage P, et al. The diagnostic utility of TP53 and CDKN2A to distinguish ovarian high-grade serous carcinoma from low-grade serous ovarian tumors. Mod Pathol 2013;26:1255–63. [DOI] [PubMed] [Google Scholar]
- 15.Kalloger SE, Köbel M, Leung S, et al. Calculator for ovarian carcinoma subtype prediction. Mod Pathol 2011;24:512–21. [DOI] [PubMed] [Google Scholar]
- 16.Köbel M, Kalloger SE, Lee S, et al. Biomarker-based ovarian carcinoma typing: a histologic investigation in the ovarian tumor tissue analysis consortium. Cancer Epidemiol Biomarkers Prev 2013;22:1677–86. [DOI] [PMC free article] [PubMed] [Google Scholar]
- 17.Kommoss S, Gilks CB, Kommoss F, et al. Accelerating type-specific ovarian carcinoma research: Calculator for Ovarian Subtype Prediction (COSP) is a reliable high-throughput tool for case review. Histopathology 2013;63:704–12. [DOI] [PubMed] [Google Scholar]
- 18.Hoang LN, Zachara S, Soma A, et al. Diagnosis of ovarian carcinoma histotype based on limited sampling: a prospective study comparing cytology, frozen section, and core biopsies to full pathologic examination. Int J Gynecol Pathol 2015;34:517–27. [DOI] [PubMed] [Google Scholar]
- 19.Le Page C, Köbel M, de Ladurantaye M, et al. Specimen quality evaluation in Canadian biobanks participating in the COEUR repository. Biopreserv Biobank 2013;11:83–93. [DOI] [PubMed] [Google Scholar]
- 20.Kelemen LE, Warren GB, Koziak JM, et al. Smoking may modify the association between neoadjuvant chemotherapy and survival from ovarian cancer. 2016;140:124–30. [DOI] [PubMed]
- 21.Mackenzie R, Talhouk A, Eshragh S, et al. Morphologic and molecular characteristics of mixed epithelial ovarian cancers. Am J Surg Pathol 2015;39:1548–57. [DOI] [PMC free article] [PubMed] [Google Scholar]
- 22.Bell D, Berchuck A, Birrer M, et al. Integrated genomic analyses of ovarian carcinoma. Nature 2011;474:609–15. [DOI] [PMC free article] [PubMed] [Google Scholar]
- 23.Kandoth C, Schultz N, Cherniack AD, et al. Integrated genomic characterization of endometrial carcinoma. Nature 2013;497:67–73. [DOI] [PMC free article] [PubMed] [Google Scholar]
- 24.McConechy MK, Ding J, Senz J, et al. Ovarian and endometrial endometrioid carcinomas have distinct CTNNB1 and PTEN mutation profiles. Mod Pathol 2013;27:128–34. [DOI] [PMC free article] [PubMed] [Google Scholar]
- 25.Kandalaft PL, Gown AM, Isacson C. The lung-restricted marker napsin A is highly expressed in clear cell carcinomas of the ovary. Am J Clin Pathol 2014;142:830–6. [DOI] [PubMed] [Google Scholar]
- 26.Lee S, Piskorz A, Le Page C, et al. Calibration and optimization of p53, WT1, and Napsin A immunohistochemistry ancillary tests for histotyping of ovarian carcinoma: Canadian Immunohistochemistry Quality Control (CIQC) experience. Int J Gynecol Pathol. Nov 23 2015 [Epub ahead of print]. [DOI] [PubMed] [Google Scholar]
- 27.Sieh W, Köbel M, Longacre TA, et al. Hormone-receptor expression and ovarian cancer survival: an Ovarian Tumor Tissue Analysis consortium study. Lancet Oncol 2013;14:853–62. [DOI] [PMC free article] [PubMed] [Google Scholar]
- 28.Stewart CJR, Brennan BA, Chan T, et al. WT1 expression in endometrioid ovarian carcinoma with and without associated endometriosis. Pathology 2008;40:592–9. [DOI] [PubMed] [Google Scholar]
- 29.Köbel M, Piskorz A, Li S, et al. Immunohistochemistry predicts presence and type of TP53 mutation in high-grade serous carcinoma. [abstract]. In: Proceedings of the 105th Annual Meeting of the American Association for Cancer Research; 2014 Apr 5-9 San Diego, CA. Philadelphia (PA): AACR. Cancer Res 2014;74(suppl). Abstract no. 1535. [Google Scholar]
Associated Data
This section collects any data citations, data availability statements, or supplementary materials included in this article.
Supplementary Materials
Supplemental Digital Content is available for this article. Direct URL citations appear in the printed text and are provided in the HTML and PDF versions of this article on the journal's Website, www.intjgynpathology.com.