

Abstract
The origin of the attenuation of starlight in diffuse clouds in interstellar space at specific wavelengths ranging from the visible to the near-infrared has been unknown since the first astronomical observations around a century ago. The absorption features, termed the diffuse interstellar bands, have subsequently been the subject of much research. Earlier this year four of these interstellar bands were shown to be due to the absorption by cold, gas phase  molecules. This discovery provides the first answer to the problem of the diffuse interstellar bands and leads naturally to fascinating questions regarding the role of fullerenes and derivatives in interstellar chemistry. Here, we review the identification process placing special emphasis on the laboratory studies which have enabled spectroscopic measurement of large cations cooled to temperatures prevailing in the interstellar medium.
This article is part of the themed issue ‘Fullerenes: past, present and future, celebrating the 30th anniversary of Buckminster Fullerene’.
Keywords: diffuse interstellar bands, C+60, interstellar
1. Introduction
Soon after the discovery of buckminster fullerene, C60, and the establishment of its spherical structure [1], the potential role of this molecule in interstellar chemistry was considered. As early as 1987, Kroto predicted that in the diffuse medium where starlight penetrates it may be the ionized form,  , rather than neutral C60, which is present [2]. In 1992, Kroto and Jura made the intriguing suggestion that derivatives of
  , including those with hydrogen or other cosmically abundant heavier atoms, such as Na and Fe, are candidate molecules to explain a series of absorptions observed towards reddened stars, known as the diffuse interstellar bands (DIBs) [3].
The history of these astronomical features dates back around a hundred years. Heger is widely cited with making the first observations when, in 1922, she reported ‘stationary’ bands in a study of spectroscopic binaries [4]. Some 10 years later, Merrill suggested the nature of these features to be interstellar [5,6]. The widths of the astronomical spectra were found to be broader than atomic lines, leading to their description as diffuse (for an early history, see [7,8]). Today these unidentified interstellar features number some 400 and they are regarded as one of the major unresolved problems in observational astronomy [9]. One important discovery was that the astronomical data display characteristics common to the electronic spectra of polyatomic molecules.
After Krätschmer et al. [10] described the preparation of C60 in macroscopic quantities, its electronic spectrum was obtained. A molecular beam of C60 in the gas phase at low temperature was produced by laser vaporization of a solid sample and the spectrum recorded by laser excitation and ionization [11]. There were a number of subsequent attempts, without success, to detect these laboratory absorptions in diffuse interstellar clouds [12,13]. Only in 2010 was C60 identified in space, through detection of its four characteristic infrared bands in emission from a young planetary nebula [14] and reflection nebulae [15]. In the following, we discuss the steps leading up to the measurement of the gas-phase electronic spectrum of  and its identification in diffuse interstellar clouds [16].
2. Laboratory spectroscopy of  in solid neon
In 1989, we developed a new approach to measure the electronic spectra of ions and neutral molecules in neon matrices [17]. Through the combination of mass selectivity and matrix isolation, we were able to overcome the usual complexity arising from the production of numerous species in the matrix concomitantly. A waveguide technique was used to enhance the detection sensitivity by passing monochromatic light a distance of 2 cm through a matrix of 100 μm thickness by internal reflection. Such matrices are typically grown over a couple of hours using around a nanoampere of ion current, and allow absorption spectra in the 220 nm to 1 μm region to be readily measured. Figure 1 shows the current version of our experimental set-up.
Figure 1.

Schematic of the experimental set-up used for absorption measurements in a neon matrix. The ion beam is mass-selected using a quadrupole mass spectrometer and co-deposited with neon ontoa substrate plate held at 5 K. Over a period of several hours, a matrix of 100 μm thickness is grown. A waveguide approach (inset) is used to pass light from a Xe or Hg lamp through the matrix.
Such has been the success of this technique that over the next 25 years we were able to identify, for the first time, the electronic spectra of numerous transient species, including neutral carbon chains, their positive and negative ions, and other derivatives [18]. With the knowledge of the wavelength range of the electronic transitions, it in turn became possible to measure the spectra in the gas phase using a variety of sensitive laser-based methods [19].
With this concept in mind, we used our apparatus to measure the electronic absorption spectrum of  in a 5 K neon matrix (figure 2). The lowest energy electronic transition lies in the near infrared and has an origin band at 9645 Å . This transition was first observed in 77 K glassy matrices [20], appearing as a broad band with a maximum at around 9800 Å . Subsequently, it was recorded in an 11 K argon matrix where it has a band maximum at 9730 Å [21]. However, because our final goal was the gas phase measurement of
  , we required the spectrum in a neon matrix. Measurements of cationic species for which gas-phase spectra were also available indicated that the energy shift due to the presence of the environment for neon matrices, as opposed to glassy or argon ones, is seldom more than 100 cm−1 [18]. Furthermore, the spectral features recorded in 5–6 K neon matrices appear narrow and distinct in comparison to the other media.
Figure 2.

Electronic absorption spectrum of  recorded in a 5 K neon matrix, showing the four strongest features of the lowest energy transition, assigned as
  in D5d symmetry. The band maxima are at 9645, 9583, 9431 and 9375 Å.
In addition to the origin band at 9645 Å , the absorption spectrum of  in neon has an equally strong band lying 62 Å to higher energy. Our 1993 study was motivated by the possibility of
  being a diffuse interstellar band carrier [2]. In the published article, we stated ‘Thus the origin of the
  gas-phase transition should lie in the 9650–9510 Å range. However, spectral observations of diffuse interstellar bands are presently not available at these wavelengths.’ [22], p. 229.
3. Astronomical observations
One year after publication of the  absorption spectrum in a neon matrix, an article appeared reporting astronomical observations of two new DIBs at wavelengths close to the two strongest bands we had measured. The authors suggested that the interstellar bands, at 9632 and 9577 Å , are due to
  based on a comparison with our laboratory data [23]. For this to be the case the 9645 Å laboratory band would need to have a matrix shift of 13 Å relative to the gas phase in order to coincide with the interstellar feature. The absorption at 9583 Å would also be shifted, but only by 6 Å . The comparison is illustrated by figure 3, where the two sets of data are shown. The larger width of the laboratory spectrum is due to solid state effects common to matrix spectroscopy, namely, phonon broadening and site-structure.
Figure 3.
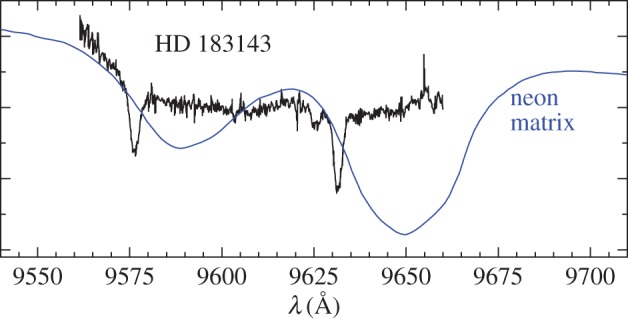
Electronic spectrum of  recorded in a neon matrix (blue) compared to astronomical observations (black) [24]. The laboratory spectrum shows the two strongest features of the lowest energy transition, assigned as
  in D5d symmetry, located at 9645 and 9583 Å . The narrower astronomical spectrum from observations towards HD 183143 has band maxima at 9632 and 9577 Å . The astronomical spectrum shown from [24] is of higher signal-to-noise ratio than the original observations from [23].
Subsequently, a number of articles appeared in astronomical journals, first proving that the two DIBs in question were indeed interstellar [25], then reporting observations towards different stars [24,26,27]. In addition to the strongest absorption bands in the neon matrix spectrum, DIBs which would coincide with the two weaker  bands at 9431 and 9375 Å (figure 2) were searched for without success or a definite conclusion because of the uncertainty in predicting the gas-phase absorption wavelength based on matrix data [26]. All the articles pointed out that a definite conclusion about
  as the carrier requires a gas-phase spectrum.
4. Methods for gas-phase spectroscopy
Measurement of the gas-phase spectrum of  under conditions prevailing in the interstellar environment posed a significant experimental challenge. In space, the vibrational and rotational degrees of freedom of molecules are equilibrated through collisions with hydrogen and temperatures in the diffuse clouds are believed to be in the range 30–100 K [9]. The well-established molecular beam technique provides efficient cooling of the rotational degrees of freedom; however, due to the limited number of collisions during the expansion, relaxation of all the vibrations is not usually achieved for large systems.
We adopted the same strategy to cool the internal degrees of freedom of the ions in the laboratory as occurs in the interstellar medium: collisional relaxation. This could be achieved by storing the ions in a cryogenic radiofrequency trap. The ions are confined using an inhomogeneous radiofrequency field [28] and cooled via inelastic collisions with helium buffer gas which is in equilibrium with the temperature of the trap walls. The trap is mounted onto the second stage of a closed-cycle helium cryostat, reaching a temperature of 4 K. Whereas in the diffuse clouds, there is a collision of a molecule with a hydrogen atom around once every year, collision rates (and therefore cooling) are significantly higher in the laboratory owing to the ability to control the number density of the helium buffer gas. The first version of the ion trap instrument is shown in figure 4.
Figure 4.

Schematic of the experimental set-up used for gas-phase spectroscopy. Ions are produced by electron bombardment of the neutral gas, transmitted through a quadrupole mass filter and injected into a cryogenic 22-pole radiofrequency ion trap. Here, they interact with high number density helium buffer gas and laser radiation for a certain time period after which the trap contents are extracted and mass analysed.
We were able to demonstrate internal cooling of polyatomic ions by measurement of their electronic absorption spectra. One particularly clear example of this is given by the diacetylene cation, HC4H+. Comparison of the spectrum obtained in our ion trapping [29] apparatus with that from an earlier measurement of emission in a supersonic jet [30] indicates the advantages of the former method. Whereas the supersonic expansion method results in efficient rotational cooling, easily to a few kelvin, the vibrational degrees of freedom have not been relaxed to such a temperature. This can be seen by the presence of hot bands, manifested as sequence transitions, around the origin band. In the ion trap experiment (figure 5), the hot bands are absent and the internal temperature can be determined from the relative intensities of the rotational lines recorded at higher resolution as the inset shows.
Figure 5.

Gas-phase electronic spectrum of the diacetylene cation, HC4H+. The absence of hot bands around the origin band indicates that the vibrational degrees of freedom have been relaxed. The 20 K rotational temperature is obtained from simulations of the band profile (inset). The spectrum was measured using the ‘action’ spectroscopy scheme shown on the right. The red arrow indicates the electronic transition of interest, while the blue arrow represents the UV radiation used to fragment the ion following electronic excitation. The spectrum was recorded by monitoring the C4H+ mass channel.
As direct absorption measurements with merely a few thousand ions in the trap are not possible, the electronic spectrum of HC4H+ (figure 5) is an ‘action’ spectrum. In this multi-photon scheme, one laser is used to excite the transition of interest, in this case  , and a second (fixed frequency) UV laser is used to dissociate the electronically excited HC4H+, producing C4H+. This photofragment is then extracted from the trap, mass-selected and counted. The spectrum is obtained by monitoring the fragmentation yield, or C4H+ counts, as function of the laser wavelength. This was the approach successfully used on a number of astrophysically interesting ions including the polyacetylenes, HC2nH+
n=2−8 [31], and most recently of protonated polycyclic aromatic hydrocarbon ions. Among the later was protonated coronene,
, and a second (fixed frequency) UV laser is used to dissociate the electronically excited HC4H+, producing C4H+. This photofragment is then extracted from the trap, mass-selected and counted. The spectrum is obtained by monitoring the fragmentation yield, or C4H+ counts, as function of the laser wavelength. This was the approach successfully used on a number of astrophysically interesting ions including the polyacetylenes, HC2nH+
n=2−8 [31], and most recently of protonated polycyclic aromatic hydrocarbon ions. Among the later was protonated coronene,  , for which the origin band of the lowest energy electronic transition lies in the visible [32]. This absorption, as well as those of related species containing oxygen or nitrogen atoms, have now been measured in the gas phase and do not correspond to any of the known DIBs. Thus, although PAH ions have often been invoked as potential carriers of DIBs these results show, in addition to smaller PAH ions, that even these species with around 50 atoms can be excluded.
Such experiments on large trapped ions also show that the two colour action spectroscopy is not generally applicable for the measurement of their electronic spectra. The reason for this lies with the internal dynamics which occur in the excited electronic state following photon absorption. Internal conversion rapidly couples the electronic and nuclear motions leading to vibrationally excited ions in the ground electronic state. Such processes are found to take place on picosecond or faster time scales. Another problem is that the fragmentation rate near the threshold is exceedingly slow. This was expected to be the case for  and therefore a general method requiring the absorption of only one photon and its detection was developed [33].
This novel approach uses the electronic excitation of cold, stored ions, M+, as a means to hinder the formation of weakly bound complexes with helium, M+–He. Under conditions of low temperatures (5 K) and high number densities of helium buffer gas (1015 cm−3), it is possible to synthesize these complexes in the low-temperature trap via ternary association. However, upon irradiation with a laser tuned to a resonant absorption of M+ the number of complexes is reduced. This reduction is based on an interplay between several elementary radiative and collisional processes occurring in the trap [33] and allows the electronic transition to be measured by monitoring a depletion in the number of complexes as a function of the laser wavelength. The method was first demonstrated on the  electronic transition of
  . This ion was chosen because the ternary association rate coefficient is small and the rotational lines of the
  electronic transition are narrow and precisely known. The power of this approach is that it provides a general way to record the electronic spectra that does not depend on the dynamics of the excited state. An additional advantage is that only one laser wavelength is required. It has now also been used in the infrared and millimetre ranges by other groups.
5. Gas-phase spectroscopic measurements
With this new tool in hand, experiments to measure the absorption spectrum of  in the gas phase under similar conditions of temperature as in space were started in spring 2015. The first step required the formation of the
  –He complex. After relaxing the rotational and vibrational degrees of freedom of
  by collisions with high number density helium buffer gas at 5 K, the
  –He (and
  –He2) complexes were readily formed. It was then realized that initially the photoinduced fragmentation spectrum of
  –He may be of interest. We have used such a technique to study the electronic spectra since 1990 [34], and in the following decade predominantly infrared spectra [35]. Our first measurement in 1990 was on the
  electronic transition of
  at 30 K, and within the limited resolution of the laser (0.5 cm−1) the rotational lines of the
  –He transition lie at the same frequency as those of
  [34,36].
The photofragmentation spectrum of  –He at 6 K was recorded using a narrow band continuous wave diode laser (figure 6). The four strongest bands corresponding to those originally reported in the neon matrix study (figure 2) were measured. The origin band at 9632.7(1) Å and another strong band of similar intensity at 9577.5(1) Å were observed. The quoted wavelengths are given from the results of Gaussian fits to the experimental spectra. These coincide with the wavelengths of the two DIBs, originally detected by Foing & Ehrenfreund [23]. The rest wavelengths for the DIBs are reported as 9632.6(2) and 9577.4(2) Å after correction for stellar lines [26], and similar values were inferred in a number of other studies [12,24,25]. Furthermore, the laboratory full width at half maximum (FWHM) of these two strong bands are the same within error limits, 2.2(2)−2.5(2) Å , and similar to the astronomical FWHM of 2.85(2) Å [24]. And finally the relative absorption cross sections of the two absorption bands were determined experimentally to be around 0.8:1.0, in accord with the equivalent width (EW) of the DIBs, which are about equal. The EWs vary slightly in the various astronomical measurements and evaluations, mainly because the 9632 Å DIB is overlapped by an MgII line, but also due to the differences in physical conditions of the interstellar cloud(s) sampled towards the different stars and the profuse overlap and subsequent corrections of the telluric absorptions. The agreement with the DIB data is remarkable and shows that the 9632 and 9577 Å DIBs are due to gaseous
  .
.
Figure 6.

The gas-phase electronic spectrum recorded by fragmentation of  –He. The circles are the experimental data and the solid black lines are the results of Gaussian fits. The resulting data are listed in table 1. The intensities have been scaled by the relative absorption cross sections. The perturbation due to the presence of the helium is small such that the spectrum can be considered as that of
  for comparison with astronomical data. The solid red lines are the wavelengths of the DIBs, their width represents the uncertainty [26].
The perturbation on the electronic transition of  due to the presence of the helium atom is very small and the absorption spectrum shown in figure 6, for astronomical comparisons anyway, is the spectrum of
  . This proposition was recently quantified by measuring the fragmentation spectra of
  –Hen (n=1−3) 37. The results indicate that the origin band of
  is shifted by 0.7 Åto shorter wavelength relative to
  –He. This is less than the accuracy of the astronomical evaluations. The combined information on the wavelengths, FWHM, and relative intensities leave beyond doubt that the 9632 and 9577 Å DIBs arise by starlight absorption of the gaseous
  ion.
ion.
It should also be pointed out that the 2.2 Å FWHM of the laboratory bands is the result of internal conversion following photon absorption, corresponding to a lifetime of 2 ps of the excited electronic state. Simulation of the rotational profile of such an electronic transition for C60 shows that only at a rotational temperature above 30 K can one expect an FWHM to exceed the 2.2 Å observed experimentally at 6 K [38].
A spectroscopic aspect associated with the observed electronic spectrum of  (figure 6) which requires further clarification concerns the interpretation of the 9577.5 Å band. Our gas-phase measurements indicate that both the 9632.7 and 9577.5 Å transitions arise from a common lower level [16]. Theoretical calculations suggest that the first excited electronic state is 2Eg (in D5d) symmetry and that another state lies close by. Thus, the 9577.5 Å band may correspond to the transition to the latter state. Alternatively, the 9632.7 and 9577.5 Å bands could be due to the two spin–orbit components of the 2Eg electronic state. Whatever the case, there will be considerable vibronic coupling present, in addition to the excitation of the Jahn–Teller active vibrations leading to a complex pattern in the electronic spectrum.
6. Detection of more interstellar  bands
bands
The gas-phase spectrum shown in figure 6 indicates that the next two absorption bands of  are a factor of 3–4 weaker than the origin bands at 9632.7 and 9577.5 Å . These bands were previously searched for based on the wavelengths reported from measurement of the absorption spectrum in a neon matrix [22]. Following measurement of the gas-phase spectrum, a specific search in diffuse clouds for the absorptions at 9365.9 and 9428.5 Å was conducted [39].
New astronomical measurements were made employing a special technique to reduce the problem of telluric correction. These observations towards the reddened star HD 183143, together with concomitant periodic recording of a comparable unreddened star, led to the detection of the DIB at 9365.7 Å . The region of the laboratory absorption at 9428.5 Å was also searched, though a strong stellar emission associated with HD 183143 at this wavelength prevented observation of any weaker DIB features. However, an archival spectrum of observations towards a different star, for which the stellar emission in the 9428 Å region is absent, was examined and clearly shows a DIB at 9428.4 Å . The results of these astronomical observations are shown in figure 7.
Figure 7.

Astronomical data from observations towards HD 183143 (a) and the archive spectrum of HD 169454 (b) in the regions of the laboratory  absorptions after correction for the radial velocity of one of the two interstellar clouds. Telluric water vapour lines have been removed after division by the spectra of unreddend stars [39]. The red lines are Gaussian fits to the observed DIBs. The vertical lines show the wavelengths of the laboratory
  –He absorptions, their width represents the uncertainty. The wavelengths and widths of the DIBs are given in table 1.
The wavelengths of these two new DIBs are found to be in agreement with the laboratory values of 9428.5(1) and 9365.9(1) Å , respectively [16]. The FWHM of the DIBs are also consistent. Further agreement was found with the EWs of the astronomical data and the relative intensities of the laboratory absorptions. Thus, two more DIBs have been identified as arising from  absorptions. This puts the total number of identified DIBs at four and provides compelling evidence of the presence of this molecular ion in diffuse interstellar clouds. The astronomical and laboratory data are summarized in table 1.
Table 1.
Comparison of the four strongest  –He absorptions from gas-phase laboratory results [16] with the diffuse interstellar bands reported in [39]. The wavelengths, λ, and FWHM are from Gaussian fits to the laboratory and astronomical data. The errors quoted for the DIBs are formal fitting errors but the systematic errors are likely to be larger. The depth of the DIBs can be used as a measure of the relative intensity.
| HD 183143 |
HD 169454 |
laboratory |
||||||
|---|---|---|---|---|---|---|---|---|
| λ (Å) | FWHM (Å) | depth (%) | λ (Å) | FWHM (Å) | depth (%) | λ (Å) | FWHM (Å) | σrel |
| 9577.40 (2) | 3.30 (4) | 9.10 (5) | 9577.20 (3) | 3.50 (6) | 4.00 (6) | 9577.5 (1) | 2.5 (2) | 1 |
| — | — | — | 9428.40 (10) | 3.20 (10) | 1.20 (5) | 9428.5 (1) | 2.4 (1) | 0.3 |
| 9365.70 (2) | 2.50 (4) | 2.40 (3) | 9365.60 (10) | 2.10(20) | 0.70 (10) | 9365.9 (1) | 2.4 (1) | 0.2 |
7. Astronomical implications
The identification of  in the diffuse medium leads to the question of its interstellar abundance. In order to evaluate the column density of
  the oscillator strength for the detected transition has to be known. This was originally estimated as f=0.003−0.006 [22] in the study of the absorption spectrum in a neon matrix [22]. The main assumption underlying this reported value is that the ion current of mass-selected
  directly yields the concentration of
  in the matrix. In this way, it is assumed that there are no ion losses during deposition which may arise due to scattering or neutralization. As such it should certainly be considered as a lower limit. Two theoretical studies [40,41] report this value as a factor of 10 higher, around f=0.05, and we believe this to be more realistic. This value is for the whole electronic transition, and f(0−0) for the origin band at 9632.7 Å is estimated to be ≃0.02 based on the Franck–Condon factors of the vibrational bands (figure 6) and the relative cross sections given in table 1. Using the typical EW of 400 mÅ for the 9632 Å DIB leads to the column density,
  , of around 2×1013 cm−2. This is about an order of magnitude smaller than N(H3+), but comparable to N(CH+), both of which were observed towards HD 183143 [42].
One can use the width of the 9632 and 9577 Å DIBs as a probe of the temperature of the environment. Simulation of the rotational profile of C60 [38], and that of  will be very similar, indicating that only at temperatures above 30 K will the band be broader than that observed in the laboratory at 6 K. At this temperature, the rotational profile is around 1 Å and thus the observed 2.2 Å width corresponds to a 2 ps lifetime of the upper excited electronic state, caused by internal conversion.
The absorption bands reported from the electronic spectrum of neutral C60 [11] were searched for a number of times in diffuse clouds, with no success. From the lack of detection of bands due to C60 in the astronomical spectra an upper limit for the column density,  , was inferred [12]. This implies, based on our estimate of
  , that in the diffuse interstellar clouds the degree of ionization is over 97%.
The gas-phase electronic spectrum also provides the means to detect  in other astrophysical environments. Neutral C60 was identified for the first time in space in 2010. Cami et al. [14] reported observation of the four characteristic vibrational transitions of the highly symmetric C60 molecule in emission from a young planetary nebula. The widths of the four infrared emission bands were modelled with a temperature of 330 K. Additional transitions due to the presence of C70 were also observed. Since this first detection of neutral C60 via its infrared spectrum, the characteristic bands have been reported in several subsequent astronomical studies [43]. The assignment of astronomical observations to infrared transitions of
  , however, is considerably more difficult to unambigously prove than in the case of neutral C60. This is because
  with its lower symmetry (D5d or D3h) has many IR-active modes. The situation is further complicated because observed infrared emissions attributed to
  are broad and overlap with much stronger features in the spectrum [44]. On the other hand, the two distinct near infrared bands at 9632 and 9577 Å in the electronic spectrum provide a clear cut means to identify
  in such environments. It has been suggested that these bands are observed in protoplanetary nebula [45], though the argument for this will need further astronomical data.
The question can be posed as to the role played by other fullerene cations as carriers of DIBs. C70 has also been detected in the various nebula and thus it is expected that  is present in the diffuse interstellar medium. The electronic absorption spectrum of
  was obtained in a neon matrix in 1993 [46]. However, in contrast to
  spectrum, it is much richer in vibrational structure and comprises many bands of similar intensity. The origin band at 7988 Å is not the most intense and the band system extends over 1500 cm−1 with many overlapping vibronic transitions. Assuming that the oscillator strength is comparable to the transition of
  , the individual vibrational bands will have oscillator strengths over an order of magnitude smaller than that of the
  9632.7 Å band. Such transitions will have EWs in the mÅ range and be difficult to detect. In fact the gas-phase electronic spectrum of
  has been determined in the laboratory using
  –He in the same way as for
  , and the initial astronomical search for these transitions confirms the conclusion the corresponding DIBs will be weak, if at all detectable 47. The candidate molecules must be present in sufficient abundance and/or possess strong oscillator strengths in order to allow astronomical detection. Satisfying the latter criteria could be the charge transfer transitions of
  –M species in which an electron is transferred between the adsorbed atom, M, and the ionized fullerene cage [3]. Possibilities for the cosmically abundant atom M include Na, Mg, Fe and H. Owing to the large charge displacement, such transitions will be associated with very large oscillator strengths [3]. Measurements of such species should be possible in the laboratory using ion traps, as for
  .
.
8. Conclusion
C60 was first detected in space by its infrared emission spectrum in a young planetary nebula [14]. Since then it has also been identified a variety of stellar environments [43]. With the detection of its cation  in diffuse interstellar clouds, the means of transportation of carbon and as potential source of smaller molecules by top-down mechanism is evident. Many polar chains which are known in dense clouds could easily be produced by break up of
  /C60 in such an environment by high-energy radiation, e.g. cosmic rays. As is well known by mass spectrometry, when sufficient energy is deposited in C60/
 , sequential C2 loss occurs producing carbon chains, rings and smaller fullerenes. Nitrogen containing derivatives of this fullerene could then for example lead to the cyano polyacetylenes [48].
Authors' contributions
J.P.M. and E.K.C. wrote this review.
Competing interests
The author(s) declare that they have no competing interests.
Funding
The research in Basel was continuously supported in the last 30 years by the Swiss National Science Foundation and by the ERC Advanced Grant (ERC-AdG-ElecSpecIons: 246998) in the past five.
References
-
1.Kroto HW, Heath JR, O’Brien SC, Curl RF, Smalley RE.
1985.
 : Buckminsterfullerene. Nature
318, 162–163. ( 10.1038/318162a0) [DOI] [Google Scholar]
: Buckminsterfullerene. Nature
318, 162–163. ( 10.1038/318162a0) [DOI] [Google Scholar] - 2.Kroto HW. 1987. Chains and grains in interstellar space. In Polycyclic aromatic hydrocarbons and astrophysics (eds A Léger, L d’Hendecourt, N Boccara), pp. 197–206. Dordrecht, The Netherlands: D. Reidel Publishing Company.
- 3.Kroto HW, Jura M. 1992. Circumstellar and interstellar fullerenes and their analogues. Astron. Astrophys. 263, 275–280. [Google Scholar]
- 4.Heger ML. 1922. The spectra of certain class B stars in the regions 5630 Å–6680 Åand 3280 Å–3380 Å. Lick Obs. Bull. 10, 146–147. [Google Scholar]
- 5.Merrill PW. 1934. Unidentified interstellar lines. Pub. Astron. Soc. Pac. 46, 206–207. ( 10.1086/124460) [DOI] [Google Scholar]
- 6.Merrill PW. 1936. Stationary lines in the spectrum of the binary star Boss 6142. Astrophys. J. 83, 126–128. ( 10.1086/143707) [DOI] [Google Scholar]
- 7.Herbig GH. 1975. The diffuse interstellar bands. IV. The region 4400−6850 Å. Astrophys. J. 196, 129–160. ( 10.1086/153400) [DOI] [Google Scholar]
- 8.McCall BJ, Griffin ER. 2013. On the discovery of the diffuse interstellar bands. Proc. R. Soc. A 469, 20120604 ( 10.1098/rspa.2012.0604) [DOI] [Google Scholar]
- 9.Snow TP, McCall BJ. 2006. Diffuse atomic and molecular clouds. Annu. Rev. Astron. Astrophys. 44, 367–414. ( 10.1146/annurev.astro.43.072103.150624) [DOI] [Google Scholar]
- 10.Krätschmer W, Lamb LD, Fostiropoulos K, Huffman DR. 1990. Solid C60: a new form of carbon. Science 347, 354–358. ( 10.1038/347354a0) [DOI] [Google Scholar]
- 11.Haufler RE, Chai Y, Chibante LPF, Fraelich MR, Weisman RB, Curl RF, Smalley RE. 1991. Cold molecular beam electronic spectrum of C60 and C70. J. Chem. Phys. 95, 2197–2199. ( 10.1063/1.460968) [DOI] [Google Scholar]
- 12.Herbig GH. 2000. The search for interstellar C60. Astrophys. J. 542, 334–343. ( 10.1086/309523) [DOI] [Google Scholar]
- 13.Ehrenfreund P, Foing BH. 1997. Fullerenes in space. Adv. Space Res. 19, 1033–1042. ( 10.1016/S0273-1177(97)00350-5) [DOI] [PubMed] [Google Scholar]
- 14.Cami J, Bernard-Salas J, Peeters E, Malek SE. 2010. Detection of C60 and C70 in a young planetary nebula. Science 329, 1180–1182. ( 10.1126/science.1192035) [DOI] [PubMed] [Google Scholar]
- 15.Sellgren K, Werner MW, Ingalls JG, Smith JDT, Carleton TM, Joblin C. 2010. C60 in reflection nebulae. Astrophys. J. Lett. 722, L54–L57. ( 10.1088/2041-8205/722/1/L54) [DOI] [Google Scholar]
-
16.Campbell EK, Holz M, Gerlich D, Maier JP.
2015.
Laboratory confirmation of
 as the carrier of two diffuse interstellar bands. Nature
523, 322–323. ( 10.1038/nature14566) [DOI] [PubMed] [Google Scholar]
as the carrier of two diffuse interstellar bands. Nature
523, 322–323. ( 10.1038/nature14566) [DOI] [PubMed] [Google Scholar] - 17.Forney D, Jakobi M, Maier JP. 1989. Absorption spectroscopy of mass-selected ions in neon matrices. J. Chem. Phys. 90, 600–601. ( 10.1063/1.456461) [DOI] [Google Scholar]
- 18.Nagarajan R, Maier JP. 2010. Electronic spectra of carbon chains and derivatives. Int. Rev. Phys. Chem. 29, 521–554. ( 10.1080/0144235X.2010.490328) [DOI] [Google Scholar]
- 19.Rice CA, Maier JP. 2013. Electronic spectroscopy of carbon chains and rings of astrophysical interest. J. Phys. Chem. 117, 559–566. ( 10.1021/jp401833m) [DOI] [PubMed] [Google Scholar]
- 20.Kato T, Kodama T, Shida T, Nakagawa T, Matsui Y, Suzuki S, Shiromaru H, Yamauchi K, Achiba Y. 1991. Electronic absorption spectra of the radical anions and cations of fullerenes: C60 and C70. Chem. Phys. Lett. 180, 446–450. ( 10.1016/0009-2614(91)85147-O) [DOI] [Google Scholar]
- 21.Gasyna Z, Andrews L, Schatz PN. 1992. Near-infrared absorption spectra of C60 radical cations and anions prepared simultaneously in solid argon. J. Phys. Chem. 96, 1525–1527. ( 10.1021/j100183a005) [DOI] [Google Scholar]
-
22.Fulara J, Jakobi M, Maier JP.
1993.
Electronic and infrared spectra of
 and
and  in neon and argon matrices. Chem. Phys. Lett.
211, 227–234. ( 10.1016/0009-2614(93)85190-Y) [DOI] [Google Scholar]
in neon and argon matrices. Chem. Phys. Lett.
211, 227–234. ( 10.1016/0009-2614(93)85190-Y) [DOI] [Google Scholar] -
23.Foing BH, Ehrenfreund P.
1994.
Detection of two interstellar absorption bands coincident with spectral features of
 . Nature
369, L296–L297. ( 10.1038/369296a0) [DOI] [Google Scholar]
. Nature
369, L296–L297. ( 10.1038/369296a0) [DOI] [Google Scholar] -
24.Foing BH, Ehrenfreund P.
1997.
New evidences for interstellar
 . Astron. Astrophys. Lett.
317, L59–L62. [Google Scholar]
. Astron. Astrophys. Lett.
317, L59–L62. [Google Scholar] -
25.Galazutdinov GA, Krelowski J, Musaev FA, Ehrenfreund P, Foing BH.
2000.
On the identification of the
 interstellar features. Mon. Not. R. Astron. Soc.
317, 750–758. ( 10.1046/j.1365-8711.2000.03566.x) [DOI] [Google Scholar]
interstellar features. Mon. Not. R. Astron. Soc.
317, 750–758. ( 10.1046/j.1365-8711.2000.03566.x) [DOI] [Google Scholar] -
26.Jenniskens P, Mulas G, Porceddu I, Benvenuti P.
1997.
Diffuse interstellar bands near 9600 Å: not due to
 yet. Astron. Astrophys.
327, 337–341. [Google Scholar]
yet. Astron. Astrophys.
327, 337–341. [Google Scholar] - 27.Misawa T, Gandhi P, Hida A, Tamagawa T, Yamaguchi T. 2009. Identification of new near-infrared diffuse interstellar bands in the Orion Nebula. Astrophys. J. 700, 1988–1993. ( 10.1088/0004-637X/700/2/1988) [DOI] [Google Scholar]
- 28.Gerlich D. 1992. Inhomogeneous electrical radio frequency fields: a versatile tool for the study of processes with slow ions. In State-selected and state-to-state ion-molecule reaction dynamics: part 1. Experiment (eds C-Y Ng, M Baer, I Prigogine, SA Rice). Advances in Chemical Physics Series, vol. LXXXII, pp. 1–176. New York, NY: Wiley Interscience.
- 29.Maier JP, Chakrabarty S, Mazzotti FJ, Rice CA, Dietsche R, Walker GAH, Bohlender DA. 2011. Assignment of 5069 Å diffuse interstellar bands to HC4H+: disagreement with laboratory absorption band. Astrophys. J. Lett. 729, L20 ( 10.1088/2041-8205/729/2/L20) [DOI] [Google Scholar]
-
30.Allan M, Kloster-Jensen E, Maier JP.
1976.
Emission spectra of the radical cations of diacetylene (
 ), triacetylene (
 ), and tetraacetylene (
 ), and the lifetimes of some vibronic levels of the
  states. Chem. Phys.
17, 11–18. ( 10.1016/0301-0104(76)85002-1) [DOI] [Google Scholar]
states. Chem. Phys.
17, 11–18. ( 10.1016/0301-0104(76)85002-1) [DOI] [Google Scholar] - 31.Dzhonson A, Jochnowitz EB, Maier JP. 2007. Electronic gas-phase spectra of larger polyacetylene cations. J. Phys. Chem. A 111, 1887–1890. ( 10.1021/jp067439j) [DOI] [PubMed] [Google Scholar]
-
32.Rice CA, Hardy FX, Gause O, Maier JP.
2014.
 Electronic transition of protonated coronene at 15 K. J. Phys. Chem. Lett.
5, 942–945. ( 10.1021/jz500068r) [DOI] [PubMed] [Google Scholar]
Electronic transition of protonated coronene at 15 K. J. Phys. Chem. Lett.
5, 942–945. ( 10.1021/jz500068r) [DOI] [PubMed] [Google Scholar] - 33.Chakrabarty S, Holz M, Campbell EK, Banarjee A, Gerlich D, Maier JP. 2013. A novel method to measure electronic spectra of cold molecular ions. J. Phys. Chem. Lett. 4, 4051–4054. ( 10.1021/jz402264n) [DOI] [Google Scholar]
-
34.Bieske EJ, Soliva A, Welker MA, Maier JP.
1990.
The
 electronic spectrum of
  . J. Chem. Phys.
93, 4477–4478. ( 10.1063/1.458732) [DOI] [Google Scholar]
. J. Chem. Phys.
93, 4477–4478. ( 10.1063/1.458732) [DOI] [Google Scholar] - 35.Bieske EJ, Maier JP. 1993. Spectroscopic studies of ionic complexes and clusters. Chem. Rev. 93, 2603–2621. ( 10.1021/cr00024a002) [DOI] [Google Scholar]
-
36.Bieske EJ, Soliva AM, Friedmann A, Maier JP.
1992.
Electronic spectra of
 . J. Chem. Phys.
96, 28–34. ( 10.1063/1.462517) [DOI] [Google Scholar]
. J. Chem. Phys.
96, 28–34. ( 10.1063/1.462517) [DOI] [Google Scholar] -
37.Campbell EK, Holz M, Maier JP.
2016.
 in diffuse clouds: laboratory and astronomical comparison. Astrophys. J. Lett.
826, L4 ( 10.3847/2041-8205/826/1/L4) [DOI] [Google Scholar]
in diffuse clouds: laboratory and astronomical comparison. Astrophys. J. Lett.
826, L4 ( 10.3847/2041-8205/826/1/L4) [DOI] [Google Scholar] - 38.Edwards SA, Leach S. 1993. Simulated rotational band contours of C60 and their comparison with some of the diffuse interstellar bands. Astron. Astrophys. 272, 533–540. [Google Scholar]
-
39.Walker GAH, Bohlender D, Maier JP, Campbell EK.
2015.
Identification of more interstellar
 bands. Astrophys. J. Lett.
812, L8 ( 10.1088/2041-8205/812/1/L8) [DOI] [Google Scholar]
bands. Astrophys. J. Lett.
812, L8 ( 10.1088/2041-8205/812/1/L8) [DOI] [Google Scholar] -
40.Bendale RD, Stanton JF, Zerner MC.
1992.
Investigation of the electronic structure and spectroscopy of Jahn–Teller distorted
 . Chem. Phys. Lett.
194, 467–471. ( 10.1016/0009-2614(92)86084-U) [DOI] [Google Scholar]
. Chem. Phys. Lett.
194, 467–471. ( 10.1016/0009-2614(92)86084-U) [DOI] [Google Scholar] - 41.Tamuliene J. 2014. Electronic and vibrational spectra of C60 and its ions. Fullerenes Nanotubes Carbon Nanostruct. 23, 187–195. ( 10.1080/1536383X.2014.926330) [DOI] [Google Scholar]
-
42.McCall BJ, Hinkle KH, Geballe TR, Moriarty-Schieven GH, Evans NJ II, Kawaguchi K, Takano S, Smith VV, Oka T.
2002.
Observations of
 in the diffuse interstellar medium. Astrophys. J.
567, 391–406. ( 10.1086/338380) [DOI] [Google Scholar]
in the diffuse interstellar medium. Astrophys. J.
567, 391–406. ( 10.1086/338380) [DOI] [Google Scholar] - 43.Roberts KRG, Smith KT, Sarre PJ. 2012. Detection of C60 in embedded young stellar objects, a Herbig Ae/Be star and an unusual post-asymptotic giant branch star. Mon. Not. R. Astron. Soc. 421, 3277–3285. ( 10.1111/j.1365-2966.2012.20552.x) [DOI] [Google Scholar]
-
44.Berne O, Mulas G, Joblin CA.
2013.
Interstellar
 . Astron. Astrophys. Lett.
550, L4–L5. ( 10.1051/0004-6361/201220730) [DOI] [PMC free article] [PubMed] [Google Scholar]
. Astron. Astrophys. Lett.
550, L4–L5. ( 10.1051/0004-6361/201220730) [DOI] [PMC free article] [PubMed] [Google Scholar] -
45.Iglesias-Groth S, Esposito M.
2013.
A search for near infrared bands of the fullerene cation
 in the protoplanetary nebula IRAS 01005+7910. Astrophys. J. Lett.
776, L2–L5. ( 10.1088/2041-8205/776/1/L2) [DOI] [Google Scholar]
in the protoplanetary nebula IRAS 01005+7910. Astrophys. J. Lett.
776, L2–L5. ( 10.1088/2041-8205/776/1/L2) [DOI] [Google Scholar] -
46.Fulara J, Jakobi M, Maier JP.
1993.
Electronic spectra of the C70 molecule and
 ,
,  ions in neon matrices. Chem. Phys. Lett.
206, 203–209. ( 10.1016/0009-2614(93)85542-V) [DOI] [Google Scholar]
ions in neon matrices. Chem. Phys. Lett.
206, 203–209. ( 10.1016/0009-2614(93)85542-V) [DOI] [Google Scholar] -
47.Campbell EK, Holz M, Maier JP, Gerlich D, Walker GAH, Bohlender D.
2016.
Gas phase absorption spectroscopy of
 and
and  in a cryogenic ion trap: comparison with astronomical measurements. Astrophys. J.
822, 17 ( 10.3847/0004-637X/822/1/17) [DOI] [Google Scholar]
in a cryogenic ion trap: comparison with astronomical measurements. Astrophys. J.
822, 17 ( 10.3847/0004-637X/822/1/17) [DOI] [Google Scholar] - 48.Kroto HW. 1981. The spectra of interstellar molecules. Int. Rev. Phys. Chem. 1, 309–376. ( 10.1080/01442358109353324) [DOI] [Google Scholar]