

Abstract
Super-atom molecular orbitals are orbitals that form diffuse hydrogenic excited electronic states of fullerenes with their electron density centred at the centre of the hollow carbon cage and a significant electron density inside the cage. This is a consequence of the high symmetry and hollow structure of the molecules and distinguishes them from typical low-lying molecular Rydberg states. This review summarizes the current experimental and theoretical studies related to these exotic excited electronic states with emphasis on femtosecond photoelectron spectroscopy experiments on gas-phase fullerenes.
This article is part of the themed issue ‘Fullerenes: past, present and future, celebrating the 30th anniversary of Buckminster Fullerene’.
Keywords: fullerene, super-atom molecular orbitals, photoelectron angular distributions
1. Introduction
In the past 30 years since their discovery [1] fullerenes and, in particular, C60 have become very important model systems for studying the properties of complex molecules and nanoparticles in the gas phase. Their ease of handling combined with their high symmetry and chemical simplicity, consisting of only the element carbon, has made them attractive systems for pushing both experimental and theoretical techniques to provide a deeper understanding of the electronic and dynamical properties of matter on the nanoscale. Fullerenes also have the intriguing characteristic that, depending on the experimental circumstances, they can appear to show properties more associated with bulk matter (such as thermionic electron emission) or can appear almost atomic like [2]. In this review, we are focusing on the atomic-like nature of diffuse excited electronic states of fullerenes, known as ‘super-atom molecular orbitals’ (SAMOs). SAMOs can be considered to be similar to low-lying mixed valence/Rydberg states, often encountered in molecules; however, the hollow and highly symmetric nature of C60 provides a spherically symmetric potential with a shallow attractive region in the centre of the molecule. As a consequence of this, the wave functions of the lowest members of the lowest angular momenta Rydberg series have significant electron density inside the cage and, in contrast with typical molecular Rydberg states, the electron density is centred on the centre of the hollow cage rather than on the atomic cores that form the molecule. The associated molecular orbitals, therefore, bear a close resemblance to large, diffuse, nanometre-scale hydrogenic atomic orbitals (figure 1).
Figure 1.

Cuts in the isocontour amplitudes of the Dyson orbitals (representing the probability density of the electron that is ionized) of the s-, p- and d-SAMO states of C60. Adapted from [3].
The unusual nature of the SAMOs was first pointed out by Petek and co-workers when they used low-temperature ultrahigh-vacuum scanning tunnel microscopy (STM) to image the orbitals of C60 deposited on Cu [4]. The same group also showed the formation of nearly free electron bands when fullerenes aggregated to form a two-dimensional crystal on the metal surface, indicating that these could be interesting systems for molecular electronics applications if the excitation energy of the SAMOs could be tuned to be closer to the Fermi energy. The excited SAMOs were observed earlier in gas-phase C60 by femtosecond photoelectron spectroscopy; however, they were not specifically identified as such [5], and they have also been observed in two-photon photoemission experiments on C60 layers deposited on surfaces [6].
The STM studies have been reviewed previously [7] so here we focus on reviewing the properties of the SAMO states in isolated gas-phase molecules where there is no perturbation from the presence of a substrate. We start by briefly reviewing the experimental and theoretical techniques that have been used to obtain information about these excited states in gas-phase molecules before describing the results and finishing with a comparison of experimental photoelectron angular distributions (PADs) with calculations using a simple model potential.
2. Methods
The details of the experimental techniques have been provided in previous publications [5,8,9] and will be only briefly described here. The original studies that reported the excitation and subsequent single-photon ionization of Rydberg states in C60 were carried out with a combined linear time-of-flight photoelectron spectrometer and a time-of-flight mass spectrometer (MS) [5,10]. In these earlier studies, the angular dependence of the electron emission was not studied. The emphasis was placed on the determination of the binding energies of the higher lying members of the Rydberg series that were well resolved using 800 nm laser pulses with 1.5 ps duration. In more recent studies, the time-of-flight photoelectron spectrometer was replaced by a velocity map imaging (VMI) spectrometer, illustrated in figure 2 [8,9]. This incorporates a position-sensitive detector consisting of a set of multichannel plates followed by a phosphor screen. A CCD camera records the positions at which the electrons arrive on the phosphor screen. The electron extraction voltages are set to produce a two-dimensional projection of the emitted electron cloud on the detector [11]. The resulting images recorded by the CCD camera are inverted to obtain the initial velocity and angular distribution of the electrons using a standard algorithm, either BASEX [12], p-BASEX [13] or polar-onion peeling [14] modified to include up to the tenth Legendre polynomial in the inversion procedure. The great advantage of VMI is that it allows the simultaneous recording of the electron velocity and the PAD. The velocity scale is calibrated by recording the above-threshold ionization spectrum of Xe. The Xe photoelectron spectra also serve as a convenient calibration for the 800 nm laser power [15]. The thermal background was subtracted from the spectra [2] and the SAMO peaks were fitted with Lorentzian functions.
Figure 2.

(a) Schematic of VMI/MS apparatus. (b) Sketch of the electron/ion optics from above. (Online version in colour.)
The laser pulses were obtained from a regenerative amplified Ti : sapphire laser (ca 110 fs, 800 nm). Additional wavelengths were provided by frequency doubling or tripling the fundamental output or by using the fundamental output to pump a commercial noncollinear optical parametric amplifier (NOPA) providing a tuneable light source in the visible range. The pulse durations from the NOPA were in the range of 30–90 fs. The laser light was linearly polarized with the electric vector aligned in the vertical direction. In order to obtain a good signal to noise ratio for the SAMO peaks while minimizing the background contribution due to thermoelectronic ionization [16], the laser intensity typically was within the range 1011–1012 W cm−2.
A number of theoretical approaches for the calculation of the SAMO states have been reported. The early studies focused on characterizing the one-electron SAMO orbitals using plane-wave density functional theory (DFT) electronic structure calculations [4,7,17]. A many-body perturbative approach provided evidence for the enhanced stability and long lifetime of the states [18]. Time-dependent (TD)-DFT calculations were described in detail by Mignolet et al. [19]. In these studies, the electronic structure of the 500 lowest excited states of neutral C60 was computed at the TD-DFT/B3LYP/6+31 G(d) [8] or the TD-DFT/CAM-B3LYP/6-31(+)G(d)-Bq(6-31(6+)G(d)) level [19].
Photoelectron spectra, including PADs, were computed by first calculating the Dyson orbitals. The Dyson orbitals are one-particle orbitals computed as the overlap between the neutral and cation many electron wave functions and represent the probability amplitude of the electron that is ionized [19,20]. They are used to calculate photoionization intensities and PADs, as described in detail for C60 by Mignolet et al. [19]. For C60 the SAMO Dyson orbitals, figure 1, are very similar to the SAMO molecular orbitals. As the SAMO and Rydberg excited states are composed of several excitations from the highest occupied molecular orbital to several SAMO and/or Rydberg orbitals, the Dyson orbitals of the SAMO and Rydberg states are thus a linear combination of the SAMO/Rydberg molecular orbitals of the same symmetry. The first band of s-SAMO states has a principal quantum number n=3, while the lowest-lying members of the p- and d-bands in these calculations, figure 1, have n=4 and 5, respectively, i.e. all wave functions of the lowest-lying SAMO states contain two radial nodes.
3. Rydberg fingerprint spectroscopy
The term ‘Rydberg fingerprint spectroscopy’ was coined by Weber and co-workers [21]. It refers to the sensitivity of molecular Rydberg electron-binding energies to the molecular structure and has been proposed as an analytical technique to distinguish molecular isomers [22] and also as a means of probing isomerization dynamics on a femtosecond time scale [23]. It was based on the observation that well-resolved peaks could be observed in the photoelectron spectra of organic molecules corresponding to low-lying molecular Rydberg states when using femtosecond lasers for photoionization [24,25]. At the same time, similar observations were made for the excitation and ionization of Rydberg states of C60 [5]. For large molecules like C60 where there is a very high density of excited electronic and vibrational states, the excitation is practically independent of the wavelength of the laser used for excitation. An additional advantage of the technique is that, due to the similarity of the Rydberg and cation potential energy surfaces, the final photoionization step is essentially vibration conserving and the method can work with molecules that have a high initial vibrational energy. A simplified, schematic illustration of the technique is shown in figure 3. High-lying excited states are very rapidly and efficiently coupled to other excited states, aided by the high degree of vibrational excitation within the molecule and the transient electric field of the laser pulse [26]. This allows the population of a wide band of excited states with varying amounts of vibrational energy, including excited valence states, the fullerene SAMO states and higher lying Rydberg states. Within the same laser pulse, once excited, these SAMO/Rydberg states can be single-photon ionized by the absorption of an additional photon.
Figure 3.

Schematicillustration of the ‘Rydberg fingerprint spectroscopy’ technique used to probe the SAMO and Rydberg excited states of the fullerenes. (a) Multiphoton excitation is followed by very efficient state couplings and population of a wide range of excited states with varying amounts of vibrational energy. Narrow lines indicate vibrational excitation. Only the first two members of the s-series and the first members of the p- and d-series are shown for clarity. The single-headed arrows indicate two different photon energies. The double-headed arrows indicate the photoelectron kinetic energies. Note that the photon energy corresponding to the red arrow is too low to ionize the lowest-lying s-state. (b) (i) Schematic of the photoelectron spectra that would be observed for the two-photon energies shown in (a). (ii) Corresponding electron binding energies. (Online version in colour.)
As the excited states are incoherently populated, the final step in the photoionization process can be considered to be a single-photon ionization from the excited states. In this case, the PAD for a random orientation of the molecule can be described as [27]:
| 3.1 |
where β is an anisotropy parameter, taking values within the range −1 to +2, and P2(cos θ) is the second order Legendre polynomial.
4. Fullerene super-atom molecular orbitals and Rydberg states
Owing to the unique hollow nature of the fullerenes, the low-lying members of Rydberg series, the SAMOs, which are the main interest here, are rather unusual in having the electron density centred on the centre of the hollow molecular core rather than on the atomic constituents of the molecule. SAMOs arise because of the hollow core potential defined by the spherical C60 carbon cage. The overall potential is a sum of two contributions: the deep Coulomb wells centred on each carbon atom and a shallow attractive potential induced by the long-range-dispersion interactions between electrons localized on two opposite sides of the cage. While only the former is sufficient to define the σ and π molecular orbitals, the shallow attractive potential within the cage is essential for correctly describing SAMO states. In particular, the lowest-lying members of the s- and p-series are considered to have significant electron density within the centre of the molecule (figure 1). The s-SAMO has even been identified theoretically for anions [28,29]. This clearly distinguishes the SAMO states from the higher lying Rydberg states. The unique nature of the potential was discussed in analogy with image potential states of graphene in the context of the STM experiments carried out by the Petek group [7]. For states with higher principal quantum numbers, the electron density is almost entirely outside the carbon cage and the electron-binding energies and properties more closely resemble those of conventional Rydberg series.
A series of VMI images and the corresponding angle-integrated photoelectron spectra, plotted as a function of electron-binding energy (Ebind=hν−Ekin, where hν is the photon energy) rather than photoelectron kinetic energy (Ekin), are shown in figure 4 for C60 for three different laser wavelengths. The peak structure is clearly seen in all three spectra with the most prominent peak (assigned to the excitation of the first s-SAMO band) being indicated by the dashed lines. The positions of the maxima of the first p- and d-bands and the second s-band are indicated by the vertical dashed lines. This series of measurements nicely illustrates the non-resonant nature of the excitation of the SAMO states as well as the single-photon ionization from the excited states that underpins the analysis and interpretation.
Figure 4.

VMI images and the corresponding angle-integrated photoelectron spectra for C60, plotted as a function of electron-binding energy, for ionization with three different laser wavelengths: 545 nm, 514 nm and 400 nm (top to bottom).
The experimentally measured electron-binding energies are given in table 1 along with calculated values. The plane-wave DFT values [4] were only given with respect to the calculated lowest unoccupied molecular orbital value and are, therefore, just given as energy differences between the states. The experimental assignment was based partly on the calculated binding energies and partly on the PADs. The experimental angular distributions were extracted by dividing the VMI data into angular segments and integrating the relevant peak intensity in each case [9]. An example for the peak at a binding energy of 1.9 eV, indicated in figure 4, is shown in figure 5a for the 400 nm data with the data fitted to equation (3.1).
Table 1.
Comparison of experimental and theoretical binding energies for the C60 SAMOs.
| SAMO-binding energy (eV) |
|||||||
|---|---|---|---|---|---|---|---|
| s | Δsp | p | Δpd | d | Δds′ | s′ | |
| experiment [8] | 1.90 ± 0.01 | 0.43 | 1.47 ± 0.02 | 0.45 | 1.02 ± 0.01 | 0.15 | 0.87 ± 0.02 |
| B3LYP 6-31+G(d) [8] | 2.15 | 0.89 | 1.26 | 0.49 | 0.77 | −0.01 | 0.78 |
| CAM-B3LYP 6-31+ | 2.35 | 0.89–0.63 | 1.46–1.72 | 0.11–0.58 | 1.14–1.35 | 0 | 1.14–1.35 |
| G(D)+diff. [19] | |||||||
| plane-wave DFT [4] | 0.66 | 0.55 | −0.1 | ||||
| model potential | 1.9 | 0.3 | 1.6 | 0.6 | 1.0 | 0.1 | 0.9 |
Figure 5.

(a) Photoelectron angular distribution for the peak in the 400 nm photoelectron spectrum shown in figure 4 at a binding energy of 1.9 eV. (b) Value of the anisotropy parameter, β, as a function of photoelectron kinetic energyfor the peaks assigned to the first (red, triangles) and second (black, squares) members of the s-SAMO series. The data point corresponding to the plot in (a) appears at an electron kinetic energy of Ekin= hν−Ebind=3.1−1.9=1.2 eV. (Online version in colour.)
The value extracted for the anisotropy parameter, β, for the peaks with binding energies of 1.9±0.1 eV shows that the outgoing electron is very close to a pure p-wave. This is expected for single-photon ionization from an s-state with zero orbital angular momentum (ℓ=0). An additional confirmation of the assignment of this peak is obtained when considering the extracted value of β as a function of the kinetic energy of the outgoing electron. For ionization from an s-state, the value of β should not change as the electron kinetic energy changes because the outgoing wave should always be a p-wave. The non-resonant excitation mechanism for the SAMOs allows us to test this by simply changing the wavelength of the laser. The results are shown in figure 5b for the peaks assigned to the first (binding energy 1.9 eV) and second (binding energy 0.87 eV) members of the s-series. The situation is less straightforward for ionization from states with higher values of the orbital angular momentum because more than one exit channel is possible (Δℓ=±1) and the value will change as the velocity of the outgoing electron changes. In this situation, comparison with the theoretical results helps to assign the peaks.
A comparison of the experimentally determined anisotropy parameters and TD-DFT calculations for the B3LYP/6+31 G(d) and CAM-B3LYP/6-31(+)G(d)-Bq(6-31(6+)G(d)) level is shown in figure 6 for C60, and C70 with additional experimental values for C82 and Sc3N@C80.
Figure 6.

Photoelectron angular distributions (PADs) for (a) s-states, (b) p-states and (c) d-states, characterized by the fitted β-value for experiments on C60 (circles), C70 (squares), C82 (up-triangles) and Sc3N@C80 (down-triangles). The full lines show the calculated β-values for C60 and C70 at the B3LYP/6-31+G(d) level [8]. The dashed lines are C60 CAM-B3LYP/6-31(+)G(d)-Bq(6-31(6+)G(d)) results [19]. Adapted from [9].
Both the experimental and theoretical results are almost identical for C60 and C70. Although the CAM-B3LYP/6-31(+)G(d)-Bq(6-31(6+)G(d)) calculations provide better agreement with the experimental binding energies, the B3LYP/6-31+G(d) angular distributions are in better agreement with the measurements for the p-SAMO. The d-SAMO measurements lie in between the two sets of calculations. The predicted angular distributions are very sensitive to the diffusivity of the wave functions. The angular distributions for ionization from the p-SAMO are significantly shifted for low kinetic energies for C82 and Sc3N@C80 with respect to C60 and C70. A smaller, but still significant, shift is also seen for the d-SAMO.
Photoelectron spectra parallel and perpendicular to the laser polarization direction are compared for the different fullerenes whose β-values are plotted in figure 6, obtained at a wavelength of around 500 nm, in figure 7. The binding energies of the SAMO peaks are very similar in all cases (table 1). It should be noted that the ionization energies of the higher fullerenes and the endohedral species are all significantly lower than that of C60; therefore, the excitation energy of the SAMO states must be lowered by the same amount. The main difference in the photoelectron spectra is a broadening of the peak widths and a more prominent double-peak structure for the p-SAMO band due to the decreasing symmetry as the size of the fullerene cage is increased. The peak structure for the first s- and p-SAMO bands is almost completely smeared out for the endohedral fullerene, Sc3N@C80 [9].
Figure 7.
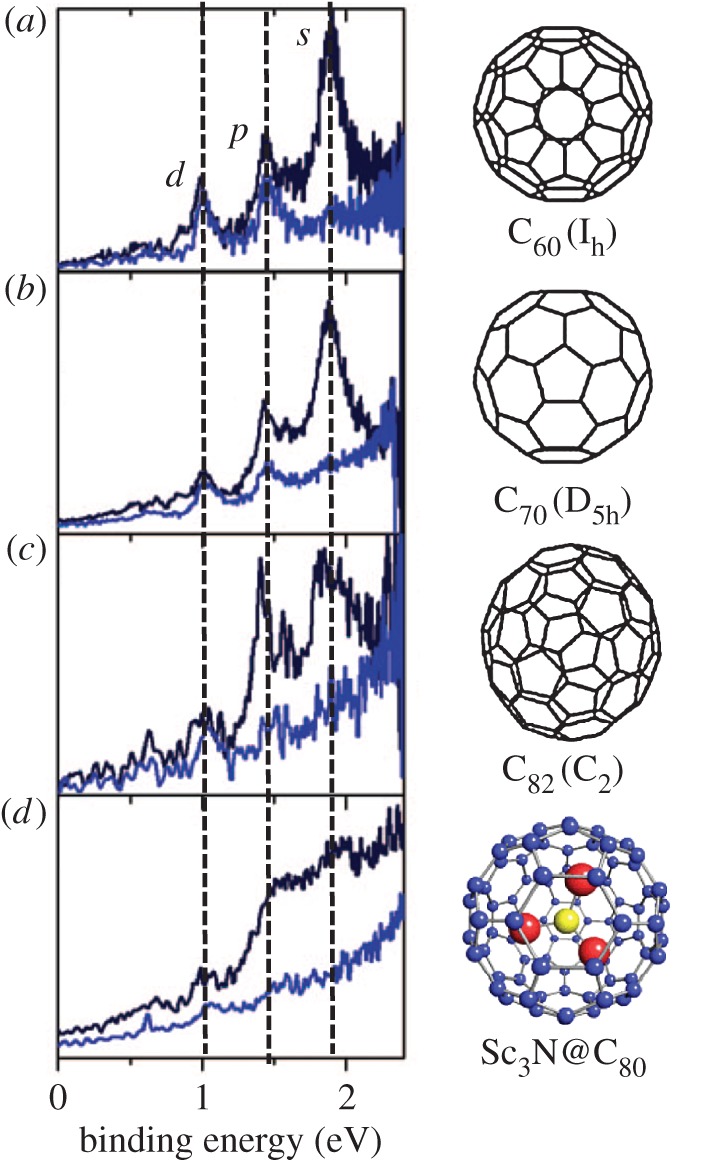
Photoelectron spectra parallel (black) and perpendicular (blue) to the laser polarizationdirection of (a) C60, 500 nm, 4.7 TW cm−2, (b) C70, 520 nm, 2.9 TW cm−2, (c) C82, 519 nm, 2.8 TW cm−2 and (d) Sc3N@C80, 506 nm, 4.1 TW cm−2. Adapted from [9].
The TD-DFT calculations also provided insight into the dominance of peaks corresponding to single-photon ionization of SAMO bands over valence bands in the photoelectron spectra. The photoionization widths between the excited electronic states and the ground state of the cation were computed using a basis of orthogonalized plane waves to describe the wave function of the ionized electron [19]. The photoionization width was computed for each state taking into account the random orientation of the C60 molecule with respect to the electric field. The calculated photoionization width is proportional to the photoionization rate and directly related to the photoionization cross section (it does not refer to the width of the peaks in the photoelectron spectrum).
For the relatively low photoelectron kinetic energies that are studied in these experiments, the photoionization cross section from the SAMO states is orders of magnitude larger than ionization from the non-SAMO valence excited states (figure 8). The calculated photoionization widths can be converted to photoionization lifetimes of the order of femtoseconds for the SAMO states but picoseconds to nanoseconds for the non-SAMO states [19]. This explains very clearly why the SAMO peaks are so dominant for ionization with visible laser wavelengths. Even though the non-SAMO states will be populated, the probability that they will be single-photon ionized on the time scale of the laser pulse (50–100 fs) is vanishingly small.
Figure 8.

Photoionization widths, Γ, plotted on a logarithmic scale versus the photoelectron kineticenergy. Adapted from [19]. (Online version in colour.)
The ratio of calculated photoionization widths has been compared to relative experimental ionization intensities [3]. The results, figure 9, show very good agreement between the theoretical ratios and the experimental ratios for photon energies where the same number of photons can access both states. Outside these regions, the s-band can be accessed by one less photon than the higher states. In this case, the s-band intensity would be expected to be significantly higher than the higher lying states and the measured ratios are correspondingly higher. This is not accounted for by the calculations because they do not include the population mechanism but simply assume that all states are populated with the same probability. The results are quite remarkable because they are implying that this assumption (at least for the SAMO population) does hold as long as the photon order needed to energetically access the states is the same. What is apparent is that the TD-DFT calculations are, with good accuracy, able to predict the photoionization probability in addition to the PAD as a function of kinetic energy as discussed earlier.
Figure 9.

Comparisonof relative experimental SAMO peak intensities (squares) and the theoretical photoionization width ratios of SAMO states plotted as a function of laser photon energy. (a) Ratio of the s- and p-peak intensities. (b) Ratio of the s- and d-peak intensities. Theoretical values shown by dashed lines (ratio of average values calculated for each band). The numbers in each panel indicate the number of photons needed to access the s and the p- or d-SAMO states, respectively. Adapted from [3]. (Online version in colour.)
The rapid decrease in the photoionization width of the SAMO/Rydberg states as the photoelectron kinetic energy increases (figure 8) also explains why the higher-lying Rydberg states that were the subject of the early studies [5,10,30] are much less prominent for excitation with visible light. Excitation and ionization with 800 nm, 1.5 ps bandwidth limited picosecond laser pulses produced photoelectron spectra where the higher-lying states were well resolved [5]. The assignment of the peaks was made by comparing the experimental binding energies with the numerical solution of the Schrödinger equation using a simple model potential [5]. In the light of the detail that can be obtained in angle-resolved studies using VMI, it would be useful to revisit the study of the higher-lying Rydberg states using picosecond ionization.
5. Photoelectron angular distributions from a phenomenological potential
There have been a number of attempts to model C60 and X@C60 photoionization using simple, spherically symmetric, phenomenological potentials [5,7,31–33]. Usually in these studies, the depth, width and shape of the potential well are adjusted to fit the experimental results and has often taken the form of a quasi-square well potential at the position of the carbon atoms. For example, the model used to calculate the Rydberg binding energies, discussed above, was based on a quasi-rectangular potential at the position of the carbon atoms, published by Puska & Nieminen [34]. In order to illustrate the use of a phenomenological potential to model the PADs, we have adapted a phenomenological square well potential to have a shallow attractive core and adjusted the parameters to obtain good agreement with the SAMO-binding energies. We then numerically solve the Schrödinger potential within Matlab, following the method described by Falkensteiner et al. [35]. The eigenenergies for the lowest s-, p- and d-SAMO states are given in table 1. The corresponding wave functions were then used to calculate the PADs following the method described by Bartels et al. [36].
The anisotropy parameter, β, is defined within the Bethe–Cooper–Zare theory [27,37] as
 |
5.1 |
where
| 5.2 |
are the radial matrix elements, ψi and ψf are the initial and final state wave functions, ℓ is the orbital angular momentum quantum number of the initial state, r is the radial coordinate and δ=δ+−δ− is the difference of the Coulomb phase shifts of the final state wave functions ψf, defined by their asymptotic behaviour [38]. The subscripts ± refer to the ℓ+1 and ℓ−1 transitions.
 |
5.3 |
Here, k is the magnitude of the wavevector and σ is the Coulomb phase (=argΓ(1+ℓ−i/k)) [39].
The results for the lowest s-, p- and d-SAMOs are shown in figure 10. The spherically symmetric radial potential used for the calculations is shown as an inset in the lower plot. The results are rather close to the experimental values. It should be noted that although quasi-square well potentials have been used to model fullerene photoionization they are not very physical and a cusp-like potential has been suggested as a more realistic approximation [40]. The good agreement achieved here gives some confidence that a systematic comparison of the eigenenergies and angular distributions obtained from the available model potentials should provide a means of selecting the most appropriate and generally applicable model potential for C60.
Figure 10.
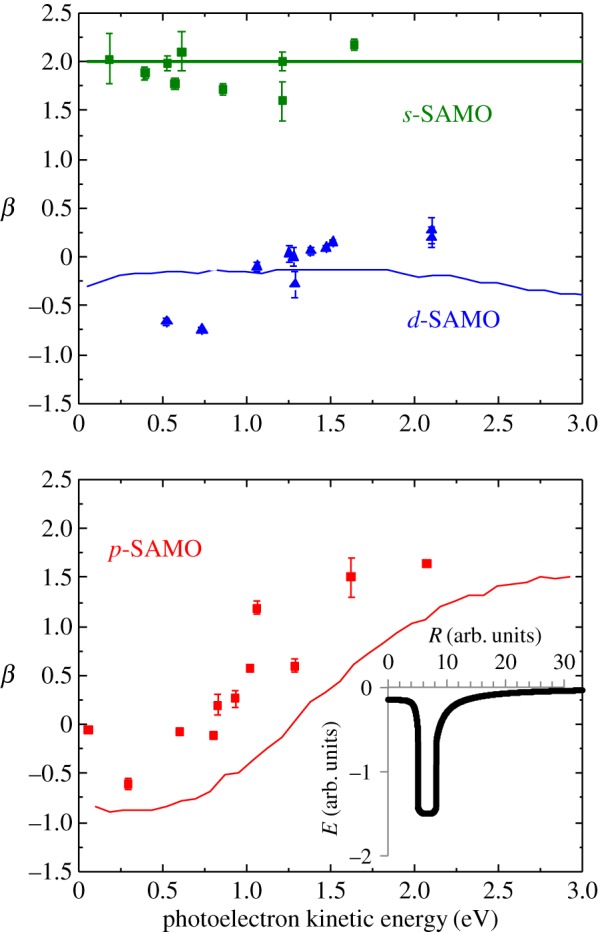
Comparison of experimental anisotropy parameters, β, with calculations using the simple phenomenological model potential shown in the inset. Note that the β value for the s-SAMO is independent of the potential, which can be seen from equation (5.1). (Online version in colour.)
6. Conclusion
Thirty years after their discovery, fullerenes continue to be valuable model systems and serve to develop new experimental and theoretical techniques that can probe ever more complex systems. The fullerene SAMO excited electronic states that have been reviewed here provide large, challenging systems for quantum chemistry but, most attractively, the high symmetry and nature of the C60 molecules also make it possible to apply much simpler models that provide more intuitive insight into the factors that influence the binding energy of these interesting states. The increased knowledge of the properties of these states may lead to design of materials for specific charge transport applications and may also play an important role in understanding the chemistry of neutral and charged fullerenes in space.
Acknowledgements
We thank Françoise Remacle and Benoit Mignolet (University of Liège) for supplying the TD-DFT calculations and for many fruitful discussions. We also thank James Thompson, Gordon Henderson and Katarzyna Sokó for their contributions to the experiments.
Authors' contributions
J.O.J. and E.B. carried out the experimental work, analysed the experimental data and contributed to data interpretation. J.O.J. solved the Schrödinger equation for the simple jellium model and calculated the corresponding PADs. E.E.B.C. designed the experiments, supervised the research, contributed to data interpretation and wrote the manuscript.
Competing interests
We declare we have no competing interests.
Funding
Funding from the Leverhulme Trust (RPF-298 ‘PES of hollow nanomaterials’) is gratefully acknowledged. E.E.B.C. acknowledges the support of a JILA Visiting Fellowship. J.O.J. is a Royal Society of Edinburgh/BP Trust research fellow.
References
- 1.Kroto HW, Heath JR, O’Brien SC, Curl RF, Smalley RE. 1985. C60: Buckminsterfullerene. Nature 318, 162–163. ( 10.1038/318162a0) [DOI] [Google Scholar]
- 2.Johansson JO, Campbell EEB. 2013. Probing excited electronic states and ionisation mechanisms of fullerenes. Chem. Soc. Rev. 42, 5661–5671. ( 10.1039/C3CS60047E) [DOI] [PubMed] [Google Scholar]
- 3.Bohl E, Sokół KP, Mignolet B, Thompson JOF, Johansson JO, Remacle F, Campbell EEB. 2015. Relative photoionization cross sections of super-atom molecular orbitals (SAMOs) in C60. J. Phys. Chem. A 119, 11 504–11 508. ( 10.1021/acs.jpca.5b10339) [DOI] [PubMed] [Google Scholar]
- 4.Feng M, Zhao J, Petek H. 2008. Atom like, hollow-core-bound molecular orbitals of C60. Science 320, 359–362. ( 10.1126/science.1155866) [DOI] [PubMed] [Google Scholar]
- 5.Boyle M, Hoffmann K, Schulz CP, Hertel IV, Levine RD, Campbell EEB. 2001. Excitation of Rydberg series in C60. Phys. Rev. Lett. 87, 273401 ( 10.1103/PhysRevLett.87.273401) [DOI] [PubMed] [Google Scholar]
- 6.Dutton GJ, Dougherty DB, Jin W, Reutt-Robey JE, Robey SW. 2011. Superatom orbitals of C60 on Ag(111): two-photon photoemission and scanning tunneling spectroscopy. Phys. Rev. B 84, 195435 ( 10.1103/PhysRevB.84.195435) [DOI] [Google Scholar]
- 7.Feng M, Zhao J, Huang T, Zhu X, Petek H. 2011. The electronic properties of superatom states of hollow molecules. Acc. Chem. Res. 44, 360–368. ( 10.1021/ar1001445) [DOI] [PubMed] [Google Scholar]
- 8.Johansson JO, Henderson G, Remacle F, Campbell EEB. 2012. Angular-resolved photoelectron spectroscopy of superatom orbitals of fullerenes. Phys. Rev. Lett. 108, 173401 ( 10.1103/PhysRevLett.108.173401) [DOI] [PubMed] [Google Scholar]
- 9.Johansson JO, Bohl E, Henderson GG, Mignolet B, Dennis TJS, Remacle F, Campbell EEB. 2013. Hot electron production and diffuse excited states in C70, C82, and Sc3N@C80 characterized by angular-resolved photoelectron spectroscopy. J. Chem. Phys. 139, 084309 ( 10.1063/1.4818987) [DOI] [PubMed] [Google Scholar]
- 10.Boyle M, Laarmann T, Hoffmann K, Hedén M, Campbell EEB, Schulz CP, Hertel IV. 2005. Excitation dynamics of Rydberg states in C60. Eur. Phys. J. D 36, 339–351. ( 10.1140/epjd/e2005-00281-7) [DOI] [Google Scholar]
- 11.Bordas C, Paulig F, Helm H, Huestis DL. 1996. Photoelectron imaging spectrometry: principle and inversion method. Rev. Sci. Instrum. 67, 2257–2268. ( 10.1063/1.1147044) [DOI] [Google Scholar]
- 12.Dribinski V, Ossadtchi A, Mandelshtam VA, Reisler H. 2002. Reconstruction of Abel-transformable images: the Gaussian basis-set expansion Abel transform method. Rev. Sci. Instrum. 73, 2634–2642. ( 10.1063/1.1482156) [DOI] [Google Scholar]
- 13.Garcia GA, Nahon L, Powis I. 2004. Two-dimensional charged particle image inversion using a polar basis function expansion. Rev. Sci. Instrum. 75, 4989–4996. ( 10.1063/1.1807578) [DOI] [Google Scholar]
- 14.Roberts GM, Nixon JL, Lecointre J, Wrede E, Verlet JRR. 2009. Toward real-time charged-particle image reconstruction using polar onion-peeling. Rev. Sci. Instrum. 80, 053104 ( 10.1063/1.3126527) [DOI] [PubMed] [Google Scholar]
- 15.Schyja V, Lang T, Helm H. 1998. Channel switching in above-threshold ionization of xenon. Phys. Rev. A 57, 3692–3697. ( 10.1103/PhysRevA.57.3692) [DOI] [Google Scholar]
- 16.Johansson JO, Fedor J, Goto M, Kjellberg M, Stenfalk J, Henderson GG, Campbell EEB, Hansen K. 2012. Anisotropic hot electron emission from fullerenes. J. Chem. Phys. 136, 164301 ( 10.1063/1.4704828) [DOI] [PubMed] [Google Scholar]
- 17.Zhao J, Feng M, Yang J, Petek H. 2009. The superatom states of fullerenes and their hybridization into the nearly free electron bands of fullerites. ACS Nano 3, 853–864. ( 10.1021/nn800834k) [DOI] [PubMed] [Google Scholar]
- 18.Pavlyukh Y, Berakdar J. 2011. Communication: superatom molecular orbitals: new types of long-lived electronic states. J. Chem. Phys. 135, 201103 ( 10.1063/1.3665089) [DOI] [PubMed] [Google Scholar]
- 19.Mignolet B, Johansson JO, Campbell EEB, Remacle F. 2013. Probing rapidly-ionizing super-atom molecular orbtals in C60: a computational and femtosecond photoelectron spectroscopy study. ChemPhysChem 14, 3332–3340. ( 10.1002/cphc.201300585) [DOI] [PubMed] [Google Scholar]
- 20.Dauth M, Wiessner M, Feyer V, Schöll A, Puschnig P, Reinert F, Kümmel S. 2014. Angle resolved photoemission from organic semiconductors: orbital imaging beyond the molecular orbital interpretation. New J. Phys. 16, 103005 ( 10.1088/1367-2630/16/10/103005) [DOI] [Google Scholar]
- 21.Gosselin JL, Weber PM. 2005. Rydberg fingerprint spectroscopy: a new spectroscopic tool with local and global structural sensitivity. J. Phys. Chem. A 109, 4899–4904. ( 10.1021/jp0503866) [DOI] [PubMed] [Google Scholar]
- 22.Cardoza JD, Rudakov FM, Hansen N, Weber PM. 2008. Identification of isomeric hydrocarbons by Rydberg photoelectron spectroscopy. J. Electron Spectrosc. Relat. Phenom. 165, 5–10. ( 10.1016/j.elspec.2008.06.003) [DOI] [Google Scholar]
- 23.Rudakov FM, Weber PM. 2012. Ultrafast structural and isomerization dynamics in the Rydberg-exited quadricyclane: norbornadiene system. J. Chem. Phys. 136, 134303 ( 10.1063/1.3697472) [DOI] [PubMed] [Google Scholar]
- 24.Schick CP, Weber PM. 2001. Ultrafast dynamics in the three-photon, double-resonance ionization of phenol via the S2 electronic state. J. Phys. Chem. A 105, 3735–3740. ( 10.1021/jp003304g) [DOI] [Google Scholar]
- 25.Tsubouchi M, Whitaker BJ, Wang L, Kohguchi H, Suzuki T. 2001. Photoelectron imaging on time-dependent molecular alignment created by a femtosecond laser pulse. Phys. Rev. Lett. 86, 4500–4503. ( 10.1103/PhysRevLett.86.4500) [DOI] [PubMed] [Google Scholar]
- 26.Zhang GP, Sun X, George TF. 2003. Laser-induced ultrafast dynamics in C60. Phys. Rev. B 68, 165410 ( 10.1103/PhysRevB.68.165410) [DOI] [Google Scholar]
- 27.Cooper J, Zare RN. 1968. Angular distribution of photoelectrons. J. Chem. Phys. 48, 942–943. ( 10.1063/1.1668742) [DOI] [Google Scholar]
- 28.Klaiman S, Gromov EV, Cederbaum LS. 2013. Extreme correlation effects in the elusive bound spectrum of C−60. J. Phys. Chem. Lett. 4, 3319–3324. ( 10.1021/jz4018514) [DOI] [Google Scholar]
- 29.Voora VK, Cederbaum LS, Jordan KD. 2013. Existence of a correlation bound s-type anion state of C60. J. Phys. Chem. Lett. 4, 849–853. ( 10.1021/jz400195s) [DOI] [PubMed] [Google Scholar]
- 30.Boyle M, Hedén M, Schulz CP, Campbell EEB, Hertel IV. 2004. Two-color pump-probe study and internal-energy dependence of Rydberg-state excitation in C60. Phys. Rev. A 70, 051201 ( 10.1103/PhysRevA.70.051201) [DOI] [Google Scholar]
- 31.Dolmatov VK, Baltenkov AS, Connerade JP, Manson ST. 2004. Structure and photoionization of confined atoms. Rad. Phys. Chem. 70, 417–433. ( 10.1016/j.radphyschem.2003.12.024) [DOI] [Google Scholar]
- 32.Madjet ME, ChakrabortY HS, Rost JM, Manson ST. 2008. Photoionization of C60: a model study. J. Phys. B 41, 105101 ( 10.1088/0953-4075/41/10/105101) [DOI] [Google Scholar]
- 33.Phaneuf RA. et al. 2013. Probing confinement resonances by photoionizing Xe inside a C60 molecular cage. Phys. Rev. A 88, 053402 ( 10.1103/PhysRevA.88.053402) [DOI] [Google Scholar]
- 34.Puska MJ, Nieminen RM. 1993. Photoabsorption of atoms inside C60. Phys. Rev. A 47, 1181–1186. ( 10.1103/PhysRevA.47.1181) [DOI] [PubMed] [Google Scholar]
- 35.Falkensteiner P, Grosse H, Schöberl F, Hertel P. 1985. Solving the Schrödinger equation for bound states. Comput. Phys. Commun. 34, 287–293. ( 10.1016/0010-4655(85)90005-0) [DOI] [Google Scholar]
- 36.Bartels C, Hock C, Huwer J, Kuhnen R, Schwöbel J, von Issendorff B. 2009. Probing the angular momentum character of the valence orbitals of free sodium nanoclusters. Science 323, 1323–1327. ( 10.1126/science.1168080) [DOI] [PubMed] [Google Scholar]
- 37.Cooper J, Zare RN. 1968. Erratum: angular distribution of photoelectrons. J. Chem. Phys. 49, 4252 ( 10.1063/1.1670761) [DOI] [Google Scholar]
- 38.Bethe HA, Salpeter EE. 1977. Quantum mechanics of one- and two-electron atoms. New York, NY: Plenum Publishing Corporation. [Google Scholar]
- 39.Hertel IV, Schulz CP. 2015. Atoms, molecules and optical physics 1. Berlin, Germany: Springer. [Google Scholar]
- 40.Baltenkov AS, Manson ST, Msezane AZ. 2015. Jellium model potentials for the C60 molecule and the photoionization of endohedral atoms, A@C60. J. Phys. B 48, 185103 ( 10.1088/0953-4075/48/18/185103) [DOI] [Google Scholar]