

Abstract
Fire and herbivory are the two consumers of above-ground biomass globally. They have contrasting impacts as they differ in terms of selectivity and temporal occurrence. Here, we integrate continental-scale data on fire and herbivory in Africa to explore (i) how environmental drivers constrain these two consumers and (ii) the degree to which each consumer affects the other. Environments conducive to mammalian herbivory are not necessarily the same as those conducive to fire, although their spheres of influence do overlap—especially in grassy ecosystems which are known for their frequent fires and abundance of large mammalian herbivores. Interactions between fire and herbivory can be competitive, facultative or antagonistic, and we explore this with reference to the potential for alternative ecosystem states. Although fire removes orders of magnitude more biomass than herbivory their methane emissions are very similar, and in the past, herbivores probably emitted more methane than fire. We contrast the type of herbivory and fire in different ecosystems to define ‘consumer-realms’.
This article is part of the themed issue ‘Tropical grassy biomes: linking ecology, human use and conservation’.
Keywords: fire–grazer interactions, savannah determinants, greenhouse gas emissions
1. Introduction
Fire and herbivory are globally important consumers of above-ground biomass, but their impacts and extent vary greatly depending on the ecosystem. In some environments, fire and/or herbivory dominate the respiration flux of carbon to the atmosphere, whereas in others microbial decomposition is the dominant pathway. Even in systems where relatively little carbon is consumed the ecological impacts of these disturbances can be profound [1]. The local impacts of fire and herbivory are well described [2,3] but their roles as agents in the earth system are still being elaborated [4,5].
The patterns of fire and herbivory on the globe today are heavily influenced by current and past human activities. Human impacts on fire are pervasive [6], altering the extent of fire [7], and also its seasonal patterns [8]. Archibald [9] estimated that over 20% of the globe is currently burning in a fire regime largely controlled by human activities. Similarly, many indigenous herbivore species have gone extinct or have been locally extirpated [10,11]. These have sometimes been replaced by livestock, which represent a very different suite of functional traits from the original herbivore community [12].
The advent in the 1980s of remotely sensed information on fire enabled a global perspective on current patterns of fire and the relationship between fire, climate and vegetation. This helped reduce uncertainties in the carbon cycle [13,14] and illuminated the role of fire in driving community assembly [15–17]. These data have also challenged our understanding of the environmental controls of fire [18] and of patterns of fire in deep time [19]. It has been demonstrated how feedback between fire and fire-prone grassy vegetation maintain open ecosystems across large areas of the globe which could be forest [20–22]—i.e. the vegetation in these areas is determined not by climate alone, but by interactions between climate, soils and the top-down influence of fire. Process-based global fire models, which simulate fire behaviour in response to weather and fuels now exist and can be implemented in dynamic global vegetation models (DGVMs) [23]. This allows us to explore how the global fire–vegetation system will respond [24] and has responded to [25,26] environmental change.
It is not currently possible to measure herbivory from space, and this represents a gap in our ability to describe the earth system [27]. Although spatial data have so far been absent, the degree to which herbivore consumers control global patterns of vegetation has been keenly debated [28–30]. It is likely that the global loss of large mammal fauna in the Pleistocene had cascading effects on ecosystems, altering vegetation and increasing the amount of fire [5,31,32]. Lehmann et al. [33] suggest that the differences in savannah extent between South America, Australia and Africa might be explained by the lack of large herbivores in the first two continents. It is certainly true that savannah vegetation extends far lower along the rainfall gradient in Africa [34] and that herbivores have been shown to play a role in keeping these systems open [35–38].
Bond [30] suggested that globally there are regions that are more likely to be fire controlled (black world), herbivore controlled (brown world) or resource controlled (green world), using evidence from DGVMs and when they depart from observed vegetation. He proposed that the degree to which resources, fires or herbivores control vegetation would depend on climate and soils—identifying Whitakers ‘ecosystems uncertain’ as areas where climate is not the dominant control and suggesting that within these areas herbivores dominate in higher-nutrient conditions, and fire in lower-nutrient conditions. From a biogeochemical perspective, McNaughton [1] suggested similar environmentally driven distinctions in the pathways for redistributing carbon to the atmosphere—with herbivory fluxes dominating in nutrient-rich environments.
It is important to view both fire and herbivory as multivariate phenomena. Just as net primary productivity (NPP) is not sufficient for characterizing vegetation globally, fire extent and biomass of herbivores are not sufficient for characterizing its two consumers. Fires vary in terms of their intensity, return time, size, season and type (crown, ground, surface). Herbivores vary in terms of their forage (grass, browse, fruit), body size, gut type, water requirements, social systems, and evolutionary history. All of these will determine the herbivory/fire regime that is apparent in a certain environment [12,39], and the impact of these consumers on the environment.
Here, we summarize current knowledge on the characteristics, constraints and impacts of herbivory and fire in grassy ecosystems. We then integrate spatial data on current fire regimes [39,40] with spatial data on current [41] and past [12] herbivory in Africa (there are no spatial data on past fire). We describe the patterns of consumption across key environmental gradients in order to elucidate their various constraints and the extent to which they compete or enable each other in different conditions. We expect that the biogeochemical and ecological impacts of fire and herbivory should change across these gradients as the types of herbivores and fire regimes change, and as the susceptibility of the biota to these disturbances changes. We gather available data to test this idea—in particular, the idea that fire-controlled and herbivore-controlled ecosystems might represent alternative stable states. We contrast their biogeochemical impacts (in terms of carbon consumed and methane emitted) against their ecological impacts. We focus on mammalian herbivores for which we have quantitative data, but we discuss invertebrates—particularly termites—where we can.
2. Contrasting fire and herbivory
Although fundamentally different (fire is a physical process and herbivory a biological one) these two disturbances are both controlled by and control vegetation, and they interact on evolutionary and ecological timescales (table 1). Fire is stochastic—ultimately constrained by the frequency and location of ignition events. However, it can respond immediately to changed environmental conditions. By contrast, herbivory is constrained by demographic and evolutionary processes, and it can take time for herbivory regimes to equilibrate with novel environmental drivers. Unlike fire, herbivory is relatively constant from day to day. As fire and herbivory both remove above-ground biomass, they clearly compete—but interactions of herbivores with fire can be more complex than this [42]: fire can increase both the availability and the quality of forage available to certain herbivores [43–45]. Fire and herbivory are both amenable to manipulation by people, and the human impacts on fire and herbivory regimes globally have reverberated through diverse ecosystems, altering trophic structures and reassembling ecological communities [5,6,46,47].
Table 1.
Contrasting fire and herbivory as consumers.
| fire | herbivory | |
|---|---|---|
| process | physical | biological |
| occurrence in time | stochastic from day to day strong seasonal dynamics |
persistent from day to day and over the season annual–decadal dynamics |
| occurrence in space | uniform—removing heterogeneity at landscape scales (depending on the size and intensity of the fire) | patchy—creating heterogeneity at landscape scales (depending on the size and selectivity of the herbivore) |
| selectivity | selects for dry fuel with a high C : N ratio and a low bulk density | selects for moist forage with a low C : N ratio and a high bulk density |
| key requirements | continuity in space—without this fires will go out (intense fires with high wind speeds can handle less continuous fuel beds) |
continuity in time—without this herbivores will die (larger herbivores or those with high body fat can survive longer periods of forage limitation) |
| other requirements | an ignition source | a source of drinking water |
| impacts on woody structure | reduces tree cover | grazing alone increases tree cover browsing alone decreases tree cover |
| impacts on grassland structure | promotes homogeneous tall-grass communities | promotes heterogeneous short-grass communities |
| dry matter intake | depends on fire size and intensity (which in turn depend on fuel amount and dryness) | depends on herbivore size and gut type (which in turn depend on forage quality) |
| methane emissions | 4× lower than herbivory on average (impacted by fuel moisture) |
4× higher than fire on average (impacted by herbivore size and gut type) |
| nitrogen cycling | volatilization  deposition deposition |
deposition  volatilization volatilization |
| phosphorus cycling | increases availability in the short term some P lost in particulate matter |
increases availability in the short term P recycles in available forms |
One key way in which fire and herbivory differ is their selectivity. Fire has often been characterized as the ultimate non-selective herbivore [48,49]. In fact, the ideal fuel/forage for fires and herbivores are different [50], as anyone who has seen a fire delicately picking its way through a moist fuel-bed would agree. For herbivores, high-quality forage represents green leaf material with a low C : N ratio and a high bulk density (biomass concentration [51–53]). Given these constraints, herbivores will be more/less selective depending on their body size and gut type (figure 1a). For fires, a high-quality forage (flammable fuel) is very dry, has a low bulk density and a high C : N ratio [60]. Fires can be highly selective (only burn dry fine fuels) or less selective (also burn wet material and coarse woody fuels) depending on the fire intensity (figure 1b). Finally, fires require continuity in space (a disconnected fuel bed will put out a fire) whereas mammalian herbivores can handle discontinuities in space, but require a certain amount of continuity in time in order to maintain populations (table 1). Invertebrate grasshoppers/caterpillars are subject to similar forage quality constraints as mammalian herbivores, but unlike mammals they show strong seasonal dynamics. Termites (especially those in the genus Macrotermes, which frequently dominate in savannahs) tend to be more similar to fire in their forage selectivity and principally take dead/dry material [61].
Figure 1.

The characteristics of fire and herbivory alter their behaviour and impacts. Forage selectivity decreases with body size and non-ruminant gut type for herbivores (a) and decreases with fire intensity for fires (b). Selectivity is quantified as the degree to which herbivores are attracted by high-quality forage (data from [54]) and the percentage of available fuel that is burned by a fire (data from [55]). By contrast, methane emission factors (grams of methane per kilogram consumed) increase with body mass and ruminant gut-type ((c), data from [56]) and decrease with fire intensity ((d), data from [57,58], fuel moisture is a strong driver of fire intensity [59]).
3. Environmental controls of fire and herbivory
Given this understanding of the differences between fire and herbivory, we can develop expectations on the environmental conditions which should promote each consumer. Current theory suggests that fire is limited by fuel amount in low-rainfall systems, and fuel ‘availability’ in high-rainfall systems (i.e. the fuel is too wet), so that intermediate rainfall systems have the most fire [62,63]. This is corroborated at global scales—with area burned reaching a maximum at approximately 1000 mm mean annual precipitation (MAP) [19,64]. Temperature can influence this pattern by increasing fuel availability in wet systems and decreasing fuel amount in dry systems [65]. Rainfall seasonality can affect this pattern by increasing fuel availability in wet systems (figure 2a).
Figure 2.

(a,b) Expected environmental constraints of fire and herbivory. While both are expected to show a unimodal response to rainfall, they are impacted in different ways by high temperatures, soil fertility and inter-annual variability in rainfall.
One expects similar constraints on herbivory, where low-rainfall areas lack the biomass to support high herbivore numbers, but in high-rainfall areas the forage is of very low quality or too high above the ground for animals to use it (unavailable). Soil fertility should impact this pattern by improving forage quality in high-rainfall systems, thus increasing the realm where mammalian herbivory can be an important consumer [66] (figure 2b). Moreover, inter-annual variability in rainfall should act to reduce herbivore numbers below what would be expected for that system—because herbivores, unlike fire, are constrained by demographic processes [67].
Thus, we expect both fire and herbivory to have unimodal responses to rainfall (figure 2). However, because herbivory is more constrained by soil nutrients and fire by fuel connectivity we expect some divergence in their distributions—with herbivores dominating in low-rainfall high-nutrient areas (where forage is patchily distributed but often edible), and fire dominating in higher rainfall low-nutrient environments (where forage is plentiful and widespread, but with very high C : N ratios) [68,69].
This general pattern is complicated because the ‘intermediate rainfall’ region described above also happens to be dominated by grasses, which are highly flammable, decompose slowly and regrow lost biomass quickly [70]. When these fuels are replaced by understory forbs and shade-tolerant grasses the extent of fire declines [71,72]. Thus, the particular plant functional types present can affect the probability that fuels will ignite and can expand the regions where fire is an important consumer. Likewise with herbivory, for the same environmental conditions the type of forage available will certainly impact the degree to which this is consumed by herbivores, and this is not always directly controlled by rainfall/soils, but can be a consequence of feedback between herbivores and their forage plants [51,73,74]. Thus, to a certain extent, herbivores and fire can be said to construct their own environments [1].
4. Interactions between fire and mammalian herbivory in grassy systems
These two consumers can interact directly (fires have been known to kill herbivores), but generally they influence each other via their effects on vegetation structure (in the short term) and vegetation composition (over longer timescales) [75].
(a). Fire and grazers
Fire competes for available fuel with grazers, but is the inferior competitor: confined to the dry season it can only consume the productivity that remains after continuous grazing offtake throughout the growing season. In the short term, grazer presence therefore alters vegetation structure to the detriment of fire. By contrast, fire can alter vegetation structure to benefit grazers: the nitrogen-rich green regrowth after fire during the dry season is an important resource helping grazers to survive until the next rains [76]. Sometimes this new regrowth does not occur until the next rain event. Here, the interaction becomes competitive: an extensive fire would deplete reserve forage at a critical point in the seasonal cycle [77].
The long-term effect of grazing via grass community composition is negative for fire: flammable grasses tend to grow tall, resprout vigorously from stored reserves and allocate resources to accumulating large above-ground biomass [70]. They are often particularly sensitive to repeated defoliation from heavy grazing [78,79]. The grazing-tolerant grasses that replace these are much less flammable, with very low aerial cover [80]. Continuous high grazer numbers can therefore reduce flammable grasses in an ecosystem [75]. Similarly, positive feedback between fire and flammable grasses can prevent the spread of short-grass communities: large frequent fires disperse animals throughout the burn and relieve grazing pressure on any one point in the landscape [81–83]. This allows grazing-sensitive tall grasses to maintain their competitive dominance [82,84] and in turn promotes more fire. Fire thus acts to maintain its preferred habitat through reducing heterogeneity of grazing and preventing short-grass communities from developing.
(b). Fire and browsers
Large browsers such as elephant open up closed-canopies to allow grasses (and fire) to penetrate [85]; and browsers of all sizes maintain high herbaceous fuel loads by preventing recruitment and establishment of mature trees [86–88]. Reciprocally, browsing can be promoted by intense fires as they top-kill woody plants [89–91] so frequent fires keep forage within browse height [45]. These reciprocal impacts have been formalized by Van Langevelde [92].
The longer-term interaction between fire and browsers via effects on woody species composition has not been investigated but is probably neutral. Fire and browsing certainly select for very different woody functional traits [93,94] but fire-adapted species are not necessarily less palatable than browser-adapted species, and in fact, are often preferred by browsers [95]. One further complication is that many browsers appear to avoid the tall grasslands promoted by fires: black rhino and impala presence is higher in short-grazed environments [96]. If so then there might be some negative impacts of fire on browsing via impacts on grassland structure (and positive interactions between grazers and browsers).
(c). Expected consequences of these interactions
The expected effect of grazer numbers on fire extent is clearly negative, but this response is unlikely to be linear. Fire spread is a percolation process and there should be thresholds of grazer activity where fire suddenly drops out of an ecosystem [97]. The exact threshold would depend on rainfall with more grazers (or different types of grazers [98]) required to exclude fire in more productive systems.
The effect of fire on herbivore numbers must, of necessity, be via demographics: altering fecundity or mortality. In the short term, changes in the quantity and quality of forage after a fire event affect critical dry-season forage resources—influencing survival of both grazers and browsers [99–101]. The longer-term consequences of fire-driven changes in grass community composition for grazers are complex. Modelling work suggests that grazing lawns can increase both fecundity and yearling survival by providing high-quality food resources throughout the growing season [102, pg. 251]; [103]. If so, fire would negatively influence grazer numbers by preventing the spread of grazing lawns [83]. However, while the tall bunch grasslands promoted by fire are not preferred forage for most grazers [75,104], they can potentially reduce mortality in times of drought when other food sources are depleted [105]. Thus, the ideal balance of tall grasslands versus short-grazed grasslands for grazer performance is not known.
Overall, therefore, we expect (i) positive effects of browsers on fire through controlling woody encroachment but (ii) complex responses of browsers to fire, with fire keeping woody forage within browse height, but potentially reducing its total amount and promoting less-desirable tall grass habitat, (iii) strong negative responses of fire to grazers due to both strong competition for available fuel as well as negative associations between the grass traits associated with grazing tolerance and flammability and (iv) complex responses of grazers to fires—depending not only on the spatial pattern and frequency of fire, but the environmental conditions and the genetic composition of the grass sward (potential for grazing lawn development [106]).
5. Evidence for multiple stable states through grazing–fire interactions
Most previous assessments of regime shifts and alternative stable states in relation to fire and herbivory have focused on the tree layer: Van Langevelde [92] modelled the role of fire intensity mediated by grass biomass on the probability of canopy closure and fire exclusion (grass biomass being positively and negatively affected by browsers and grazers, respectively). However, in this model grazing, browsing and fire frequency were external parameters. From our discussion mentioned above, there is sufficient evidence to suppose that fire and herbivory do in fact interact, and that each consumer can act to either promote or exclude the other.
The expected outcomes of these interactions support the idea that fire and grazer ecosystems could be alternative states [34]. Given that (i) grazing promotes the spread of short-grass patches and bare ground [82,84,107,108], (ii) fire impedes the spread of short grass [82,83] and (iii) there is a threshold proportion of short grass at which fire is excluded [109], one can expect hysteresis in the system (figure 3). Short-grass areas increase with grazer density, but increase more slowly in a system where fires occur. Once a threshold proportion of short-grass is reached, fire drops out, and the system switches quickly to a grazer-dominated system with a large proportion of short-grass. At this point, it would take a substantial reduction in grazing pressure to reduce the proportion of short grass to the point that fire could start to spread again. Theoretically then, fire and grazer ecosystems could represent alternative stable states.
Figure 3.
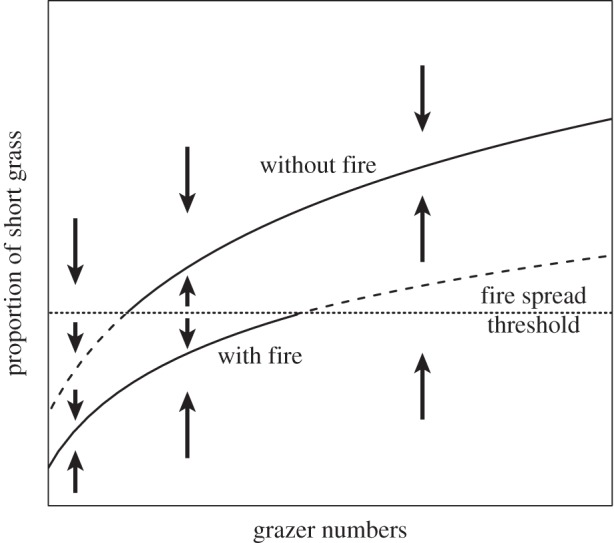
Indicating the possibility of a hysteresis driving the distinction between a herbivore (grazer)-dominated ecosystem state and a fire-dominated state. Modified from the example for shallow lakes from [110]. With fire in the system, grazers have less impact on grassland structure, and more of the landscape remains tall-grass able to carry a fire. It takes more animals to switch fire off than it does to allow fire to re-emerge as a strong consumer. This dynamic depends on the strong threshold response of fire spread observed in field data and expected from theory [97]. In this model, grazer numbers are independent of both the proportion of short grass and the presence of fire—an assumption that is unlikely to be realistic.
Complexity arises because the number of grazers is not an independent driver in the system (see [110] for a discussion of this requirement). As discussed above, grazer population dynamics are probably affected by both the proportion of short grass in a system and the presence of fire. If the spread of short-grass patches reduces grazer performance, [111] figure 3 would be insufficient to describe the system.
Long-term datasets to test these ideas are rare. The best quantified example comes from the Serengeti: rinderpest kept wildebeest numbers very low for the first half of the twentieth century [37,112] resulting in a system which burned extensively and frequently. After the elimination of rinderpest, the extensive fires did not prevent wildebeest numbers from increasing (i.e. apparently neutral effect of fire on these herbivores). At some point, however, increased grazer numbers did appear to drive a rapid reduction in fire [113], which has persisted to present. Currently, about 40% of the Serengeti National Park burns each year, compared with the estimates of 70–80% in the 1960s. These observed data fit with patterns in figure 3, but a true test of the theory would involve reducing wildebeest numbers again and seeing whether fire remains low.
6. Equating fire and herbivory biogeochemically
Fire and herbivory offer two alternative pathways for carbon release to the atmosphere (a third being decomposition by microbes). For herbivores, the amount of biomass consumed depends on the total number of animals, and the sizes and feeding efficiencies of these animals: larger animals and ruminants eat less per kilogram of body mass than small animals and non-ruminants [114]. For fire, the amount of biomass consumed depends on the total burned area, as well as the intensity of the fire and the fire return time [115]. More intense fires consume more biomass per square kilometre burned.
Animals emit about four times as much methane (CH4) per unit of dry matter consumed as fire does, respiring under lower oxygen conditions than most fires burn (figure 1c,d). Therefore, replacing herbivory with fire in an ecosystem (or vice versa) can have large impacts on greenhouse gas emissions. Moreover, larger herbivores emit more CH4 per kilogram dry matter consumed, and ruminants generally emit more than double the CH4 of non-ruminants (figure 1c [56]). This opens options for changing the type, but not the total biomass of herbivory as a method to manage carbon emissions [56]. Similarly, smouldering fires burning through green vegetation emit three to six times as much CH4 as flaming combustion in dry fuels (figure 1d [57]), and altering the season of burning has also been suggested as a climate mitigation option [116]. Consequently, spatial patterns of CH4 emissions by fire and herbivores depend on both the amount and type of these consumers (figure 1; electronic supplementary material, figures S2 and S3).
Both fires and herbivory increase availability of nutrients, which would otherwise be tied up in biomass [1], and they both also redistribute nutrients laterally—sometimes between the terrestrial and ocean ecosystems [117,118]. Within an ecosystem, herbivory is generally more efficient at recycling nutrients than fire, where phosphorus and nitrogen are lost in ash and by volatilization, respectively [75,119,120].
Clearly then, although fire and herbivory can be equated in terms of how much carbon they consume (dry matter intake per year), their differential ecosystem impacts (both biogeochemically and ecologically) make it important to understand the full consequences of changes the relative dominance of these consumers over time and space. Africa presents an opportunity to explore how the relative extent and abundance of fire and herbivores—and thus their interactive effects and influences on biogeochemical cycling—change along environmental gradients.
7. Material and methods
(a). Data acquisition and study region
Data on fire and herbivory were produced at quarter degree (0.5° × 0.5°) resolution for sub-Saharan Africa. Median area burned, maximum fire size, fire radiative power and fire season were quantified using methods in [39]. The distribution of cattle, sheep and goats from [41] were degraded to 0.5° × 0.5° from their original 1 km resolution by taking the median value. To account for the continued presence of indigenous wildlife in most African ecosystems (albeit in drastically reduced numbers) we used the data from [12]—recalculated to quarter degree resolution—as an index of potential herbivore numbers. We then reduced these values based on (i) conservation status, (ii) human footprint index [121] and (iii) area converted to cropland. See the electronic supplementary material for a full description of the methods for deriving current day herbivory. In practice, livestock dominated the current herbivory signal and account for 90% of current biomass. Although we have no spatial information on past fire we used the Hempson [12] data on past herbivory for comparison where appropriate. Information on body mass, gut type, forage preference, etc. was compiled for each herbivore species (indigenous and livestock).
The TRMM data product [122] was used to calculate MAP. The FAO Harmonised World Soil Database [123] nutrient availability index incorporates the effects of soil texture, soil organic carbon, pH and total exchangeable bases and ranges from 1 (high nutrients) to 4 (low nutrients). For ease of visualization, we normalized this index to a value between 0 and 1 (with 0 being low nutrients). The MODIS NPP data product MOD17A3 (degraded from 1 km to 0.5° × 0.5°) was used to quantify proportion of NPP consumed by fire and herbivory. As this is a remotely sensed product, its values are already somewhat influenced by herbivory offtake throughout the year. See the electronic supplementary material for a detailed evaluation of global NPP products and discussion on continental-scale soil nutrient data.
(b). Dry matter consumption and methane emissions
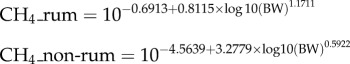
Dry matter consumed and methane emitted by wildfires were quantified using the data and methods from the GFED4.1 database [124] (http://www.falw.vu/~gwerf/GFED/GFED4). This dataset uses a modified Tier 2 methodology: quantifying area burned from remotely sensed data, modelling available biomass using the CASA model and estimating combustion completeness and emission factors from look-up tables for different vegetation types. We averaged the 0.25° data to 0.5°. Herbivore dry matter consumption was estimated using the standard IPCC approach [125] (eqn 10.18a, p. 10.22):
where DMI = dry matter intake in kg day−1, BW is live body weight in kilograms and NEma is the estimated net energy concentration of diet in MJ kg−1. We used a default value of 6 for NEma.
Methane emissions were calculated from the equations in [56]. These equations were produced by fitting two allometric equations (one for ruminants and one for non-ruminants) to a dataset of more than 100 records from 42 different wildlife species spanning bodysizes from approximately 3 kg to more than 3 tons.
 |
To produce a total DMI and CH4 emission for each pixel (currently and in the past), the species specific DMI and methane emitted per year were calculated separately, multiplied by the calculated number of individuals in each pixel, and summed across herbivores, or across functional types as appropriate. See the electronic supplementary material for discussion on the accuracy of these methods compared with other estimates.
(c). Analyses
All statistical analyses were performed in the R statistical computing software v. 3.2.3. Environmental patterns of fire and herbivory were assessed by calculating the median herbivore biomass and area burned across 50 mm rainfall bands. These were plotted against rainfall and a loess smoothing line fitted through these points. To distinguish regions in MAP–soil nutrient space where fire versus herbivory dominate consumption, we identified all points where DMI_H > DMI_F, plotted these against MAP and nutrients and fit a density plot to these points. We did the same with all points where DMI_F > DMI_H. We calculated the ratio of DMI_H to DMI_F and fit a multiple linear regression to the logged data with MAP, soil nutrients and their interaction as predictors. We used the diptest package in R to test for bimodalities in the proportion of consumption, which occurs by fire versus herbivory in different rainfall bands.
We chose a very simple method for identifying consumer realms. From the raw data on percentage burned and kg herbivores, we divided the data pixels into (i) green world: where both burned area and total herbivore biomass are less than the median value for all points, (ii) brown world: where herbivore biomass but not burned area is greater than the median value, (iii) black world: where burned area but not herbivore biomass is greater than the median value and (iv) fire-herbivory world: where both burned area and herbivory are greater than the median value. This classification simply identifies regions where fire and herbivory are more/less than one would expect on average and is not an indication of differences in dry matter consumption (which is considered elsewhere).
8. Analysis of herbivory and fire in Africa
(a). Environmental constraints
As expected, mammalian herbivory and fire separate out along a rainfall gradient (figure 4a). Current herbivory peaks at approximately 670 mm MAP and current fire at approximately 990 mm MAP. Before indigenous herbivores were replaced by cattle, bulk feeders extended herbivory into higher rainfall areas than cattle can currently [12] but even in the past herbivore biomass peaked at approximately 690 mm rainfall (figure 4a).
Figure 4.

Fire and herbivory plotted against mean annual rainfall across Africa. Data points represent the median value per 50 mm rainfall band. The line is a loess regression through these points. Panel (a) contrasts the biomass of herbivores against the fraction burned (note the second axis) Panels (b,c) compare the dry matter consumed and methane emitted per unit area. For herbivory, the patterns are shown for current day (solid line) and for the past with and without elephants (bottom- and top-dashed lines, respectively) for comparison. We have no information on past fire patterns.
This pattern persists when one considers dry matter consumed instead of herbivore density or burned area (figure 4b). At MAP below 590 mm, herbivores consume more biomass than fire does per unit area. After this fire quickly takes over and at its peak, at approximately 1000 mm rainfall, is consuming 25 times more biomass than herbivores (figure 4b). Even when megaherbivores such as elephants and rhinos were spread throughout Africa, biomass consumption by fire probably exceeded that of herbivores above approximately 610 mm MAR because the amount consumed by fire increases very steeply at this point. These results confirm previous observations that herbivore-adapted plants are more common at lower rainfalls, and fire-adapted plants at higher rainfalls [126]) and the classic distinction between dry (rich) savannahs and wet (poor) savannahs in Africa [1,68,69] (figure 5).
Figure 5.

Mapping (a) area burned and both (b) present and (c) past herbivore biomass. Regions of high area burned coincide roughly with high-rainfall broad-leaf savannahs and regions with high herbivory coincide roughly with lower-rainfall mixed/acacia savannahs. The past herbivory map is plotted without elephants, which overwhelm the spatial pattern. Panel (d) defines consumer realms for Africa (see Material and methods).
Although herbivore and fire consumption can approach 100% of above-ground NPP in certain regions (electronic supplementary material, figure S5), on average, the proportion of above-ground NPP consumed by fire and herbivory is much lower—ranging from approximately 10 to approximately 40 per cent depending on rainfall (table 2).
Table 2.
Percentage of NPP consumed by fire and mammalian herbivory by rainfall bands. This is reported against total NPP, so on average nearly 40% of above-ground NPP is consumed between 900 and 1200 mm MAP. There are many pixels (approx. 10% of the data points) where we estimate that consumption by fire and herbivory is approximately equal to above-ground NPP (see electronic supplementary material, figure S5 and discussion).
| 0–300 mm | 300–600 mm | 600–900 mm | 900–1200 mm | >1200 mm | |
|---|---|---|---|---|---|
| fire | 0.2 | 4.4 | 11.0 | 17.0 | 8.8 |
| herbivory | 4.1 | 5.8 | 3.4 | 1.4 | 0.5 |
| total consumption | 4.3 | 10.2 | 14.4 | 18.3 | 9.3 |
Despite clear differences in their preferred environmental conditions herbivores and fire appear to co-occur over large environmental gradients: both burned area and herbivore biomass are maintained at more than 50% of their maximum between 670 and 950 mm MAR (figures 4a and 5d), a rainfall band encompassing a large proportion of the current savannah biome in Africa. Interestingly, these high herbivory, high fire regions are currently more prevalent in northern Africa than in the south and east (figure 5d). In terms of dry matter intake, the rainfall regions where neither fire nor herbivory consumes more than 80% of the total range from 490 mm to 810 mm and above 1890 mm (figure 6a). Two questions arise from this—if one accounts for differences in soil conditions, does this region of overlap become smaller? And secondly, is this true coexistence, or, as some authors have suggested [34,96], is there evidence for alternative states—either herbivore or fire-controlled—in these regions of apparent overlap?
Figure 6.

(a) Proportional consumption by fire and mammalian herbivory consumption by herbivores and fire clearly cover different portions of the rainfall gradient but there are large regions of overlap—where neither consumer is dominant (grey areas in the above figure). (b) Results from a linear regression predicting the ratio of DMI_H/DMI_F as a function of mean annual rainfall and nutrient availability. A value of 1 means equal consumption by both consumers. Clearly, high nutrients can extend the influence of herbivores further up the rainfall gradient and low nutrients can extend the influence of fire further down the rainfall gradient.
(b). The role of soil fertility
Soil nutrients clearly affect the prevalence of fire and herbivory (figure 6b). As expected (figure 2) high soil nutrients can increase the relative consumption by herbivory at high rainfall, and low soil nutrients can increase the relative consumption by fire at low rainfall (figure 6b). At very high rainfalls (above approx. 1500 mm) neither consumer clearly dominates. These rainfalls encompass forest vegetation in Africa, where the grassy understory drops off and fire and herbivory are no longer clear competitors [33]. A multiple regression confirms that both rainfall and soil nutrients and the interaction between the two are important for predicting the ratio of dry matter consumed by herbivory versus fire (electronic supplementary material, table S2).
(c). Evidence for alternative states
On average, therefore, both fire and herbivory co-occur across wide environmental gradients. However, at a pixel level biomass is either consumed by fire or herbivory. Density plots by rainfall band of the proportion of total consumed dry matter due to herbivory indicate a bimodality from 400 to 1000 mm MAR and above 1600 mm MAR (figure 7: diptest, p-value less than 0.05; the proportion consumed by fire is the compliment of this figure as we have no data for invertebrate herbivory). The bimodality persists when one accounts for soil nutrients. However, low-soil fertility (soil nutrient index < 0.5) grid cells only had a bimodality at 400–600 mm MAR and above 1600 mm MAR. High-soil fertility (soil nutrient index > 0.5) grid cells only had a bimodality at 600–1000 mm MAR (electronic supplementary material, figure S7 and table S3).
Figure 7.

Density plots of the proportional consumption of herbivory relative to total consumption by rainfall band. A diptest identified a bimodality at 400–600 mm, 600–800 mm, 800–1000 mm and above 1600 mm MAR (marked in bold).
Therefore, currently in Africa it is far more common to have a herbivore-dominated or a fire-dominated system and over the entire environmental gradient there are very few grid cells where both fire and herbivory consume significant proportions of biomass. Whether this was also the case in the past is impossible to know. The mechanisms driving these patterns are not yet clear (figure 3), but as expected the response of burned area to grazer biomass is negative and nonlinear (electronic supplementary material, figure S8)—dropping off steeply at grazer densities from 1500 to 3000 kg km−2.
(d). Effects and realms of influence
Fire consumes six times more dry matter than herbivores do, but emits only 20% more CH4 (table 3). In the past, herbivores probably emitted more methane than fires did at a continental scale (table 3). These effects are clearly spatially distinct—with emissions and consumption by herbivores occurring predominantly in low-rainfall savannahs: below approximately 700 mm rainfall (figure 5b,c). Historical herbivory consumption was higher than today, but only due to elephants. If you exclude elephants then current herbivory has more than doubled the dry matter consumed by mammalian herbivores. Regions with high-burned area versus high herbivore biomass are about equal in extent (4.05 Mkm2 versus 4.23 Mkm2, respectively) (figure 5d) and an equivalent area (4.21 Mkm2) has above-average values of both.
Table 3.
Total dry matter consumed and CH4 emitted by fire and herbivory across Africa currently and in the past.
| current fire | current herbivory | historical herbivory | current herbivory no elephants | historical herbivory no elephants | |
|---|---|---|---|---|---|
| dry matter consumed (Tg per year) | 2309 | 376 | 438 | 372 | 150 |
| CH4 emitted (Tg per year) | 5.2 | 4.1 | 5.9 | 4.1 | 1.8 |
| herbivore biomass (Gg) | n.a. | 10.3 | 26.9 | 10 | 6.6 |
The form of fire and herbivory changes over rainfall gradients (electronic supplementary material, figures S2 and S3), and this alters the ecological effects of these consumers. Above approximately 800 mm, MAP fire return periods are annual/biennial, with regrowth rates sufficient to produce intense fires (electronic supplementary material, figure S4). As MAP decreases so do the frequency and the intensity of the fires; but browser and mixed feeder densities show a strong peak at approximately 500–700 mm rainfall (electronic supplementary material, figure S4). This aligns with empirical evidence that fires alone can control woody structure above approximately 800 mm rainfall [20,72] but that both fire and browsing are required to keep woody species suppressed at lower rainfalls [86–88,92]. It also corroborates Lehmann's [33] explanation for the differences in savannah extent across continents (electronic supplementary material, figure S4).
9. Discussion
Bond's [30] three worlds—brown, black and green—are clearly apparent regionally across Africa. They prevail under different environmental conditions. Consumption by fire and herbivory reaches a maximum (approx. 36% of above-ground NPP) between 900 and 1200 mm rainfall (table 2), so green world clearly prevails at both very low and very high rainfalls as expected. On average, there is a gradual shift from herbivore consumption to fire consumption along a rainfall–soil nutrient gradient (figure 6) but at a specific location biomass is predominantly consumed by either fire or herbivory—seldom both (figure 7). These alternative states currently occur from 400 to 1000 mm MAR. Theoretically (figure 3 and above), there is positive feedback between heavy grazing and short, lawn-grass communities which exclude fire, and there is similar feedback between frequent fire and tall, fire-prone grass communities which limit herbivory. This leads us to predict that the same ecosystem can switch from being largely fire-driven to one controlled by grazers and herbivory and vice versa. The demographic impacts of fire for different herbivores are complex however, and need to be resolved.
Whether the distinction between brown and black world was as clear in Africa in the past, before heavy stocking resulted in livestock consuming all available fuel in drier fertile systems, and before large non-ruminant herbivores were exterminated from wetter savannahs (electronic supplementary material, figure S3) is not known. Certainly, many of our large conservation areas maintain high levels of both fire and herbivory [75,127,128]. Thus, the patterns in figure 7 might be an artefact of human intervention, which maximizes herbivory at the expense of fire whenever it is possible.
Overall levels of consumption by herbivores are lower now than that in the past (table 3). However, the form of consumption has switched from predominantly elephant, which can be considered to enable fire, to small and medium-sized livestock, which often compete with fire for grassy biomass. Non-elephant herbivory has doubled in most parts of Africa below 1000 mm rainfall (table 3 and [12]). Thus drier ecosystems in Africa certainly burned more in the past, and wetter systems perhaps less—depending on how effective white rhino, buffalo and elephant were in removing fuels [129]. Moreover, although the total methane emissions from herbivory have decreased from historical levels, the amount emitted per unit biomass of animal has doubled (table 3).
The ecological effects of a shift from fire-controlled to herbivore-controlled landscapes are far-reaching. These two consumers select for contrasting traits in the woody [94] and herbaceous [70,80] flora, resulting in floristically contrasting savannahs across the African continent. Moreover, the different spatio-temporal patterns and selectivity of fire and grazing (table 1) means that they have differential impacts on woody demographics: intense fires are the most effective way to top-kill large woody individuals [130], although elephants can also achieve significant top-kill rates [131] and the combination of fires and elephants is crippling for large trees [132]. By contrast, herbivory is probably much more effective than fire in preventing establishment: seedlings have a whole growing season to become fire resistant [133], but are constantly exposed to herbivory from small browsers and mixed feeders and this represents a strong bottleneck in more arid systems with low grass cover [134]. Herbivory therefore acts at the establishment phase, both fire and herbivory in the recruitment phase, and fire (with elephants) at the mature tree phase.
Clearly, there are new insights to be gained by equating fire and herbivory in units of dry matter consumed. However, much of the complexity of their interactions and ecological effects comes from the particular form of consumption. We used area burned and herbivore biomass to define consumer realms (figure 5c), and despite the bimodalities in DMI noted above these are both currently above average over approximately one quarter of sub-Saharan Africa. One would therefore expect these systems to be impacted ecologically by both consumers: plants would need adaptations that allow them to withstand both frequent fire and repeated defoliation.
The lack of spatial data on mammalian herbivory in the past has probably under-played its role in affecting the structure of tropical ecosystems. There is substantial field evidence from intermediate rainfall systems that both fire and browsing are required to suppress trees [86–88]. This is because they are complimentary in their spatial and temporal realms of action (table 1). An intense fire can act as a once-off event to reduce woody size, but follow-up browsing is important for slowing tree growth rates before the next fire [86]. Clearly, closed canopies are possible across the entire rainfall gradient that encompasses savannahs [33] and the role of browsers in preventing these closed canopy systems need to be re-assessed (electronic supplementary material, figure S4), especially in the light of expanding bush encroachment [135].
10. Conclusion
Fire and herbivory prevail over much of the environmental gradient that encompasses savannah. However, their regions of impact differ: both in terms of biomass consumed and their ecological and biogeochemical effects. The form of fire and herbivory in any environment is key to understanding its impacts, and equating these two consumers in terms of their ‘traits' (table 1 and figure 1) will enable better understanding of their relative roles as consumers.
In tropical grasslands, high grazer numbers clearly promote heterogeneous short-grass communities, which would act to restrict fire once they had spread beyond percolation threshold for fire. Moreover, frequent extensive fires clearly promote tall, caespitose grass communities, but the impacts of these different grass communities on grazer numbers depend on the environment as well as evolutionary history. Currently, in most parts of Africa biomass is predominantly consumed by either herbivory or fire. Whether this is due to human impacts maximizing herbivory at the expense of fire or intrinsic alternative stable state dynamics remains to be shown.
Equating fire and herbivory using common units of measure (dry matter consumed), and by finding similarities in their different characteristics (e.g. fire intensity versus body size/digestive pathway) will enable productive debate and analysis on their relative roles as global consumers—as well as the most appropriate ways to model them in DGVMs. It is their differences, however, that frame the dynamics of their interaction. Improved theory on the physics of fire spread and controls of herbivore demographics are required to untangle these.
Supplementary Material
Acknowledgements
Thanks to Caroline Lehmann, William Bond, Andrew Illius and Norman Owen-Smith for helpful discussions; and Niall Hanan, an anonymous reviewer, and the editors for helping to refine our ideas.
Data accessibility
The data supporting this analysis are available by request from S.A.
Authors' contributions
S.A. and G.P.H. conceived of the paper. G.P.H. contributed herbivory data, commented on the text and assisted with figures. S.A. analysed data and wrote the paper.
Competing interests
We have no competing interests.
Funding
This work was funded by the USAID/NAS programme Partnerships for Enhanced Engagement in Research (Sub-Grant 2000004946, Cycle 3) and the DST Global Change Grand Challenge grant no. 92464.
References
- 1.McNaughton SJ, Ruess RW, Seagle SW. 1988. Large mammals and process dynamics in African ecosystem. Bioscience 38, 794–800. ( 10.2307/1310789) [DOI] [Google Scholar]
- 2.Olff H, Ritchie ME. 1998. Effects of herbivores on grassland plant diversity. TREE 13, 261–265. ( 10.1016/S0169-5347(98)01364-0) [DOI] [PubMed] [Google Scholar]
- 3.Keeley JE, Bond WJ, Bradstock RA, Pausas JG, Rundel PW. 2011. Fire in Mediterranean ecosystems: ecology, evolution and management. Cambridge, UK: Cambridge University Press. [Google Scholar]
- 4.Bowman DMJS, et al. 2009. Fire in the earth system. Science 324, 481–484. ( 10.1126/science.1163886) [DOI] [PubMed] [Google Scholar]
- 5.Estes JA, et al. 2011. Trophic downgrading of planet Earth. Science 333, 301–306. ( 10.1126/science.1205106) [DOI] [PubMed] [Google Scholar]
- 6.Bowman DMJS, et al. 2011. The human dimension of fire regimes on Earth. J. Biogeogr. 38, 2223–2236. ( 10.1111/j.1365-2699.2011.02595.x) [DOI] [PMC free article] [PubMed] [Google Scholar]
- 7.Moritz MA, et al. 2014. Learning to coexist with wildfire. Nature 515, 58–66. ( 10.1038/nature13946) [DOI] [PubMed] [Google Scholar]
- 8.Le Page Y, Oom D, Silva J, Jönsson P, Pereira J. 2010. Seasonality of vegetation fires as modified by human action: observing the deviation from eco-climatic fire regimes. Glob. Ecol. Biogeogr. 19, 575–588. ( 10.1111/j.1466-8238.2010.00525.x) [DOI] [Google Scholar]
- 9.Archibald S, Lehmann CER, Gómez-dans JL, Bradstock RA. 2013. Defining pyromes and global syndromes of fire regimes. Proc. Natl Acad. Sci. USA 110, 6442–6447. ( 10.1073/pnas.1211466110) [DOI] [PMC free article] [PubMed] [Google Scholar]
- 10.Ceballos G, Ehrlich PR. 2002. Mammal population losses and the extinction crisis. Science 296, 904–907. ( 10.1126/science.1069349) [DOI] [PubMed] [Google Scholar]
- 11.Dirzo R, Young HS, Galetti M, Ceballos G, Isaac NJB, Collen B. 2014. Defaunation in the Anthropocene. Science 345, 401–406. ( 10.1126/science.1251817) [DOI] [PubMed] [Google Scholar]
- 12.Hempson GP, Archibald S, Bond WJ. 2015. A continent-wide assessment of the form and intensity of large mammal herbivory in Africa. Science 350, 1056–1061. ( 10.1126/science.aac7978) [DOI] [PubMed] [Google Scholar]
- 13.Scholes RJ, Monteiro PMS, Sabine CL, Canadell JG. 2009. Systematic long-term observations of the global carbon cycle. Trends Ecol. Evol. 24, 427–430. ( 10.1016/j.tree.2009.03.006) [DOI] [PubMed] [Google Scholar]
- 14.van der Werf GR, Randerson JT, Giglio L, Collatz GJ, Kasibhatla PS, Arellano AF Jr. 2006. Interannual variability in global biomass burning emissions from 1997 to 2004. Atmos. Chem. Phys. 6, 3423–3441. ( 10.5194/acp-6-3423-2006) [DOI] [Google Scholar]
- 15.Staver AC, Archibald S, Levin SA. 2011. The global extent and determinants of savanna and forest as alternative biome states. Science 334, 230–232. ( 10.1126/science.1210465) [DOI] [PubMed] [Google Scholar]
- 16.Bucini G, Hanan N. 2006. A continental-scale analysis of tree cover in African savannas. Glob. Ecol. Biogeogr. 16, 593–605. ( 10.1111/j.1466-8238.2007.00325.x) [DOI] [Google Scholar]
- 17.Wood SW, Murphy BP, Bowman DMJS. 2011. Firescape ecology: how topography determines the contrasting distribution of fire and rain forest in the south-west of the Tasmanian Wilderness World Heritage Area. J. Biogeogr. 38, 1807–1820. ( 10.1111/j.1365-2699.2011.02524.x) [DOI] [Google Scholar]
- 18.Archibald S, Roy DP, van Wilgen BW, Scholes RJ. 2009. What limits fire? An examination of drivers of burnt area in Southern Africa. Glob. Change Biol. 15, 613–630. ( 10.1111/j.1365-2486.2008.01754.x) [DOI] [Google Scholar]
- 19.Daniau A-L, et al. 2012. Predictability of biomass burning in response to climate changes. Glob. Biogeochem. Cycles 26, GB004249. ( 10.1029/2011GB004249) [DOI] [Google Scholar]
- 20.Bond WJ, Woodward FI, Midgley GF. 2005. The global distribution of ecosystems in a world without fire. New Phytol. 165, 525–538. ( 10.1111/j.1469-8137.2004.01252.x) [DOI] [PubMed] [Google Scholar]
- 21.Bowman D. 2000. Australian rainforests: islands of green in a land of fire. Cambridge, UK: Cambridge University Press.
- 22.Hoffmann WA, Geiger EL, Gotsch SG, Rossatto DR, Silva LCR, Lau OL, Haridasan M, Franco AC. 2012. Ecological thresholds at the savanna–forest boundary: how plant traits, resources and fire govern the distribution of tropical biomes. Ecol. Lett. 15, 759–768. ( 10.1111/j.1461-0248.2012.01789.x) [DOI] [PubMed] [Google Scholar]
- 23.Hantson S, et al. 2016. The status and challenge of global fire modelling. Biogeosciences 13, 3359–3375. ( 10.5194/bg-2016-17) [DOI] [Google Scholar]
- 24.Scheiter S, Higgins SI. 2009. Impacts of climate change on the vegetation of Africa: an adaptive dynamic vegetation modelling approach. Glob. Change Biol. 15, 2224–2246. ( 10.1111/j.1365-2486.2008.01838.x) [DOI] [Google Scholar]
- 25.Calvo MM, Prentice IC. 2015. Effects of fire and CO2 on biogeography and primary production in glacial and modern climates. New Phytol. 208, 987–994. ( 10.1111/nph.13485) [DOI] [PubMed] [Google Scholar]
- 26.Scheiter S, Higgins SI, Osborne CP, Bradshaw C, Lunt D, Ripley BS, Taylor LL, Beerling DJ. 2012. Fire and fire-adapted vegetation promoted C4 expansion in the late Miocene. New Phytol. 195, 653–666. ( 10.1111/j.1469-8137.2012.04202.x) [DOI] [PubMed] [Google Scholar]
- 27.Pachzelt A, Forrest M, Rammig A, Higgins SI, Hickler T. 2015. Potential impact of large ungulate grazers on African vegetation, carbon storage and fire regimes. Glob. Ecol. Biogeogr. 24, 991–1002. ( 10.1111/geb.12313) [DOI] [Google Scholar]
- 28.Hairston NG, Smith FE, Slobodkin LB. 1960. Community structure, population control, and competition. Am. Nat, 421–425. ( 10.1086/282146) [DOI] [Google Scholar]
- 29.Polis GA. 1999. Why are parts of the world green? Multiple factors control productivity and the distribution of biomass. Oikos 86, 3–15. ( 10.2307/3546565) [DOI] [Google Scholar]
- 30.Bond WJ. 2005. Large parts of the world are brown or black: a different view on the ‘Green World’ hypothesis. J. Veg. Sci. 16, 261–266. ( 10.1658/1100-9233(2005)016%5B0261:lpotwa%5D2.0.co;2) [DOI] [Google Scholar]
- 31.Gill JL, Williams JW, JAckson ST, Lininger JB, Robinson GS. 2009. Pleistocene megafaunal collapse, novel plant communities, and enhanced fire regimes in North America. Science 326, 1100–1103. ( 10.1126/science.1179504) [DOI] [PubMed] [Google Scholar]
- 32.Rule S, Brook BW, Haberle SG, Turney CSM, Kershaw AP, Johnson CN. 2012. The aftermath of megafaunal extinction: ecosystem transformation in Pleistocene Australia. Science 335, 1483–1486. ( 10.1126/science.1214261) [DOI] [PubMed] [Google Scholar]
- 33.Lehmann CER, Archibald SA, Hoffmann WA, Bond WJ. 2011. Deciphering the distribution of the savanna biome. New Phytol. 191, 197–209. ( 10.1111/j.1469-8137.2011.03689.x) [DOI] [PubMed] [Google Scholar]
- 34.Dantas DL. 2016. Disturbance maintains alternative biome states. Ecol. Lett. 5, 12–19. ( 10.1111/ele.12537) [DOI] [PubMed] [Google Scholar]
- 35.Laws RM. 1970. Elephants as agents of habitat and landscape change in East Africa. Oikos 21, 1–15. ( 10.2307/3543832) [DOI] [Google Scholar]
- 36.Asner GP, Levick SR, Kennedy-Bowdoin T, Knapp DE, Emerson R, Jacobson J, Colgan MS, Martin RE. 2009. Large-scale impacts of herbivores on the structural diversity of African savannas. Proc. Natl Acad. Sci. USA 106, 4947–4952. ( 10.1073/pnas.0810637106) [DOI] [PMC free article] [PubMed] [Google Scholar]
- 37.Dublin HT, Sinclair ARE, McGlade J. 1990. Elephants and fire as causes of multiple stable states in the Serengeti-Mara woodlands. J. Anim. Ecol. 59, 1147–1164. ( 10.2307/5037) [DOI] [Google Scholar]
- 38.Stevens N, Erasmus BFN, Archibald S, Bond WJ. 2016. Woody encroachment over 70 years in South African savannahs: overgrazing, global change or extinction aftershock? Phil. Trans. R. Soc. B 371, 20150437 ( 10.1098/rstb.2015.0437) [DOI] [PMC free article] [PubMed] [Google Scholar]
- 39.Archibald S, Lehmann CER, Gómez-Dans JL, Bradstock RA. 2013. Defining pyromes and global syndromes of fire regimes. Proc. Natl Acad. Sci. USA 110, 6442–6447. ( 10.1073/pnas.1211466110) [DOI] [PMC free article] [PubMed] [Google Scholar]
- 40.Giglio L, Randerson JT, van der Werf GR, Kasibhatla PS, Collatz GJ, Morton DC, DeFries RS. 2010. Assessing variability and long-term trends in burned area by merging multiple satellite fire products. Biogeosciences 7, 1171–1186. ( 10.5194/bg-7-1171-2010) [DOI] [Google Scholar]
- 41.Robinson TP, et al. 2014. Mapping the global distribution of livestock. PLoS ONE 9, e96084 ( 10.1371/journal.pone.0096084) [DOI] [PMC free article] [PubMed] [Google Scholar]
- 42.Bowman DMJS, Perry GLW, Higgins SI, Johnson CN, Fuhlendorf SD, Murphy BP. 2016. Pyrodiversity is the coupling of biodiversity and fire regimes in food webs. Phil. Trans. R. Soc. B 371, 20150169 ( 10.1098/rstb.2015.0169) [DOI] [PMC free article] [PubMed] [Google Scholar]
- 43.van de Vijver CADM, Poot P, Prins HHT. 1999. Causes of increased nutrient concentrations in post-fire regrowth in an East African savanna. Plant Soil 214, 173–185. ( 10.1023/A:1004753406424) [DOI] [Google Scholar]
- 44.Rutherford MC. 1981. Survival,regeneration and leaf biomass changes in woody plants following spring burns in Burkea africana-Ochna pulchra Savanna. Bothalia 13, 531–552. ( 10.4102/abc.v13i3/4.1360) [DOI] [Google Scholar]
- 45.Carlson PC, Tanner GW, Wood JM, Humphrey SR. 1993. Fire in key deer habitat improves browse, prevents succession, and preserves endemic herbs. J. Wildl. Manage. 57, 914–928. ( 10.1016/0006-3207(94)90455-3) [DOI] [Google Scholar]
- 46.Brooks ML, et al. 2004. Effects of invasive alien plants on fire regimes. Bioscience 54, 677 ( 10.1641/0006-3568(2004)054%5B0677:EOIAPO%5D2.0.CO;2) [DOI] [Google Scholar]
- 47.Bakker ES, Gill JL, Johnson CN, Vera FWM, Sandom CJ, Asner GP, Svenning J-C. 2015. Combining paleo-data and modern exclosure experiments to assess the impact of megafauna extinctions on woody vegetation. Proc. Natl Acad. Sci. USA 113, 201502545 ( 10.1073/pnas.1502545112) [DOI] [PMC free article] [PubMed] [Google Scholar]
- 48.Veen GF, Blair JM, Smith MD, Collins SL. 2008. Influence of grazing and fire frequency on small-scale plant community structure and resource variability in native tallgrass prairie. Oikos 117, 859–866. ( 10.1111/j.0030-1299.2008.16515.x) [DOI] [Google Scholar]
- 49.Spasojevic MJ, Aicher RJ, Koch GR, Marquardt ES, Mirotchnick N, Troxler TG, Collins SL. 2010. Fire and grazing in a mesic tallgrass prairie: impacts on plant species and functional traits. Ecology 91, 1651–1659. ( 10.1890/09-0431.1) [DOI] [PubMed] [Google Scholar]
- 50.Bond WJ, Keeley JE. 2005. Fire as a global ‘herbivore’: the ecology and evolution of flammable ecosystems. Trends Ecol. Evol. 20, 387–394. ( 10.1016/j.tree.2005.04.025) [DOI] [PubMed] [Google Scholar]
- 51.McNaughton SJ. 1984. Grazing lawns: animals in herds, plant form, and coevolution. Am. Nat. 124, 863–886. ( 10.1086/284321) [DOI] [Google Scholar]
- 52.Stobbs TH. 1973. The effect of plant structure on the intake of tropical pastures. I. Variation in the bite size of grazing cattle. Crop Pasture Sci. 24, 809–819. ( 10.1071/AR9730809) [DOI] [Google Scholar]
- 53.Owen-Smith N, Novellie P. 1982. What should a clever ungulate eat? Am. Nat. 119, 151–178. ( 10.1086/283902) [DOI] [Google Scholar]
- 54.Sensenig RL, Demment MW, Laca EA. 2010. Allometric scaling predicts preferences for burned patches in a guild of East African grazers. Ecology 91, 2989 ( 10.1890/09-1673.1) [DOI] [PubMed] [Google Scholar]
- 55.Williams RJ, Gill AM, Moore PHR. 1998. Seasonal changes in fire behaviour in a tropical savanna in northern Australia. Int. J. Wildl. Fire 8, 227–240. ( 10.1071/WF9980227) [DOI] [Google Scholar]
- 56.Smith FA, Lyons SK, Wagner PJ, Elliott SM. 2015. The importance of considering animal body mass in IPCC greenhouse inventories and the underappreciated role of wild herbivores. Glob. Change Biol. 21, 3880–3888. ( 10.1111/gcb.12973) [DOI] [PubMed] [Google Scholar]
- 57.Hoffa EA, Ward DE, Hao WM, Susott RA, Wakimoto RH. 1999. Seasonality of carbon emissions from biomass burning in a Zambian savanna. J. Geophys. Res. 104, 13841 ( 10.1029/1999JD900091) [DOI] [Google Scholar]
- 58.Korontzi S. 2005. Seasonal patterns in biomass burning emissions from southern African vegetation fires for the year 2000. Glob. Change Biol. 11, 1680–1700. ( 10.1111/j.1365-2486.2005.001024.x) [DOI] [Google Scholar]
- 59.Govender N, Trollope WSW, Van Wilgen BW. 2006. The effect of fire season, fire frequency, rainfall and management on fire intensity in savanna vegetation in South Africa. J. Appl. Ecol. 43, 748–758. ( 10.1111/j.1365-2664.2006.01184.x) [DOI] [Google Scholar]
- 60.Schwilk DW. 2015. Dimensions of plant flammability. New Phytol. 206, 486–488. ( 10.1111/nph.13372) [DOI] [PubMed] [Google Scholar]
- 61.Brune A. 2014. Symbiotic digestion of lignocellulose in termite guts. Nat. Rev. Microbiol. 12, 168–180. ( 10.1038/nrmicro3182) [DOI] [PubMed] [Google Scholar]
- 62.Krawchuk MA, Moritz MA. 2011. Constraints on global fire activity vary across a resource gradient. Ecology 92, 121–132. ( 10.1890/09-1843.1) [DOI] [PubMed] [Google Scholar]
- 63.Bradstock RA. 2010. A biogeographic model of fire regimes in Australia: contemporary and future implications. Glob. Ecol. Biogeogr. 19, 145–158. ( 10.1111/j.1466-8238.2009.00512.x) [DOI] [Google Scholar]
- 64.Aldersley A, Murray SJ, Cornell SE. 2011. Global and regional analysis of climate and human drivers of wildfire. Sci. Total Environ. 409, 3472–3481. ( 10.1016/j.scitotenv.2011.05.032) [DOI] [PubMed] [Google Scholar]
- 65.Pausas JG, Ribeiro E. 2013. The global fire–productivity relationship. Glob. Ecol. Biogeogr. 22, 728–736. ( 10.1111/geb.12043) [DOI] [Google Scholar]
- 66.East R. 1984. Rainfall, soil nutrient status and biomass of large African savanna mammals. Afr. J. Ecol. 22, 245–270. ( 10.1111/j.1365-2028.1984.tb00700.x) [DOI] [Google Scholar]
- 67.Illius AW, O'Connor TG. 1999. On the relevance of nonequilibrium concepts to arid and semiarid grazing systems. Ecol. Appl. 9, 798–813. ( 10.1890/1051-0761(1999)009%5B0798:OTRONC%5D2.0.CO;2) [DOI] [Google Scholar]
- 68.Scholes RJ, Walker BH. 1993. An African savanna: a synthesis of the Nylsvlei study. Cambridge, UK: Cambridge University Press. [Google Scholar]
- 69.Bell RHV. 1982. The effect of soil nutrient availability on community structure in African ecosystems. In Ecology of tropical savannas (eds Huntley BJ, Walker BH). New York, NY: Springer. [Google Scholar]
- 70.Ripley B, Visser V, Christin PA, Archibald S, Martin T, Osborne C. 2015. Fire ecology of C3 and C4 grasses depends on evolutionary history and frequency of burning but not photosynthetic type. Ecology 96, 2679–2691. ( 10.1890/14-1495.1) [DOI] [PubMed] [Google Scholar]
- 71.Hoffmann WA, Jaconis SY, McKinley KL, Geiger EL, Gotsch SG, Franco AC. 2011. Fuels or microclimate? Understanding the drivers of fire feedbacks at savanna–forest boundaries. Austral. Ecol. 37, 634–643. ( 10.1111/j.1442-9993.2011.02324.x) [DOI] [Google Scholar]
- 72.Staver AC, Archibald S, Levin S. 2011. Tree cover in sub-Saharan Africa: rainfall and fire constrain forest and savanna as alternative stable states. Ecology 92, 1063–1072. ( 10.1890/10-1684.1) [DOI] [PubMed] [Google Scholar]
- 73.Cromsigt JPGM, Kuijper DPJ. 2011. Revisiting the browsing lawn concept: evolutionary interactions or pruning herbivores? Perspect. Plant Ecol. Evol. Syst. 13, 207–215. ( 10.1016/j.ppees.2011.04.004) [DOI] [Google Scholar]
- 74.Fornara DA, Toit JT. 2007. Browsing lawns? Responses of Acacia nigrescens to ungulate browsing in an African savanna. Ecology 88, 200–209. ( 10.1890/0012-9658(2007)88%5B200:BLROAN%5D2.0.CO;2) [DOI] [PubMed] [Google Scholar]
- 75.Anderson TM, Ritchie ME, Mayemba E, Eby S, Grace JB, McNaughton SJ. 2007. Forage nutritive quality in the Serengeti ecosystem: the roles of fire and herbivory. Am. Nat. 170, 343–357. ( 10.1086/520120) [DOI] [PubMed] [Google Scholar]
- 76.Yoganand K, Owen-Smith N. 2014. Restricted habitat use by an African savanna herbivore through the seasonal cycle: key resources concept expanded. Ecography 37, 969–982. ( 10.1111/ecog.00534) [DOI] [Google Scholar]
- 77.Owen-Smith N. 2004. Functional heterogenicity in resources within landscapes and herbivore population dynamics. Landsc. Ecol. 19, 761–771. ( 10.1007/s10980-005-0247-2) [DOI] [Google Scholar]
- 78.Danckwerts JE, Nel LO. 1989. The effect of frequency of defoliation on Themeda triandra in the false thornveld of the Eastern Cape. J. Grasslands Soc. S. Afr. 6, 32–36. ( 10.1080/02566702.1989.9648157) [DOI] [Google Scholar]
- 79.Vinton MA, Hartnett DC. 1992. Effects of bison grazing on Andropogon gerardii and Panicum virgatum in burned and unburned tallgrass prairie. Oecologia 90, 374–382. ( 10.1007/BF00317694) [DOI] [PubMed] [Google Scholar]
- 80.Diaz S, et al. 2007. Plant trait responses to grazing—a global synthesis. Glob. Change Biol. 13, 313–341. ( 10.1111/j.1365-2486.2006.01288.x) [DOI] [Google Scholar]
- 81.Archibald S, Bond WJ. 2004. Grazer movements: spatial and temporal responses to burning in a tall-grass African savanna. Int. J. Wildl. Fire 13, 377–385. ( 10.1071/WF03070) [DOI] [Google Scholar]
- 82.Vinton MA, Hartnett DC, Finck EJ, Briggs JM. 1993. Interactive effects of fire, bison, (Bison bison) grazing and plant community composition in tallgrass prairie. Am. Midl. Nat. 129, 10–18. ( 10.2307/2426430) [DOI] [Google Scholar]
- 83.Archibald S, Bond WJ, Stock WD, Fairbanks DHK. 2005. Shaping the landscape: fire–grazer interactions in an African savanna. Ecol. Appl. 15, 96–109. ( 10.1890/03-5210) [DOI] [Google Scholar]
- 84.Collins SL, Smith MD. 2006. Scale-dependent interaction of fire and grazing on community heterogeneity in tallgrass prairie. Ecology 87, 2058–2067. ( 10.1890/0012-9658(2006)87%5B2058:SIOFAG%5D2.0.CO;2) [DOI] [PubMed] [Google Scholar]
- 85.Beuchner HK, Dawkins HC. 1961. Vegetation change induced by elephants and fire in Murchison Falls National Park, Uganda. Ecology 42, 752–766. ( 10.2307/1933504) [DOI] [Google Scholar]
- 86.Staver AC, Bond WJ, Stock WD, Van Rensburg SJ, Waldram MS. 2009. Browsing and fire interact to suppress tree density in an African savanna. Ecol. Appl. 19, 1909–1919. ( 10.1890/08-1907.1) [DOI] [PubMed] [Google Scholar]
- 87.Trollope WSW. 1974. Role of fire in preventing bush encroachment in the Eastern Cape. Proc. Annu. Congr. Grassl. Soc. S. Afr. 9, 67–72. ( 10.1080/00725560.1974.9648722) [DOI] [Google Scholar]
- 88.Augustine D, Mcnaughton S. 2004. Regulation of shrub dynamics by native browsing ungulates on East African rangeland. J. Appl. Ecol. 41, 45–58. ( 10.1111/j.1365-2664.2004.00864.x) [DOI] [Google Scholar]
- 89.Bond WJ, Van Wilgen BW. 1996. Fire and plants. London, UK: Chapman and Hall. [Google Scholar]
- 90.Higgins SI, et al. 2007. Effects of four decades of fire manipulation on woody vegetation structure in savanna. Ecology 88, 1119–1125. ( 10.1890/06-1664) [DOI] [PubMed] [Google Scholar]
- 91.Holdo RM, Anderson TM, Morrison T. 2014. Precipitation, fire and demographic bottleneck dynamics in Serengeti tree populations. Landsc. Ecol. 29, 1613–1623. ( 10.1007/s10980-014-0087-y) [DOI] [Google Scholar]
- 92.Van Langevelde F, et al. 2003. Effects of fire and herbivory on the stability of savanna ecosystems. Ecology 84, 337–350. ( 10.1890/0012-9658(2003)084%5B0337:EOFAHO%5D2.0.CO;2) [DOI] [Google Scholar]
- 93.Archibald S, Bond WJ. 2003. Growing tall vs growing wide: tree architecture and allometry of Acacia karroo in forest, savanna, and arid environments. Oikos 102, 3–14. ( 10.1034/j.1600-0706.2003.12181.x) [DOI] [Google Scholar]
- 94.Charles-Dominique T, Staver AC, Midgley GF, Bond WJ. 2015. Functional differentiation of biomes in an African savanna/forest mosaic. S. Afr. J. Bot. 101, 82–90. ( 10.1016/j.sajb.2015.05.005) [DOI] [Google Scholar]
- 95.Bond WJ, Loffell D. 2001. Introduction of giraffe changes acacia distribution in a South African savanna. Afr. J. Ecol. 39, 286–294. ( 10.1046/j.1365-2028.2001.00319.x) [DOI] [Google Scholar]
- 96.Bond WJ, Smythe K-A, Balfour DA. 2001. Acacia species turnover in space and time in an African savanna. J. Biogeogr. 28, 117–128. ( 10.1046/j.1365-2699.2001.00506.x) [DOI] [Google Scholar]
- 97.Archibald S, Staver AC, Levin SA. 2012. Evolution of human-driven fire regimes in Africa. Proc. Natl Acad. Sci. USA 109, 847–852. ( 10.1073/pnas.1118648109) [DOI] [PMC free article] [PubMed] [Google Scholar]
- 98.Waldram MS, Bond WJ, Stock W. 2008. Ecological engineering by a mega-grazer: white rhino impacts on a South African savanna. Ecosystems 11, 101–112. ( 10.1007/s10021-007-9109-9) [DOI] [Google Scholar]
- 99.Sachro LL, Strong WL, Gates CC. 2005. Prescribed burning effects on summer elk forage availability in the subalpine zone, Banff National Park, Canada. J. Environ. Manage. 77, 183–193. ( 10.1016/j.jenvman.2005.04.003) [DOI] [PubMed] [Google Scholar]
- 100.Hobbs NT, Swift DM. 1985. Estimates of habitat carrying capacity incorporating explicit nutritional constraints. J. Wildl. Manage. 49, 814–822. ( 10.2307/3801716) [DOI] [Google Scholar]
- 101.Hempson GP, Illius AW, Hendricks HH, Bond WJ, Vetter S. 2015. Herbivore population regulation and resource heterogeneity in a stochastic environment. Ecology 96, 2170–2180. ( 10.1890/14-1501.1) [DOI] [PubMed] [Google Scholar]
- 102.Owen-Smith RN. 2002. Adaptive herbivore ecology: from resources to populations in variable environments, pp. 244–258. Cambridge, UK: Cambridge University Press. [Google Scholar]
- 103.Hempson GP, et al. 2014. Ecology of grazing lawns in Africa. Biol. Rev. 90, 979994. [DOI] [PubMed] [Google Scholar]
- 104.O'Reagain PJ, Mentis MT. 1989. The effect of plant structure on the acceptability of different grass species to cattle. J. Grassl. Soc. S. Afr. 6, 163–170. ( 10.1080/02566702.1989.9648180) [DOI] [Google Scholar]
- 105.Owen-Smith N. 2002. Resource production: regeneration and attrition. In Adaptive herbivore ecology—from resources to populations in variable environments, pp. 162–183. Cambridge, UK: Cambridge University Press. [Google Scholar]
- 106.Milchunas DG, Sala OE, Lauenroth W. 1988. A generalized model of the effects of grazing by large herbivores on grassland community structure. Am. Nat. 132, 87–106. ( 10.1086/284839) [DOI] [Google Scholar]
- 107.Knapp AK, Blair JM, Briggs JM, Collins SL, Hartnett DC, Johnson LC, Towne EG, John M, Scott L. 1999. The keystone role of bison in North American tallgrass prairie: bison increase habitat heterogeneity and alter a broad array of plant, community, and ecosystem processes. Bioscience 49, 39 ( 10.2307/1313492) [DOI] [Google Scholar]
- 108.Townsend DE, Fuhlendorf SD. 2010. Evaluating relationships between spatial heterogeneity and the biotic and abiotic environments. Am. Midl. Nat. 163, 351–365. ( 10.1674/0003-0031-163.2.351) [DOI] [Google Scholar]
- 109.Waldram MS, Bond WJ, Stock W. 2008. Ecological engineering by a mega-grazer: white rhino impacts on a South African savanna. Ecosystems 11, 101–112. ( 10.1007/s10021-007-9109-9) [DOI] [Google Scholar]
- 110.Scheffer M, Carpenter S, Foley JA, Folke C, Walker B. 2001. Catastrophic shifts in ecosystems. Nature 413, 591–596. ( 10.1038/35098000) [DOI] [PubMed] [Google Scholar]
- 111.Noy-Meir I. 1975. Stability of grazing systems: an application of predator–prey graphs. J. Ecol. 63, 459–481. ( 10.2307/2258730) [DOI] [Google Scholar]
- 112.Norton-Griffiths M. 1979. The influence of grazing, browsing, and fire on the vegetation dynamics of the Serengeti. In Serengeti: dynamics of an ecosystem (eds Sinclair ARE, Norton-Griffiths M), pp. 310–352. Chicago, IL: University of Chicago Press. [Google Scholar]
- 113.Holdo RM, Sinclair ARE, Dobson AP, Metzger KL, Bolker BM, Ritchie ME, Holt RD. 2009. A disease-mediated trophic cascade in the Serengeti and its implications for ecosystem C. PLoS Biol.7, e1000210. ( 10.1371/journal.pbio.1000210) [DOI] [PMC free article] [PubMed] [Google Scholar]
- 114.Owen-Smith N. 1988. Megaherbivores: the influence of very large body size on ecology. Cambridge, UK: Cambridge University Press. [Google Scholar]
- 115.Van Leeuwen TT, et al. 2014. Biomass burning fuel consumption rates: a field measurement database. Biogeosciences 11, 7305–7329. ( 10.5194/bg-11-7305-2014) [DOI] [Google Scholar]
- 116.Russell-Smith J, Cook GD, Cooke PM, Edwards AC, Lendrum M, Meyer CP, Whitehead PJ. 2013. Managing fire regimes in north Australian savannas: applying Aboriginal approaches to contemporary global problems. Front. Ecol. Environ. 11, e55–e63. ( 10.1890/120251) [DOI] [Google Scholar]
- 117.Kump LR. 1988. Terrestrial feedback in atmospheric oxygen regulation by fire and phosphorus. Nature 335, 152–154 ( 10.1038/335152a0) [DOI]
- 118.Wolf A, Doughty CE, Malhi Y. 2013. Lateral diffusion of nutrients by mammalian herbivores in terrestrial ecosystems. PLoS ONE 8, 1–10. ( 10.1371/journal.pone.0071352) [DOI] [PMC free article] [PubMed] [Google Scholar]
- 119.Hobbs NT, Schimel DS, Owensby CE, Ojima DS. 1991. Fire and grazing in the tallgrass prairie: contingent effects on nitrogen budgets. Ecology 72, 1374–1382. ( 10.2307/1941109) [DOI] [Google Scholar]
- 120.McNaughton SJ. 1985. Ecology of a grazing ecosystem: the Serengeti. Ecol. Monogr. 55, 259–294. ( 10.2307/1942578) [DOI] [Google Scholar]
- 121.Sanderson EW, Jaiteh M, Levy MA, Redford KH, Wannebo AV, Woolmer G. 2002. The human footprint and the last of the wild. Bioscience 52, 891–904. ( 10.1641/0006-3568(2002)052%5B0891:THFATL%5D2.0.CO;2) [DOI] [Google Scholar]
- 122.Huffman GJ, Adler RF, Bolvin DT, Gu G, Nelkin EJ, Bowman KP, Hong Y, Stocker EF, Wolff DB. 2007. The TRMM multi-satellite precipitation analysis: quasi-global, multi-year combined-sensor precipitation estimates at fine scale. J. Hydrometeorol. 8, 38–55. ( 10.1175/JHM560.1) [DOI] [Google Scholar]
- 123.Fischer G, Nachtergaele F, Prieler S, Van Velthuizen HT, Verelst L, Wiberg D. 2008. Global agro-ecological zones assessment for agriculture (GAEZ 2008). Laxenburg, Austria: IIASA. [Google Scholar]
- 124.van der Werf GR, et al. 2010. Global fire emissions and the contribution of deforestation, savanna, forest, agricultural, and peat fires (1997–2009). Atmos. Chem. Phys. Discuss. 10, 16 153–16 230. ( 10.5194/acpd-10-16153-2010) [DOI] [Google Scholar]
- 125.Dong H, Mangino J, McAllister T, Hatfield JL, Johnson D, Lassey KR, Aparedicda M, Romanovskaya A. 2006. Emissions from livestock and manure management. In 2006 IPCC guidelines for national greenhouse gas inventories, vol. 4, Agriculture, forestry and other land use (eds Eggleston HS, Buendia L, Miwa K, Ngara T, Tanabe K), pp. 1–87. IGES, Japan. Hayama, Kanagawa, Japan: National Greenhouse Gas Inventories Programme. [Google Scholar]
- 126.Dantas VL, Pausas JG. 2013. The lanky and the corky: fire-escape strategies in savanna woody species. J. Ecol. 101, 1265–1272. ( 10.1111/1365-2745.12118) [DOI] [Google Scholar]
- 127.Du Toit J, Biggs HC, Rodgers K, Sinclair ARE, Walker BH. 2003. The Kruger experience: ecology and management of savanna heterogeneity. Washington, DC: Island Press. [Google Scholar]
- 128.Balfour DA, Howison OE. 2001. Spatial and temporal variation in a mesic savanna fire regime: responses to variation in annual rainfall. Afr. J. Range Forage Sci. 19, 45–53. ( 10.2989/10220110209485773) [DOI] [Google Scholar]
- 129.Archibald S. 2016. Managing the human component of fire regimes: lessons from Africa. Phil. Trans. R. Soc. B 371, 20150346 ( 10.1098/rstb.2015.0346) [DOI] [PMC free article] [PubMed] [Google Scholar]
- 130.Ryan CM, Williams M. 2015. How does fire intensity and frequency affect miombo woodland tree populations and biomass? Ecol. Appl. 21, 48–60. ( 10.1890/09-1489.1) [DOI] [PubMed] [Google Scholar]
- 131.Asner GP, Levick SR. 2012. Landscape-scale effects of herbivores on treefall in African savannas. Ecol. Lett. 15, 1211–1217. ( 10.1111/j.1461-0248.2012.01842.x) [DOI] [PubMed] [Google Scholar]
- 132.Midgley JJ, Lawes MJ, Chamaillé-Jammes S. 2010. Turner review no. 19. Savanna woody plant dynamics: the role of fire and herbivory, separately and synergistically. Aust. J. Bot. 58, 1–11. ( 10.1071/BT09034) [DOI] [Google Scholar]
- 133.Gignoux J, Lahoreau G, Julliard R, Barot S. 2009. Establishment and early persistence of tree seedlings in an annually burned savanna. J. Ecol. 97, 484–495. ( 10.1111/j.1365-2745.2009.01493.x) [DOI] [Google Scholar]
- 134.Prins HHT, van der Jeugd HP. 1993. Herbivore population crashes and woodland structure in East Africa. J. Ecol. 81, 305–314. ( 10.2307/2261500) [DOI] [Google Scholar]
- 135.Sala OE, Maestre FT. 2014. Grass–woodland transitions: determinants and consequences for ecosystem functioning and provisioning of services. J. Ecol. 102, 1357–1362. ( 10.1111/1365-2745.12326) [DOI] [Google Scholar]
Associated Data
This section collects any data citations, data availability statements, or supplementary materials included in this article.
Supplementary Materials
Data Availability Statement
The data supporting this analysis are available by request from S.A.