

Abstract
Summary: The use of sodium bisulfite (BS) treatment followed by hybridization to an Illumina Infinium BeadChip (HumanMethylation450 and MethylationEPIC) is a common method for interrogating 5-methylcytosine (5mC) at single nucleotide resolution. However, standard treatment of DNA with BS does not allow disambiguation of 5mC from an additional cytosine modification, 5-hydroxymethylcytosine (5hmC). Recently, it has been demonstrated that paired BS and oxidative bisulfite (oxBS) treatment on the same sample followed by hybridization to an Infinium microarray permits the differentiation of 5hmC from 5mC. Nevertheless, estimation of 5hmC and 5mC from tandem-treated arrays has been shown to produce irregular estimates of cytosine modifications.
Results: We present a novel method using maximum likelihood estimation to accurately estimate the parameters of unmethylated cytosine (5C), 5mC and 5hmC from Infinium microarray data given the signal intensities from the oxBS and BS replicates.
Availability and Implementation: OxyBS is an R package available on CRAN.
Contact: Andres.Houseman@oregonstate.edu
Supplementary information: Supplementary data are available at Bioinformatics online.
1 Introduction
5-methylcytosine (5mC) is an essential epigenetic mark that controls gene expression or gene expression potential (Jones, 2012). 5mC is the most widely studied epigenetic mark, and assays are available for mapping 5mC genome-wide at a single base resolution (Bock, 2012). Although whole-genome bisulfite sequencing offers a complete characterization of the epigenome, DNA methylation microarray after bisulfite (BS) treatment has been the most commonly used genome-wide application (Bock, 2012). Additional modifications to cytosine that modulate normal gene function have been implicated in disease development (Tahiliani et al., 2009). Indeed, the ten-eleven translocation family of proteins has been shown to function as enzymes capable of altering the methylation status of DNA by oxidizing 5mC to 5-hydroxymethylcytosine (5hmC). Emerging evidence has suggested that 5hmC may act both as a transient intermediate in the process of 5mC demethylation and a functional epigenetic mark that regulates transcription (Bachman et al., 2014; Vasanthakumar and Godley, 2015).
Treatment of DNA with BS alone is unable to disambiguate 5hmC from 5mC. A growing appreciation for the role of 5hmC in biological processes and disease prompted the addition of an oxidation step prior to BS treatment (oxBS) that selectively oxidizes 5hmC to resolve ‘true’ 5mC levels. Paired BS and oxBS treatment on the same samples followed by hybridization to the Illumina 450K array now permits the differentiation of 5hmC from 5mC (Field et al., 2015; Stewart et al., 2015). However, naïve estimation of 5hmC via the difference in values between oxBS and BS signals results in some estimates with negative values and summed cytosine modification triplet estimates [unmodified cytosine (5C), 5mC and 5hmC] that exceed a value of 1.0. In the context of cytosine modifications, negative values of 5hmC and triplet sums exceeding 1.0 do not represent valid biological observations and these inconsistencies may represent artifacts of random assay noise.
2 Materials and methods
Here, we present an R package entitled OxyBS (oxidative bisulfite and bisulfite) that provides utilities for processing paired BS and oxBS Illumina Infinium array data and provides accurate estimations of cytosine modifications. Furthermore, there are several helper functions available that process data into BS-methylated, BS-unmethylated, oxBS-methylated and oxBS-unmethylated signals. Normalization and background correction of raw signals from each BS and oxBS converted sample is achieved using the FunNorm procedure available in the R/Bioconductor package minfi (version 1.14.0) (Aryee et al., 2014). Our software applies a novel technique for estimating unmethylated proportions (5C), 5mC and 5hmC. Briefly, each cytosine (i.e. CpG) corresponded to a data vector , with representing total signal (unmethylated + methylated) and representing Methylated signal {BS, OxBS}); we used maximum likelihood to fit the data-generating model.
under the constraints , , thus estimating parameters (unmethylated proportion), (5mC proportion) and (5hmC proportion). Note that this method explicitly disallows negative proportions although we did observe numerically zero values of 5hmC ).
# Load sample data
data(OxyBSSampleData)
# Calculate Total Signals
signalBS <- exampleMethBS+exampleUnmethBS
signalOxBS <- exampleMethOxBS+exampleUnmethOxBS
# Calculate Beta Values
betaBS <- exampleMethBS/signalBS
betaOxBS <- exampleMethOxBS/signalOxBS
The software is amendable to parallelization and is recommended for users as implementation of OxyBS for large sample sizes can be computationally intensive. The output is a user-friendly array containing estimates of 5C, 5mC and 5hmC for each CpG on the array. A guide to use of OxyBS is available: https://github.com/Christensen-Lab-Dartmouth/OxyBS.
A similar method has been developed to simultaneously estimate 5hmC, 5mC from BS-seq, oxBS-seq and TAB-seq experiments (Qu et al., 2013). Key features of our OxyBS software are its implementation in R and its compatibility with the popular Illumina Infinium arrays.
3 Results
To compare the performance of our proposed OxyBS method versus a naïve calculation, we analyzed sample data from the OxyBS R package, paired BS-oxBS data from GSE73895 and data simulated for ‘true’ cytosine modification triplets (5C, 5mC and 5hmC) based on a Dirichlet distribution fit to the data in GSE73895. First, we used the sample data provided in the OxyBS CRAN package (30 CpGs × 30 samples) and estimated 5hmC values using a naïve approach (5hmC = BS − OxBS) and our proposed OxyBS algorithm. Results clearly demonstrate that the naïve method produces negative values, whereas our proposed method does not (Fig. 1A). Next, we expanded our analysis to include data from GSE73895, a study of 30 glioblastomas, and examined the percentage of probes that had negative values of 5hmC via naïve calculation. Figure 1B shows that the percentage of negative 5hmC values in the naïve calculation approaches 40% across all across Infinium probe type and CpG island strata (top panel), and the bottom panel shows the distribution of negative 5hmC values resulting from the naïve approach.
Fig. 1.
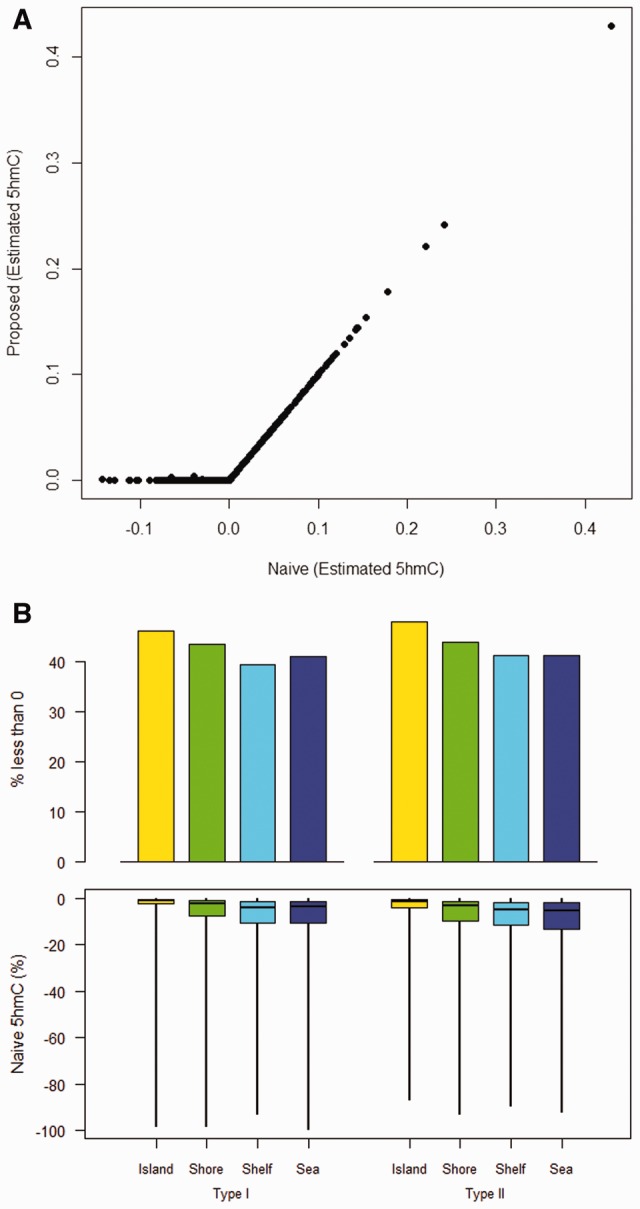
Higher performance for proposed OxyBS method. A. 5hmC values from OxyBS package sample data (n = 30 samples × 30 CpGs) from both the naïve and proposed (OxyBS) approaches B. The percentages of values that are negative for naïve treatment of GSE73895 data (top panel) and boxplots to highlight the distribution of those negative 5hmC values (bottom panel) (Color version of this figure is available at Bioinformatics online.)
We assessed the difference between the ‘true’ cytosine triplets and observed values obtained from the naïve and proposed OxyBS approaches using median absolute deviation (MAD). In addition to the aforementioned naïve approach (naïve0, 5hmC = BS − OxBS), we also considered naïve approaches that set 5hmC to zero when BS < OxBS: naïve1 (OxBS used as a proxy for 5mC) and naïve2 (BS as a proxy for 5mC). All estimations of simulated data (described in Supplemental information) were stratified by Infinium probe type and CpG island status (5000 values for each strata). MAD was then calculated as the median of the sum of the absolute deviations across 5C, 5mC and 5hmC. Using the 5000 simulated values for each strata, our proposed OxyBS method had the best performance (MAD is minimized across all strata, Supplemental Figure S1). Notably, the results are comparable when betaBS < betaOxBS and the betaOxBS data is ignored as in naïve1 and naïve2 (Supplemental Figure S1). Qualitatively identical results were obtained for root-mean-squared-error (RMSE, data not shown).
Estimations of negative values from paired BS and oxBS arrays likely reflect values of zero for 5hmC and are technical artifacts. Here we demonstrate that operationalizing the negative 5hmC values from a naïve calculation in a usable manner results in more error than using the OxyBS method, which enforces appropriate constraints on the data. The OxyBS tool can readily be applied to both the Illumina 450K and MethylationEPIC arrays as well as sequencing data with read counts for the four input data types (BS-methylated, BS-unmethylated, oxBS-methylated and oxBS-unmethylated).
Supplementary Material
Acknowledgements
We would like to thank all beta testers of OxyBS.
Funding
This work was supported by the National Institutes of Health [grant numbers R01 MH094609 to EAH, R01 DE022772, P20 GM104416/8189 to BCC].
Conflict of Interest: none declared.
References
- Aryee M.J. et al. (2014) Minfi: a flexible and comprehensive Bioconductor package for the analysis of Infinium DNA methylation microarrays. Bioinformatics, 30, 1363–1369. [DOI] [PMC free article] [PubMed] [Google Scholar]
- Bachman M. et al. (2014) 5-Hydroxymethylcytosine is a predominantly stable DNA modification. Nat. Chem., 6, 1049–1055. [DOI] [PMC free article] [PubMed] [Google Scholar]
- Bock C. (2012) Analysing and interpreting DNA methylation data. Nat. Rev. Genet., 13, 705–719. [DOI] [PubMed] [Google Scholar]
- Field S.F. et al. (2015) Accurate measurement of 5-methylcytosine and 5-hydroxymethylcytosine in human cerebellum DNA by oxidative bisulfite on an array (OxBS-array). PloS One, 10, e0118202. [DOI] [PMC free article] [PubMed] [Google Scholar]
- Jones P.A. (2012) Functions of DNA methylation: islands, start sites, gene bodies and beyond. Nat. Rev. Genet., 13, 484–492. [DOI] [PubMed] [Google Scholar]
- Qu J. et al. (2013) MLML: consistent simultaneous estimates of DNA methylation and hydroxymethylation. Bioinformatics, 29, 2645–2646. [DOI] [PMC free article] [PubMed] [Google Scholar]
- Stewart S.K. et al. (2015) oxBS-450K: a method for analysing hydroxymethylation using 450K BeadChips. Methods, 72, 9–15. [DOI] [PMC free article] [PubMed] [Google Scholar]
- Tahiliani M. et al. (2009) Conversion of 5-methylcytosine to 5-hydroxymethylcytosine in mammalian DNA by MLL partner TET1. Science, 324, 930–935. [DOI] [PMC free article] [PubMed] [Google Scholar]
- Vasanthakumar A., Godley L.A. (2015) 5-hydroxymethylcytosine in cancer: significance in diagnosis and therapy. Cancer Genet., 208, 167–177. [DOI] [PubMed] [Google Scholar]
Associated Data
This section collects any data citations, data availability statements, or supplementary materials included in this article.