Abstract
Purpose
To analyze the effect of primary gross tumor volume (pGTV) and nodal gross tumor volume (nGTV) on treatment outcomes in patients treated with definitive intensity-modulated radiation therapy (IMRT) for oropharyngeal cancer (OPC).
Methods and Materials
Between September 1998 and April 2009, a total of 442 patients with squamous cell carcinoma of the oropharynx were treated with IMRT with curative intent at our center. Thirty patients treated post-operatively and 2 additional patients who started treatment more than 6 months after diagnosis were excluded. A total of 340 patients with restorable treatment plans were included in this present study. The majority of the patients underwent concurrent platinum-based chemotherapy. The pGTV and nGTV were calculated using the original clinical treatment plans. Cox proportional hazards models and log-rank tests were used to evaluate the correlation between tumor volumes and overall survival (OS), and competing risks analysis tools were used to evaluate the correlation between local failure (LF), regional failure (RF), distant metastatic failure (DMF) vs. tumor volumes with death as a competing risk.
Results
Median follow-up among surviving patients was 34 months (range, 5-67). The 2-year cumulative incidence of LF, RF and DF in this cohort of patients was 6.1%, 5.2%, and 12.2%, respectively. The 2-year OS rate was 88.6%. Univariate analysis determined pGTV and T-stage correlated with LF (p < 0.0001 and p = 0.004, respectively), whereas nGTV was not associated with RF. On multivariate analysis, pGTV and N-stage were independent risk factors for overall survival (p = 0.0003 and p = 0.0073, respectively) and distant control (p = 0.0008 and p = 0.002, respectively).
Conclusions
In this cohort of patients with OPC treated with IMRT, pGTV was found to be associated with overall survival, local failure, and distant metastatic failure.
Keywords: Oropharyngeal cancer, IMRT, Head-and-neck cancer, Tumor volume, Clinical outcomes
INTRODUCTION
The International Union Against Cancer Tumor, Node, Metastasis (TNM) cancer staging system is a universally accepted staging system for head-and-neck cancer (HNC) (1). This validated model includes prognostic information based on metric and anatomic criteria. The American Joint Committee on Cancer (AJCC) uses this TNM classification for the assignment of stage groupings (I–IV) (2). This staging aids clinicians in determining prognosis and in selecting the most effective therapeutic intervention.
Efforts have been made to improve the current TNM staging system by studying other factors that may have predicative prognostic characteristics. There is mounting evidence that tumor volume may be a prognostic factor in various HNCs and can be used to improve the TNM system. Many studies have shown that tumor volume has a prognostic role in locoregional control (LRC) of various HNCs, specifically, in the glottis, supraglottis, hypopharynx, and nasopharynx treated by primary radiotherapy (RT) (3–9). Even with this evidence, more work in each of the HNC sites is needed before tumor volume can be reliably incorporated into the TNM system.
In regard to the OPC subsite of HNC, tumor volume as a prognostic factor is controversial. Several earlier studies using primarily two-dimensional (2D) treatments modalities have observed no significant correlation between tumor volume and locoregional control (4, 10–12). In contrast, one 3D-CRT study (13) and two IMRT studies have shown that tumor volume is predictive of locoregional control but are limited by sample size or a large number of postoperative patients (14, 15). This study was designed to shed more light on this contentious topic.
The objectives of this study were to analyze the effect of pGTV and nGTV on treatment outcomes in patients treated with definitive IMRT for OPC. Our experience with definitive treatment of OPC with IMRTand the correlation between tumor volume and treatment outcomes, to our knowledge, is the largest single-institutional experience to date.
METHODS AND MATERIALS
Patients
The records of 442 patients with histologically confirmed OPC treated consecutively with IMRT at our institution between September 1998 and April 2009 were reviewed. Thirty patients were treated postoperatively and were excluded from the study because surgical intervention may complicate patient results by altering the regional lymphatic system. Definitive treatment was defined as initiation of RT within 6 months of diagnosis. Two patients were treated with RT more than 6 months after biopsy diagnosis and excluded. A total of 340 patients with restorable treatment plans formed the population for the present analysis.
Before initiation of treatment, all patients underwent a complete history and physical examination, direct flexible fiberoptic endoscopic examination, complete blood counts, liver function tests, chest X-ray, magnetic resonance imaging (MRI) scans of the head-and-neck region, and dental evaluation. Bone scans, computed tomography (CT) scans of the chest and abdomen, and positron emission tomography (PET) scans were obtained whenever possible before the beginning of treatment.
IMRT target definitions and dose specifications
The guidelines for determination and delineation of the clinical and nodal target volumes have been reported previously in detail (16, 17). In brief, the primary gross tumor volume (pGTV) and nodal gross tumor volume (nGTV) were contoured based on all available imaging as well as clinical examination. The high-risk subclinical tumor volume or CTV59.4 encompassed all gross disease plus a margin for potential microscopic spread, including the lymph node areas at risk. At the primary site, the CTV59.4 was defined as the pGTV plus a 1.0- to 1.5-cm margin. For the node-positive neck, the CTV59.4 encompassed the nGTV and included Levels IB, II, III, IV, V, as well as the retropharyngeal region. For the node-negative neck, the CTV54 included Levels II, III, IV, as well as the retropharyngeal region. In these patients, Levels IB and V were excluded at the discretion of the treating physician. In general, CTV54 included the lymph node areas considered at low-risk for potential microscopic spread.
The PTV70 was defined as the gross tumor plus margin (0.3 cm), the PTV59.4 was defined as the high-risk subclinical disease plus margin (0.3 cm), and the PTV54 was defined as the low-risk subclinical disease plus margin (0.3 cm). Adjacent critical normal structures, including the brainstem, spinal cord, optic nerves, chiasm, parotid glands, mandible, and right and left cochlea were outlined with a 5-mm margin. The subscript numbers denote the dose delivered to the respective contours.
Of the patients, 93% were treated with a dose-painting IMRT technique in which different dose levels were assigned to the various target volumes in a once-a-day regimen. The remaining 7% of patients were treated with an IMRT delayed concomitant boost technique, reflecting our earlier experience with IMRT. Depending on the clinical scenario (17), the lower neck was either included in the IMRT fields or included in a low anterior neck (LAN) field matched to the IMRT fields.
In patients treated with a dose-painting IMRT technique, the median prescribed dose was 70 Gy to PTV70, 59.4 Gy to the PTV59.4, and 54 Gy to PTV54. The median dose per fraction was 2.12 Gy to the PTV70, 1.8 Gy to the PTV59.4, and 1.64 Gy to PTV54. In patients treated with a split-field technique, the median prescribed dose to the LAN was 50.4 Gy in fractions of 1.8 Gy.
Chemotherapy
Among the 340 patients eligible for the study, 323 patients (95%) received concurrent chemotherapy. Table 1 lists the details of the chemotherapy regimens that the patients received.
Table 1.
Patient clinical and disease characteristics
| No. of patients | % of total* | |
|---|---|---|
| Sex | ||
| Male | 293 | 86% |
| Female | 47 | 14% |
| Race/ethnicity | ||
| White | 295 | 87% |
| Black | 18 | 5% |
| Hispanic | 9 | 3% |
| Other/Unknown | 18 | 5% |
| Subsite | ||
| Base of tongue | 162 | 48% |
| Tonsil | 166 | 49% |
| Pharyngeal wall | 8 | 2% |
| Soft palate | 4 | 1% |
| T stage | ||
| T1 | 81 | 24% |
| T2 | 147 | 43% |
| T3 | 62 | 18% |
| T4 | 50 | 15% |
| N stage | ||
| N0 | 25 | 7% |
| N1 | 71 | 21% |
| N2 | 236 | 69% |
| N3 | 8 | 2% |
| AJCC stage | ||
| I | 3 | 1% |
| II | 12 | 4% |
| III | 62 | 18% |
| IV | 263 | 77% |
| Chemotherapy regimen | ||
| Cisplatin | 183 | 54% |
| Cisplain+bevacizumab | 37 | 11% |
| Cetuximab | 43 | 13% |
| Carboplatin+fluorouracil | 35 | 10% |
| Other | 25 | 7% |
| None | 17 | 5% |
Percentages may not add up to 100% because of rounding.
Gross tumor and nodal tumor volume determination
The pGTV and nGTV were calculated using the original GTV contours from clinical treatment plans with our in-house treatment planning system. Two additional patients had preradiotherapy nodal excisions and were excluded from the nGTV analysis. The mean and median pGTV was 42.53 cm3 and 32.79 cm3 (range, 4.10–306.63 cm3), respectively. The mean and median nGTV were 31.58 cm3 and 19.04 cm3 (range, 0.00–442.05 cm3), respectively, where N0 patients were assigned a nGTV of 0 cm3.
Statistical analysis
The OS rate was calculated by the Kaplan–Meier product-limit method. The cumulative incidence of LF, RF, and DMF were calculated with death as a competing risk. The relationship between tumor volumes and OS were evaluated using the Cox proportional hazards models and log-rank tests. LF, RF, DMF, in comparison to tumor volumes were analyzed with competing risks analysis tools with death as a competing risk. All linear covariates (pGTV, nGTV) were dichotomized at median. This statistical approach was chosen because of the right skewness of the tumor volume and small number of events.
The elapsed time to treatment failure or death was calculated from the date of initiation of RT. A neck dissection within 6 months of initiation of RT was considered part of up-front management and was reserved for patients with less than a complete response on either PET/CT, clinical examination, or other imaging. Histologic evidence of disease upon neck dissection was not considered an event if it occurred within 6 months of the start of RT and no subsequent treatment failure resulted.
Survival outcomes were calculated from the date of initiation of RT. All statistical calculations were performed with R.2.11.0 (http://cran.r-project.org).
RESULTS
The stage, based on the AJCC staging system (18), and the clinical and disease characteristics of these patients are summarized in Table 1.
Overall survival
The median follow-up time among surviving patients was 34 months (range, 5–67 months). The 2-year Kaplan-Meier estimated OS was 88.6%, with 95% confidence intervals (CI) of 85.1% to 92.2%. Of the patients, 51 died during the follow-up period.
When dichotomized by pGTV size, the OS rate for the large pGTV (>32.79 cm3) group was 82.7% (95% CI, 76.9–88.9%), whereas the small pGTV (≤32.79 cm3) group was 94.3% (95% CI, 90.7–98.0%) (Fig. 1). Univariate analysis revealed this difference to be significant where large pGTV was predictive of poorer OS (Table 2). In addition, advanced T-stage (T3–4 vs. T1–2) and advanced N-stage (N2–3 vs. N0–1) were also significantly associated with poorer OS upon univariate analysis. On multivariate analysis, large pGTV and advanced N-stage remained associated with poorer OS (Table 2).
Fig. 1.
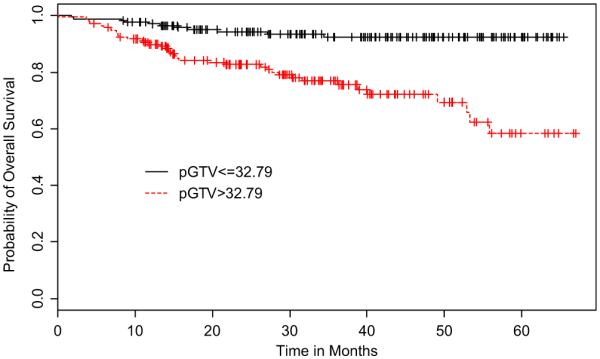
Kaplan–Meier curves of overall survival stratified by primary gross tumor volume (pGTV).
Table 2.
Impact of prognostic factors on overall survival and disease control
| UVA |
MVA* |
|||||
|---|---|---|---|---|---|---|
| Outcome | Factor | Dichotomization | HR | p value | HR | p value |
| OS | pGTV | (>32.79 vs. ≤32.79) | 4.40 | < 0.0001† | 3.74 | 0.0003† |
| nGTV | (>19.04 vs. ≤19.04) | 1.68 | 0.07 | 0.99 | 0.97 | |
| T-stage | (3–4 vs. 1–2) | 2.25 | 0.004† | 1.46 | 0.2 | |
| N-stage | (N2–3 vs. N0–1 | 3.39 | 0.005† | 3.44 | 0.0073† | |
| LF | pGTV | (>32.79 vs. ≤32.79) | 6.01 | 0.004† | ‡ | ‡ |
| T-stage | (T3–4 vs T1–2) | 2.59 | 0.03† | ‡ | ‡ | |
| RF | nGTV | (>19.04 vs. ≤19.04) | 1.55 | 0.36 | ‡ | ‡ |
| N-stage | (N2–3 vs. N0–1) | 6.98 | 0.055 | ‡ | ‡ | |
| DMF | pGTV | (>32.79 vs. ≤32.79) | 3.03 | 0.0008† | 3.01 | 0.0008† |
| nGTV | (> 19.04 vs. ≤19.04) | 1.78 | 0.64 | NS | NS | |
| T-stage | (T3–4 vs. T1–2) | 1.33 | 0.36 | NS | NS | |
| N-stage | (N2–3 vs. N0–1) | 9.42 | 0.002† | 9.24 | 0.002† | |
Abbreviations: DMF = distant metastatic failure; HR = hazard ratio; LF = local failure; MVA = multivariate analysis; OS = overall survival; nGTV = nodal gross tumor volume; pGTV = primary gross tumor volume; NS = not significant; RF = regional failure; UVA = univariate analysis.
Variables with a p value ≤0.10 in univariate analysis were considered for initial multivariate analysis model with backward elimination.
p Values were significant.
Excluded from analysis because of insufficient number of events for MVA to be reliably run.
Local control
The total 2-year cumulative incidence of local failure was 6.1% (95% CI, 3.5–8.7%). Local failure occurred in 20 patients (Table 3). All local failures occurred within 2 years of the start of therapy. The median time to local failure was 8 months (range, 3–18 months). Of the patients with local progression of disease, the tumor subsite was tonsil in 8 patients and base of tongue (BOT) in 12 patients. Of the 20 patients who experienced local failure, 19 were on a concurrent chemotherapy regimen, 9 were on cetuximab monotherapy, 3 were treated by cisplatin only and 2 by carboplatin and fluorouracil, with the remaining 5 on a combination of these and other agents.
Table 3.
Patient outcomes by recurrence site
| n | % | |
|---|---|---|
| LF | ||
| Yes | 20 | 6% |
| No | 320 | 94% |
| RF | ||
| Yes | 18 | 5% |
| No | 322 | 94% |
| DMF | ||
| Yes | 44 | 13% |
| No | 296 | 87% |
Abbreviations: DMF = distant metastatic failure; LF = local failure; RF = regional failure.
When dichotomized by pGTV size, the 2-year LF cumulative incidence rate of large pGTV was 10.4% (95% CI, 5.7–15.1%) and of small pGTV was 1.9% (95% CI, 0.0–4.1%) (Fig. 2). Univariate competing risks regression models showed that large pGTV and advanced T-stage (T3–4 vs. T1–2) were significantly associated with local failure (Table 2). Multivariate analysis was not performed because of the low number of local failure events relative to study cohort.
Fig. 2.
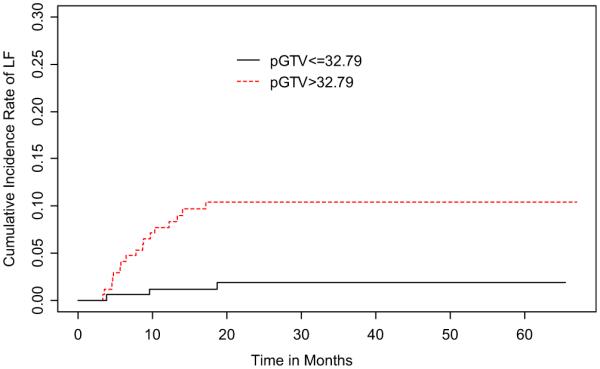
Cumulative incidence rates of local recurrence stratified by primary gross tumor volume (pGTV).
Regional control
The 2-year cumulative incidence of regional failure was 5.2% (95% CI, 2.8–7.6%). Regional failure occurred in 18 patients (Table 3). The median time to regional failure was 8 months from start of RT (range, 4–26 months). Primary tumor was located in the tonsil for 7 patients and in the BOT in 9 patients. Of the 340 patients, 44 underwent post-RT neck dissection. Histologic evidence of residual cancer was identified in 15 of these patients.
When dichotomized by nGTV size, the 2-year RF cumulative incidence of large nGTV (>19.04 cm3) was 6.8% (95% CI, 2.9–10.7%) and of small nGTV (≤ 19.04 cm3) was 3.7% (95% CI, 0.8–6.5%) (Fig. 3). Univariate competing risks regression did not find this difference to be significant (p = NS). However, advanced N-stage (N2–3 vs. N0–1) was determined to trend towards significance with regional failure on the same analysis (p = 0.055).
Fig. 3.
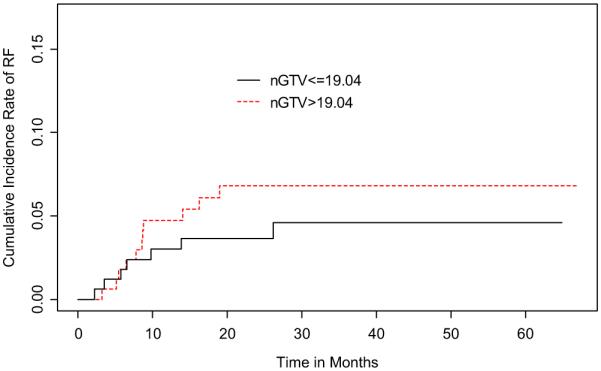
Cumulative incidence rates of regional recurrence stratified by nodal gross tumor volume (nGTV).
Distant metastasis
The 2-year cumulative incidence of distant metastasis was 12.2% (95% CI, 8.6–15.9%). A total of 44 patients had at least one distant metastasis during the period of follow-up. The most common location for distant metastasis was lung (28) followed by bone (9), liver (6), mediastinum (4), skin (2), brain (1), colon (1), and stomach (1).
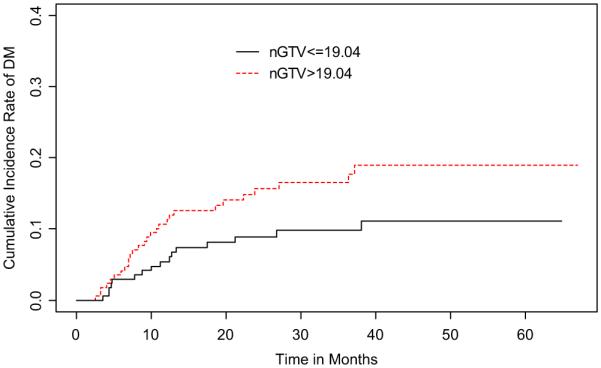
Upon dichotomization of pGTV, the 2-year cumulative incidence rate of DM in large pGTV was 18.7% (95% CI, 12.6–24.8%) and in small pGTV was 5.8% (95% CI, 2.1–9.6%) (Fig. 4). For nGTV dichotomization and DM, the 2-year cumulative incidence rates of large nGTV was 15.6% (95% CI, 9.9–21.4%) and of small nGTV was 8.9% (95% CI, 4.4–13.4%) (Fig. 5). Univariate competing risks regression models showed that patients who presented with large pGTV and advanced N-stage (N2–3 vs. N0–1) had a greater incidence of distant metastasis. These results were confirmed in multivariate analysis (Table 2).
Fig. 4.
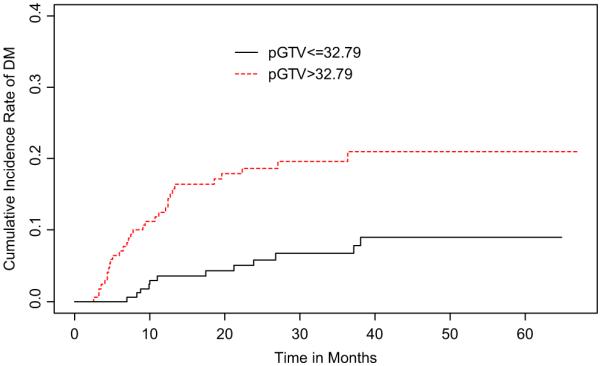
Cumulative incidence rates of distant metastasis stratified by primary gross tumor volume (pGTV).
Fig. 5. Cumulative incidence rates of distant metastasis stratified by nodal gross tumor volume (nGTV).
DISCUSSION
The AJCC staging system for oropharyngeal carcinoma assigns T and N stage according to longest dimension of primary and nodal disease, measured by clinical or radiological examination (2). Because many malignant lesions can be irregularly shaped or sized, this one-dimensional determinant is likely to fail to capture the information that a 3D approach can provide. Advances in radiologic imaging and 3D treatment-planning systems allow accurate quantification of tumor volume.
Within the volumetric studies previously reported for oropharyngeal cancer, much controversy exists (Table 4). Been et al. (12) showed no significant correlation of tumor volume with LRC (p = 0.6244). Mendenhall et al. (4) did not demonstrate significance between primary tumor volume and local control for tumors of the tonsillar fossa/posterior tonsillar pillar (p = 0.0892), base of tongue (p = 0.9493), or anterior tonsillar pillar/soft palate (p = 0.5909). Keberle et al. (10) and Nathu, et al. (11) reported that tumor volume was not correlated with local control (p = 0.19 and p = 0.10, respectively).
Table 4.
Literature on oropharyngeal cancer primary gross tumor volume and disease control
| pGTV |
||||||
|---|---|---|---|---|---|---|
|
p value |
p value |
|||||
| Author | Year | N | RT technique | Patients on CCRT | LC/LRC | DMFS |
| Nathu et al. | 2000 | 114 | 3D-CRT | 11%* | 0.1 | – |
| Mendenhall et al. | 2003 | 190 | 3D-CRT | 4% | 0.0892–0.9493 | – |
| Keberle et al. | 2003 | 80 | 3D-CRT | NR | 0.19 | – |
| Been et al. | 2008 | 79 | 3D-CRT/IMRT | 49% | 0.6244 | – |
| Hermans et al. | 2001 | 112 | 3D-CRT | NR | 0.047 | |
| Chao et al. | 2004 | 31† | IMRT | 55% | 0.03 | 0.03 |
| Struder et al. | 2007 | 85† | IMRT | 75%‡ | <0.001 | – |
| Present study | 2010 | 340 | IMRT | 95% | 0.004 | 0.0008 |
Abbreviations: 3D-CRT = three-dimensional conventional radiotherapy; CCRT = concurrent chemoradiotherapy; DMFS = distant metastasis–free survival; IMRT = intensity-modulated radiation therapy; LC = local control; LRC = locoregional control; NR = not reported; pGTV = primary gross tumor volume.
Patients underwent induction chemotherapy.
Subset of patients included in volumetric analysis.
CCRT rate is based on the total head-and-neck cancer cohort of 172 patients. Numbers in boldface type indicate p-values are statistically significant.
However, we note three studies that conflict with the aforementioned studies by establishing a correlation between pGTV and LRC. Hermans et al. (13) found pGTV to be predictive of local control (p = 0.047). Chao et al. (14) described their experience with a subgroup of 31 patients undergoing definitive IMRT for OPC. A multivariate analysis that showed pGTV was a significant independent factor affecting LRC (p = 0.03) and DMFS (p = 0.03). A study by Studer et al. (15) showed in their oropharyngeal subgroup (n = 85) treated with definitive IMRT that pGTV was correlated with local control (p < 0.001). In the majority of these studies (14, 15), along with the current study, patients underwent higher rates of chemotherapy compared with the studies that showed no correlation between tumor volume and LRC (4, 10–12) (Table 4). Although further study is needed, this suggests chemotherapy may improve LRC in smaller size tumors compared with large volume tumors thereby enhancing the correlation between tumor volume and disease control.
The results of the current study demonstrated a significant relationship between pGTV vs. local and distant control for oropharyngeal squamous cell carcinomas treated with definitive IMRT. However, the current study did not determine that nGTV was correlated with regional failure, likely because of neck dissection as a confounding variable. As expected, N-stage was significantly associated with DMFS and trends toward significance for RC.
To our knowledge, only two published studies have examined nGTV as an independent variable in treatment outcomes. Chao et al. (14) found that nGTV correlated with LRC but not DMFS. Struder et al. (15) used total GTV (as a surrogate for nGTV) and found that total GTV was associated with RC (p = 0.02), but did not test for DMFS because of the low number of events in their OPC subgroup. Interestingly, Chao et al. (14) and the current study show that pGTV is more important than nGTV for predicting DMFS. Ultimately, because of the uncertain predictive ability of nGTV, we believe that further study is needed to assess how nodal tumor volume may impact prognosis and treatment decisions in patients.
The incidence of human papilloma virus (HPV) in OPC has been steadily increasing in incidence (19). Ang et al. (20) showed in 206 of 323 patients with HPV-positive Stage III and IV OPC had an overall survival rate of 82.4% vs. 57.1% in HPV-negative tumors. These data, along with multiple other reports, show superior outcomes for HPV positive disease (20–23). Although we did not collect HPV status on all patients in this series, regarding HPV positivity and tumor volume, there currently is no known relationship between these two prognostic variables. Although it has been suggested that HPV-positive tumors are more likely to have a lower T-stage (24), advanced T-stage is still an independent risk factor for disease recurrence and death (25). This indicates that tumor volume in the present study should be an independent risk factor regardless of HPV status. Ultimately, we believe that an important avenue of future study will be the impact of HPV status on tumor volume.
This present study results add to the growing consensus that primary gross tumor volume in oropharyngeal squamous cell carcinoma is correlated with local and distant control and is a useful predictor of clinical outcomes (Table 4). This information can be useful for the practicing radiation oncologist to consider dose escalation for patients with larger tumor volume or additional systemic therapy to enhance local control as well as combating distant metastases.
CONCLUSIONS
In the current study, we report the IMRT experience of OPC at Memorial Sloan-Kettering Cancer Center and the impact of tumor volume on clinical outcomes. Our results, in this cohort of 340 patients, in which our treatment plans were restorable and allowed us to study the relationship of tumor volume and treatment outcomes, show that pGTV is associated with overall survival and both local and distant control. In addition to the TNM classification, pGTV is recommended to be considered for therapeutic decision making. Further studies are needed to assess the value of implementing a volumetric staging system.
Footnotes
Conflict of interest: none.
This study was presented in part as an abstract at the American Society for Radiation Oncology (ASTRO) 52nd Annual Meeting, San Diego, CA, Oct 31–Nov 4, 2010.
REFERENCES
- 1.Sobin LH, Gospodarowicz MK, Wittekind C, International Union Against Cancer . TNM classification of malignant tumours. 7th Wiley-Blackwell; Hoboken, NJ: 2010. [Google Scholar]
- 2.American Joint Committee on Cancer . AJCC cancer staging manual. Springer; New York: 2009. [Google Scholar]
- 3.Kraas JR, Underhill TE, D’Agostino RB, Jr., et al. Quantitative analysis from CT is prognostic for local control of supraglottic carcinoma. Head Neck. 2001;23:1031–1036. doi: 10.1002/hed.10030. [DOI] [PubMed] [Google Scholar]
- 4.Mendenhall WM, Morris CG, Amdur RJ, et al. Parameters that predict local control after definitive radiotherapy for squamous cell carcinoma of the head and neck. Head Neck. 2003;25:535–542. doi: 10.1002/hed.10253. [DOI] [PubMed] [Google Scholar]
- 5.Hermans R, Van den Bogaert W, Rijnders A, et al. Predicting the local outcome of glottic squamous cell carcinoma after definitive radiation therapy: Value of computed tomography-determined tumour parameters. Radiother Oncol. 1999;50:39–46. doi: 10.1016/s0167-8140(98)00114-5. [DOI] [PubMed] [Google Scholar]
- 6.Chen SW, Yang SN, Liang JA, Tsai MH, Shiau AC, Lin FJ. Value of computed tomography-based tumor volume as a predictor of outcomes in hypopharyngeal cancer after treatment with definitive radiotherapy. Laryngoscope. 2006;116:2012–2017. doi: 10.1097/01.mlg.0000237804.38761.81. [DOI] [PubMed] [Google Scholar]
- 7.Chua DT, Sham JS, Kwong DL, et al. Volumetric analysis of tumor extent in nasopharyngeal carcinoma and correlation with treatment outcome. Int J Radiat Oncol Biol Phys. 1997;39:711–719. doi: 10.1016/s0360-3016(97)00374-x. [DOI] [PubMed] [Google Scholar]
- 8.Pameijer FA, Mancuso AA, Mendenhall WM, et al. Evaluation of pretreatment computed tomography as a predictor of local control in T1/T2 pyriform sinus carcinoma treated with definitive radiotherapy. Head Neck. 1998;20:159–168. doi: 10.1002/(sici)1097-0347(199803)20:2<159::aid-hed10>3.0.co;2-h. [DOI] [PubMed] [Google Scholar]
- 9.Le Tourneau C, Velten M, Jung GM, et al. Prognostic indicators for survival in head and neck squamous cell carcinomas: Analysis of a series of 621 cases. Head Neck. 2005;27:801–808. doi: 10.1002/hed.20254. [DOI] [PubMed] [Google Scholar]
- 10.Keberle M, Hoppe F, Dotzel S, Hahn D. [Prognostic value of pretreatment CT regarding local control in oropharyngeal cancer after primary surgical resection] (in German) Fortschr Röntgenstr. 2003;175:61–66. doi: 10.1055/s-2003-36610. [DOI] [PubMed] [Google Scholar]
- 11.Nathu RM, Mancuso AA, Zhu TC, Mendenhall WM. The impact of primary tumor volume on local control for oropharyngeal squamous cell carcinoma treated with radiotherapy. Head Neck. 2000;22:1–5. doi: 10.1002/(sici)1097-0347(200001)22:1<1::aid-hed1>3.0.co;2-6. [DOI] [PubMed] [Google Scholar]
- 12.Been MJ, Watkins J, Manz RM, et al. Tumor volume as a prognostic factor in oropharyngeal squamous cell carcinoma treated with primary radiotherapy. Laryngoscope. 2008;118:1377–1382. doi: 10.1097/MLG.0b013e318172c82c. [DOI] [PubMed] [Google Scholar]
- 13.Hermans R, Op de Beeck K, Van den Bogaert W, et al. The relation of CT-determined tumor parameters and local and regional outcome of tonsillar cancer after definitive radiation treatment. Int J Radiat Oncol Biol Phys. 2001;50:37–45. doi: 10.1016/s0360-3016(00)01559-5. [DOI] [PubMed] [Google Scholar]
- 14.Chao KS, Ozyigit G, Blanco AI, et al. Intensity-modulated radiation therapy for oropharyngeal carcinoma: Impact of tumor volume. Int J Radiat Oncol Biol Phys. 2004;59:43–50. doi: 10.1016/j.ijrobp.2003.08.004. [DOI] [PubMed] [Google Scholar]
- 15.Studer G, Lutolf UM, El-Bassiouni M, Rousson V, Glanzmann C. Volumetric staging (VS) is superior to TNM and AJCC staging in predicting outcome of head and neck cancer treated with IMRT. Acta Oncol. 2007;46:386–394. doi: 10.1080/02841860600815407. [DOI] [PubMed] [Google Scholar]
- 16.de Arruda FF, Puri DR, Zhung J, et al. Intensity-modulated radiation therapy for the treatment of oropharyngeal carcinoma: The Memorial Sloan-Kettering Cancer Center experience. Int J Radiat Oncol Biol Phys. 2006;64:363–373. doi: 10.1016/j.ijrobp.2005.03.006. [DOI] [PubMed] [Google Scholar]
- 17.Lee N, Mechalakos J, Puri DR, Hunt M. Choosing an intensity-modulated radiation therapy technique in the treatment of head-and-neck cancer. Int J Radiat Oncol Biol Phys. 2007;68:1299–1309. doi: 10.1016/j.ijrobp.2006.11.019. [DOI] [PubMed] [Google Scholar]
- 18.Fleming I, for the American Joint Committee on Cancer, National Cancer Institute (U.S.) AJCC cancer staging manual. 5th Lippincott-Raven; Philadelphia: 1997. [Google Scholar]
- 19.Blomberg M, Nielsen A, Munk C, Kjaer SK. Trends in head and neck cancer incidence in Denmark, 1978–2007: Focus on human papillomavirus associated sites. Int J Cancer. 2011;129 doi: 10.1002/ijc.25699. n/a. [DOI] [PubMed] [Google Scholar]
- 20.Ang KK, Harris J, Wheeler R, et al. Human papillomavirus and survival of patients with oropharyngeal cancer. N Engl J Med. 2010;363:24–35. doi: 10.1056/NEJMoa0912217. [DOI] [PMC free article] [PubMed] [Google Scholar]
- 21.Al-Swiahb JN, Huang CC, Fang FM, et al. Prognostic impact of p16, p53, epidermal growth factor receptor, and human papillomavirus in oropharyngeal cancer in a betel nut-chewing area. Arch Otolaryngol Head Neck Surg. 2010;136:502–508. doi: 10.1001/archoto.2010.47. [DOI] [PubMed] [Google Scholar]
- 22.Nichols AC, Finkelstein DM, Faquin WC, et al. Bcl2 and human papilloma virus 16 as predictors of outcome following concurrent chemoradiation for advanced oropharyngeal cancer. Clin Cancer Res. 2010;16:2138–2146. doi: 10.1158/1078-0432.CCR-09-3185. [DOI] [PubMed] [Google Scholar]
- 23.Rischin D, Young RJ, Fisher R, et al. Prognostic significance of p16INK4A and human papillomavirus in patients with oropharyngeal cancer treated on TROG 02.02 phase III trial. J Clin Oncol. 2010;28:4142–4148. doi: 10.1200/JCO.2010.29.2904. [DOI] [PMC free article] [PubMed] [Google Scholar]
- 24.Mellin H, Friesland S, Lewensohn R, et al. Human papillomavirus (HPV) DNA in tonsillar cancer: Clinical correlates, risk of relapse, and survival. Int J Cancer. 2000;89:300–304. [PubMed] [Google Scholar]
- 25.Sedaghat AR, Zhang Z, Begum S, et al. Prognostic significance of human papillomavirus in oropharyngeal squamous cell carcinomas. Laryngoscope. 2009;119:1542–1549. doi: 10.1002/lary.20533. [DOI] [PubMed] [Google Scholar]


