

Abstract
Natural and synthetic carbamates act as pseudo-irreversible inhibitors of AChE (acetylcholinesterase) as well as BChE (butyrylcholinesterase), two enzymes involved in neuronal function as well as in the development and progression of AD (Alzheimer’s disease). The AChE mode of action is characterized by a rapid carbamoylation of the active-site Ser200 with release of a leaving group followed by a slow regeneration of enzyme action due to subsequent decarbamoylation. The experimental AD therapeutic bisnorcymserine, a synthetic carbamate, shows an interesting activity and selectivity for BChE, and its clinical development is currently being pursued. We undertook detailed kinetic studies on the activity of the carbamate bisnorcymserine with Tc (Torpedo californica) AChE and, on the basis of the results, crystallized the complex between TcAChE and bisnorcymserine. The X-ray crystal structure showed only the leaving group, bisnoreseroline, trapped at the bottom of the aromatic enzyme gorge. Specifically, bisnoreseroline interacts in a non-covalent way with Ser200 and His440, disrupting the existing interactions within the catalytic triad, and it stacks with Trp84 at the bottom of the gorge, giving rise to an unprecedented hydrogen-bonding contact. These interactions point to a dominant reversible inhibition mechanism attributable to the leaving group, bisnoreseroline, as revealed by kinetic analysis.
Keywords: acetylcholinesterase (AChE), Alzheimer’s disease (AD), bisnorcymserine, bisnoreseroline, carbamate, enzyme kinetics, X-ray crystal structure
INTRODUCTION
The frequency of age-related neurodegenerative disorders and, in particular, of AD (Alzheimers’s disease) is expected to greatly rise with the increasing average age of the population. AD symptoms have been associated with a profound and progressive forebrain cholinergic deficiency, linked to a loss of cholinergic neurons and their cortical projections from the nucleus basalis and accompanying areas in the basal forebrain [1]. Such a progressive deterioration of the normally widespread cholinergic innervations of the cerebral cortex contributes to the hallmark AD behavioural and cognitive disturbances, and is associated with declines in levels of the neurotransmitter ACh (acetylcholine), its rate-limiting synthesis enzyme choline acetyltransferase, and its hydrolysing enzyme AChE (acetylcholinesterase) [1–3]. This recognition led to the development and use of AChE inhibitors as the initial and primary treatment for this disease [1,3]. Remarkably, brain levels of an AChE-related enzyme BChE (butyrylcholinesterase), which similarly inactivates ACh [4], become progressively elevated during AD progression and can likewise be considered a therapeutic target [5,6]. Mounting evidence suggests that BChE is involved in regulating normal neuronal function [7,8] and plays a role in the development and progression of AD [4,9], particularly in relation to β-amyloid oligomerization, which impacts the toxicity of this critical AD peptide [10].
The development of new reversible brain-targeted BChE inhibitors was initially made feasible through the synthesis of cymserine analogues [11,12]. Cymserine (1) (Figure 1), a compound designed on the backbone of the natural alkaloid physostigmine, proved to be seven times more selective than the parent compound for human BChE, and 27 times less active as an inhibitor of AChE. Its analogue bisnorcymserine (2) (Figure 1), however, provided a dramatic increase in selectivity between BChE and AChE: compared with 1, it proved 50-fold more potent against BChE but only 7-fold more potent against AChE, providing it with a BChE selectivity of 110-fold compared with 15-fold for 1 [11,12].
Figure 1.

Structures of the carbamates considered in the present study
AChE and BChE are two closely related enzymes, possessing a sequence homology of over 50% [13], their main structural difference being the dimension of an internal catalytic gorge, which in BChE is wider and allows both bulkier compounds to enter it [4,12] as well as their accommodation at the active site at the base of the gorge itself.
The catalytic site of AChE is at the bottom of a deep narrow gorge lined with conserved aromatic residues [14]. It consists of a CAS (catalytic anionic site), responsible for the accommodation of a charged leaving group and an esteratic site where covalent catalysis occurs. At the narrowest point, midway down the gorge, the channel is restricted to only ~5 Å (1 Å = 0.1 nm) width. This bottleneck is formed by Tyr121 and Phe330 [Tc (Torpedo californica) AChE numbering], and in particular this latter residue is known to contribute to the trafficking of molecules in and out of the gorge consequent to the mobility of its side chain, which allows for different conformations, reflected in a wider or narrower passage. It has hence been called a swinging gate and, in previously solved crystallographic structures of complexes between TcAChE and its inhibitors, has been found in an open, a closed or a midway conformation [15]. At the entrance of the gorge itself is situated a further binding spot, termed the PAS (peripheral anionic site). Substrate binding to this site appears to be the first step in the catalytic cycle whereby orientation and channelling occurs, but, additionally, regulation of the entrance and the exit of molecules can occur [16].
Compound 2 belongs to the class of pseudo-irreversible carbamate inhibitors, whose mechanism of action is characterized by a rapid initial carbamoylation of the esteratic site of the enzyme resulting from nucleophilic attack by Ser200 to the carbamate carbonyl group and release of the leaving group, followed by a far slower regeneration of the active enzyme. In the case of 2, the carbamic moiety is represented by the p-isopropylphenyl group, and the leaving group is bisnoreseroline (2a) (Figure 1). Compared with its structural analogues, 1 and its derivatives, 2 is a particularly potent and selective BChE inhibitor [11,17] that provides an AChE inhibitory component and is being developed as the first preferential BChE inhibitor for the treatment of AD on the basis of its ability to improve cognitive performance with a high safety margin in animal models [6]. To elucidate specific structural determinants contributing to its differential BChE versus AChE selectivity as well as to clarify the clearance mechanism, we investigated the kinetic behaviour of 2. In addition, utilizing X-ray crystallography, we analysed the molecular determinants through which the leaving group 2a interacts with TcAChE.
Interestingly, previous studies of the crystal structures of TcAChE complexed with the two pseudo-irreversible carbamate inhibitors MF268 [8-(cis-2,6-dimethylmorpholino) octylcarbamoyl-eseroline] (PDB code 1OCE) [18] and ganstigmine (PDB code 2BAG) [19] demonstrated that the leaving groups, eseroline (1a) (Figure 1) and geneseroline respectively, are not retained within the catalytic pocket of the enzyme, whereas the carbamic moieties, specifically the (cis-2,6-dimethylmorpholino) octyl chain and the 2′-ethylphenyl group respectively, are covalently bound to the Oγ of Ser200. Furthermore, no major conformational changes relative to the native enzyme structure (PDB code 1EA5) [20] were observed after carbamoylation. In the structure with MF268, the alkyl chain of the carbamic group extends along the enzyme gorge so that the morpholinic group interacts with Trp279 at the PAS, thereby blocking the gorge entrance. This result consequently supports the hypothesis of the existence of a different route to allow the clearance of bulky leaving groups. Recent studies [21,22] point to the potential involvement of a further residue, Tyr442, in addition to Trp84 at the bottom of the gorge [23], whose movement could create an opening that would potentially allow bulky groups to escape.
Analysis of the crystal structure of a complex between TcAChE and rivastigmine [24], a clinically approved carbamate cholinesterase inhibitor currently in wide use for the treatment of AD [1,25], revealed the carbamoyl moiety covalently linked to Ser200, but also, as opposed to the two carbamoylated structures discussed earlier, the leaving group NAP {(–)-S-3-[1-(dimethylamino)ethyl]phenol} bound to the anionic site at the bottom of the gorge. This causes a significant movement of His440 that results in the disruption of the catalytic triad formed by Ser200, Glu327 and His440. Rivastigmine is characterized by unusually slow reactivation kinetics, providing it with a long pharmacological duration of inhibitory action [26], and the structural data support the hypothesis that this is due to the synergistic effects of the carbamoyl moiety and the leaving group both being bound within the catalytic site.
In light of the dramatic difference in the binding interactions between AChE and the described carbamate inhibitors, analysis of AChE in complex with a leaving group would provide additional information, and compound 2 appeared to be an appropriate candidate for investigation. With the knowledge that 1a inhibits AChE [27,28], we could predict that 2a would, likewise, act as an inhibitor. Replacement of the N1 and N8 methyl groups of 1a with two hydrogens would be expected to increase the basic nature of these nitrogens, increasing the hydrogen-bonding potential of 2a compared with 1a, and allowing it to be more strongly attracted to the active site [11,12]. We therefore hypothesized that, after TcAChE carbamoylation and reactivation, the leaving group could, on its own, interact at the catalytic site. Furthermore, we knew from structure–activity relationship studies carried out on geneserine analogues [19] that derivatization of the C-4 of the phenyl ring of the carbamic moiety causes an unfavourable binding due to steric hindrance and hence could result in faster decarbamoylation. However, before undertaking the crystallization experiments it was necessary to establish the kinetics of the reaction of AChE with 2 and determine the inhibition and reactivation constants.
MATERIALS AND METHODS
Kinetic studies
A thorough kinetic analysis encompassing the following seven experiments was undertaken. All kinetic experiments were performed at 25°C, in 25 mM phosphate buffer, pH 7.
(i) Titration of TcAChE active sites
The exact concentration of the active sites of TcAChE was evaluated though enzyme inhibition by the transition state analogue TMTFA [m-(N,N,N-trimethylammonio)-2,2,2-trifluoro-1,1-dihydroxyethyl-benzene]. TMTFA (Calbiochem) is an extremely tight-binding inhibitor and therefore it can be assumed that its reaction with TcAChE follows the simple reaction scheme:
The time course of the residual enzymatic activity (until no further activity change can be detected) was measured in the presence of three different, but similar, concentrations of TMTFA and TcAChE. The fit by non-linear regression of the differential equations (Supplementary Scheme S1 at http://www.BiochemJ.org/bj/444/bj4440269add.htm) to the three datasets allowed the active enzyme concentration to be evaluated [29].
(ii) Hydrolysis of ASCh (acetylthiocholine) by TcAChE
A wide range of substrate concentrations (1 μM–0.2 M) was exploited in order to ascertain all relevant steps in the TcAChE catalytic process and the corresponding kinetic parameters. For the overall kinetic analysis, a seven-intermediate reaction scheme, at first established to illustrate the hydrolysis of ASCh by Drosophila melanogaster AChE, was applied [30]. This model was confirmed to be applicable to Tc and Electrophorus electricus AChEs [16,31]. The initial rate for the hydrolysis of ASCh by cholinesterase enzyme proceeds according to a Michaelis–Menten-like equation (eqn 1; see below). The kinetic parameters were evaluated by simultaneous fit of this equation and its general polynomial form to the data by non-linear regression [16].
(iii) Inhibition of TcAChE by 2
Aiming to obtain rapid kinetic measurements, TcAChE enzymatic inhibition in the presence of excess concentrations of 2 was monitored on a SF/PQ-53 stopped-flow apparatus (Hi-tech). This procedure was exploited in order to reliably answer the following two questions: (i) is there an instantaneous effect on the TcAChE enzymatic activity by 2; and (ii) the exact time course of product release at different concentrations of 2. Both questions can consistently be addressed only by monitoring the reaction shortly after mixing the reactants. Additionally, measurements in the presence of 2 must be carried out within the linear component of the progress curve, as obtained in the absence of 2. Therefore the concentration of the TcAChE used was 0.95 nM and the concentrations of 2 were 0, 15, 35, 75 and 180 μM respectively. The inhibition was monitored over a time course of 500 s at 0.5 mM ASCh.
(iv) Reactivation of inhibited TcAChE
Enzyme reactivation was monitored using a conventional spectrophotometer, following dilution. It is well known that the decarbamoylation of the TcAChE catalytic serine proceeds over hours. One method to analyse the decarbamoylation process is to dialyse the incubation mixture of enzyme and carbamate. This can simply be achieved by diluting a solution in which the steady-state concentration of the carbamoylated enzyme is in great excess with respect to the non-carbamoylated one. In the reactivation experiments, the enzyme is at first incubated for 45 min with an approximately 10-fold excess concentration of 2. Then an aliquot of the incubation mixture is diluted 300 times, the substrate (0.5 mM ASCh) and Ellman’s reagent [5,5′-dithiobis-(2-nitrobenzoic acid)] (0.66 mM) are added, and the time course of the product formation is monitored for 1–2 h. To avoid depletion of the substrate during the course of the measurements, the concentration of the enzyme after dilution was ~0.1 nM.
(v) Time course of residual enzymatic activity
In order to monitor the complete reaction in a single experiment, the time course of the residual enzymatic activity was measured subsequent to different pre-incubation times, with approximately equimolar concentrations of TcAChE and 2. In the case of reversible inhibitors, the concentrations of the free enzyme and of the complex will time-dependently equilibrate. On the contrary, irreversible inhibitors will eventually poison all of the enzyme unless the latter is in excess. In the case of cholinesterase enzyme and carbamate-based inhibitors, however, the latter react as poor substrates due to their very slow deacylation step. When such a compound reacts at an equimolar concentration with cholinesterase, only one molecule should be hydrolysed per enzyme molecule. Measurement of the residual enzyme activity under these conditions solves two problems. On one hand, at such high concentrations (approximately 0.2–1.2 μM) the complex formation occurs at a high rate and on the other, during the activity measurements, performed after 300-fold dilution, putative reversible complexes with products and/or remaining non-hydrolysed carbamate will instantaneously dissociate. Under these conditions, the time course of residual AChE activity will first decrease and then, upon consumption of all of the carbamate, will again reach the initial value. In the dilution experiments, the TcAChE enzyme and 2 were mixed at several combinations that approached equimolar concentrations in the range 0.2–1.2 μM.
(vi) Inhibition of TcAChE by ‘aged’ solutions of 2
Spontaneous degradation of 2 was checked by preparing solutions of approximately 2 nM TcAChE and 0.15 mM of 2. Aliquots of 300 μl were mixed; ASCh and DTNB (Ellman’s reagent) were added to final concentrations of 0.5 mM and 0.33 mM respectively, and colour development was monitored for 10 min. These measurements were repeated after 3 and 25 h respectively. Product formation in the absence of the inhibitor was always measured prior to inhibition measurements. All curves were normalized to the curves at zero time.
(vii) Inhibition of ASCh hydrolysis by TcAChE in the presence of 2a
In order to compare the shape of the progress curves measured in the presence of 2, the inhibition by 2a of ASCh hydrolysis by TcAChE was monitored over the time course of 500 s. The concentration of the TcAChE used was 1.45 nM and the concentrations of 2a were 0, 2.5, 3.5, 7.5 and 18.0 μM. Since all curves were linear along their whole lengths, it was feasible to exploit the initial rate of ASCh hydrolysis by TcAChE in the presence of 1 μM and 10 μM 2a. The ASCh concentrations used were between 50 μM and 50 mM, i.e. in the interval where all of the relevant information of the action of 2a could be observed. The data analysis was performed by fitting the initial-rate equation for the exclusive binding of either ASCh or 2a simultaneously to the PAS and the CAS (see Supplementary Scheme S1 and the equations therein), to the three initial-rate curves. The actual events in the inhibition process were evaluated according to the basic principles of kinetic analysis.
Initial-rate data analysis in the absence and presence of 2a
Data gathered in the experiments (ii) and (vii) were obtained on the basis of the classical initial-rate measurements of ASCh hydrolysis by TcAChE in the absence as well as in the presence of the leaving group 2a. The data were thoroughly analysed following the previously described [16] reaction scheme (Supplementary Scheme S1) which presumes the existence of a fully occupied active-site gorge as the underlying rational for the well-known substrate inhibition observed in cholinesterases. It is noteworthy that this scheme has also been assessed by X-ray crystallography to gain insights into substrate traffic and inhibition of TcAChE in complex with 500 mM ASCh. In the extended Supplementary Scheme S1, which includes the inhibitor 2a, the latter was allowed to compete, at both the PAS and the CAS, with the substrate ASCh. Interestingly, the analysis revealed that 2a can occupy simultaneously both PAS and CAS of the free enzyme (species IEI in Supplementary Scheme S1), but only the PAS of the acetylated enzyme (species IEA in Supplementary Scheme S1).
The initial-rate equation derived from Supplementary Scheme S1 using mixed equilibrium and steady-state assumptions is:
| (1) |
where:
| (2) |
| (3) |
| (4) |
| (5) |
In eqns (1–5), [S] and [I] represent the substrate and inhibitor concentrations respectively and [E]0 is the total enzyme concentration.
Simultaneous analysis of time resolved data in the absence and presence of 2
The time-resolved experiments described in (iii–v) were carried out at only one substrate concentration (0.5 mM ASCh). As the activity of TcAChE at this substrate concentration is close to optimum (Supplementary Figure S1 at http://www.BiochemJ.org/bj/444/bj4440269add.htm), the depletion of the substrate during the inhibition and reactivation progress curve measurements can be neglected. The inspection of these progress curves, together with those obtained from the residual activity measurements described in (vi), allows the overall kinetic information to be summarized in the comprehensive reaction Scheme 1.
Scheme 1. Reaction scheme for the hydrolysis of compound 2 by TcAChE in the presence of 0.5 mM ASCh.

E is TcAChE, EA is the acetylated enzyme, EC is the reversible enzyme–2 complex and EC* is the carbamoylated enzyme. S is ASCh, P1 is thiocholine, P2 is the acetate, C is 2, LG (leaving group) is 2a and C.A. is the 4-isopropylphenyl carbamic acid moiety (Figure 1).
In Scheme 1, due to the single substrate concentration used (0.5 mM ASCh), the substrate hydrolysis is represented by the simple Van Slyke–Cullen reaction pathway, which utilizes only two kinetic parameters: the apparent constant kcat and the apparent specificity constant (kcat/Km). These two parameters were calculated using eqns (2) and (3) from the evaluated kinetic parameters for the ASCh hydrolysis by TcAChE (Supplementary Table S1 at http://www.BiochemJ.org/bj/444/bj4440269add.htm). The evaluated constants Ki, k1 and k2 are listed in Table 1. The remaining part of Scheme 1 is related to the reaction with the carbamate 2, which proceeds according to the well-known double-intermediate reaction scheme for substrate hydrolysis by cholinesterases. The first reversible step is assumed to be in equilibrium, in agreement with the varying initial rates of the progress curves, as obtained by stopped-flow measurements. It is assumed that the detection reaction is not a rate-limiting step in the time scale used.
Table 1.
Characteristic constants for the hydrolysis of compound 2 by TcAChE according to the reaction in Scheme 1
| Constant | Value |
|---|---|
| Ki | 1.2 ± 0.24 μM |
| k1 | 0.0068 ± 0.0002 s−1 |
| k2 | 0.000176 ± 3×10⁻⁶s−1 |
The evaluation of Scheme 1 and of the characteristic reaction parameters was carried out by simultaneous fit of the specific differential equations to all of the three sets of inhibition, reactivation and residual activity progress curves, using a nonlinear regression algorithm [29,32]. An appropriate weighting factor was applied to the residual activity data with respect to the product formation progress curve data.
Crystallization and structure determination
TcAChE was extracted, purified and crystallized as described previously [33]. Owing to its relatively limited solubility in water, bisnorcymserine tartrate was dissolved in DMSO (100 mM) and subsequently mixed with a solution of 100 mM Mes, pH 6.2, and 44% PEG [poly(ethylene glycol)] 200 so as to have a 10 mM concentration of the inhibitor, into which the TcAChE crystals were transferred and left to soak for 26 h at 4 °C (the final inhibitor concentration was 5 mM).
X-ray diffraction data were collected at the XRD-1 beam line of the Italian synchrotron light laboratory ELETTRA (Trieste, Italy). A MarCCD (charge-coupled device) detector (Mar U.S.A.) and focusing optics were employed for the measurements. The crystals were flash-cooled in a nitrogen stream at 100 K using an Oxford Cryosystems cooling device. Data processing was undertaken with DENZO, SCALEPACK [34] and the CCP4 package [35]. The enzyme-inhibitor structures were determined by Patterson search methods using the refined co-ordinates of the native TcAChE structure [36] (PDB code 1EA5 [20]) after removal of the water molecules. Crystallographic refinement of the complex was performed with CNS version 1.3 [37,38] and all of the data within the resolution range were included with no σ cut-off. Bulk solvent correction and anisotropic scaling were applied. The Fourier maps were computed with σA-weighted (2Fo − Fc, Φc) and (Fo − Fc, Φc) coefficients [39] after initial refinement of the native protein by simulated annealing (at a maximum temperature of 2000 K) followed by maximum likelihood positional and individual isotropic temperature factor refinements. A prominent electron density feature in the catalytic gorge allowed unambiguous fitting of 2a. Carbohydrates (N-acetyl β-D-glucosamine linked at Asn59 and Asn416) were built in by inspecting electron density maps. Peaks in the difference Fourier maps greater than 2.5 σ were automatically added as water molecules to the atomic model and retained if they met stereochemical requirements and the B factor was less than 75 Å2 after refinement. Map inspection and model correction during refinement were based on the graphics program O [40]. The crystal parameters, data collection and refinement statistics are summarized in Supplementary Table S2 (at http://www.BiochemJ.org/bj/444/bj4440269add.htm). Structure alignments were performed using the program LSQMAN [41]. Figures were created using PyMOL (http://www.pymol.org) [42].
Atomic co-ordinates and structure factor amplitudes of the TcAChE–2a complex have been deposited in the Brookhaven Protein Databank under PDB ID code 3ZV7.
RESULTS AND DISCUSSION
Kinetic studies
The time course of residual enzyme activity in the presence of three different TcAChE active-site concentrations, 110, 165 and 220 nM, approximately equimolar to the concentration of TMTFA, was measured (Supplementary Figure S1). Residual activity was measured as initial rate after the incubation mixture was diluted 300-fold in the presence of 0.5 mM ASCh. The conversion between initial rates and residual enzyme concentration denotes that a 1 nM concentration of TcAChE active sites gives an initial rate of 0.640 absorbance units/min when a 0.5 mM substrate concentration is used (for details see [29]).
In order to determine the apparent kcat and the apparent specificity constant (kcat/Km) of TcAChE for ASCh, required for further analysis, we measured the initial enzyme rates for the hydrolysis of the substrate at different concentrations (Supplementary Figure S2 at http://www.BiochemJ.org/bj/444/bj4440269add.htm). The addition of new data points into our current database [16] had practically no influence on the previously determined parameters for the reaction between ASCh and TcAChE. Since the chosen substrate concentration resulted in optimal enzyme activity, depletion of the substrate during the time course measurements has no significant impact on the interpretation of inhibition experiments (Supplementary Figure S3 at http://www.BiochemJ.org/bj/444/bj4440269add.htm).
It is noteworthy that the obtained kcat values agree with those previously reported in a kinetic study performed under identical experimental conditions [16], but are 10-fold lower than those obtained from kinetic studies carried out under different experimental conditions [43,44].
The results suggest that an instantaneous addition complex between TcAChE and 2 is formed prior to the slow, virtually irreversible, inhibition. However, the time course of product formation after a long pre-incubation time (45 min) of TcAChE with 2 and upon dilution shows a marked reactivation (Supplementary Figure S4 at http://www.BiochemJ.org/bj/444/bj4440269add.htm). Moreover, the analysis of these curves reveals a common reactivation rate. To summarize the two types of experiments in a comprehensive reaction scheme and to verify it, measurements of the residual enzyme activity after different pre-incubation times at approximately equimolar enzyme and 2 concentrations were performed [45]. The curves display a double pattern, with the lowest residual activity, proportional to the free enzyme active-sites concentration, after approximately 20 min of pre-incubation. Scheme 1 is the simplest one that can account for all of the observed phenomena. The simultaneous analysis, using scheme-specific differential equations, yields a set of kinetic parameters that excellently reproduce all data (Supplementary Figure S5 at http://www.BiochemJ.org/bj/444/bj4440269add.htm).
Figure 2 shows the inhibition of AChE with ‘aged’ solutions of 2; in particular, the inhibition was measured immediately after preparing a fresh inhibitor solution, and after 3 h and 25 h of solution aging respectively. The reference curve without inhibitor is linear, whereas all three curves in the presence of the inhibitor are concaved downwards.
Figure 2. TcAChE inhibition.

Time course of TcAChE inhibition by an ‘aged’ solution of 2 measured on a conventional spectrophotometer. The initial concentration of 2 was 75 μM in the presence of 0.5 mM ASCh. Aging times are noted in the panel. The curves, measured after 3 h and 25 h respectively, were normalized according to the curve in the absence of 2, measured at each time. During the inhibition measurements, the concentrations of 2 and of the enzyme used were half the concentrations of the aged solutions.
However, it is apparent that the curvature is less and less pronounced as the solution of 2 becomes aged, showing that more and more inhibitor is cleaved in phosphate buffer, pH 7.0. Furthermore the initial rate, represented by the tangent at zero time, is slightly decreasing with time. This means that the older the inhibitor solution, the lower are the initial rates, pointing to an increased reversible inhibition. However, when the aged solution of 2 is used, more product is formed during the same time period, which indicates a reduced inhibition of TcAChE due to the carbamoylation of the catalytic serine. This apparent contradiction can be explained if one considers the co-existence of two different inhibition mechanisms, achievable in the presence of both 2 and 2a. In this regard, as the solution gets older and increasingly more 2 is hydrolysed, the instantaneous reversible inhibition caused by 2a prevails when the inhibitor solution is mixed with the enzyme. However, since the concentration of 2 is decreasing, less carbamoylated (covalent) intermediate can be formed and, within 10 min, compared with the previously measured curves, more thiocholine is released.
The kinetic results confirm that 2 reacts with the enzyme as a pseudo-irreversible inhibitor, in a way typical of carbamates, through quick formation of an addition complex followed by a covalent active-site serine conjugate (acyl-enzyme) and subsequent slow decarbamoylation. However, when the kinetic experiments were performed using a 25 h aged solution of 2, a reversible inhibition mechanism could be detected that is dependent on the chemical hydrolysis of 2 over that time. It is also clear from the curves in Supplementary Figure S5 that this inhibition is instantaneous, pointing to a better affinity for TcAChE of 2a over 2.
To prove this hypothesis we investigated the inhibition of TcAChE by 2a, synthesized as enantiomerically pure (−)-bisnoreseroline. The hydrolysis of 0.5 mM ASCh by TcAChE in the presence of various 2a concentrations (0, 1.5, 3.5, 7.5 and 18.0 μM) shows linear progress curves with decreasing slopes as the concentration of 2a increases (Supplementary Figure S3A). This result clearly points to a classical instantaneous inhibition and shows 2a to have approximately 10-fold better affinity than 2. Initial rate experiments at 1 μM and 10 μM concentrations of 2a were carried out using a wide range (50 μM–50 mM) of ASCh concentrations. The analysis revealed that the best agreement was achieved applying the reaction model that takes into account both binding sites (PAS and CAS) as shown in Supplementary Scheme S1. The scheme also contemplates the existence of a ternary complex formed by two 2a molecules simultaneously bound into the gorge of the free TcAChE, but not into the gorge of the acetylated enzyme. It turned out that the affinity of 2a (277 nM) at the bottom of the gorge, as established by the present crystal structure determination, is higher than the affinity at the PAS (352 nM). On the other hand, as soon as 2a binds at the PAS, it blocks both acetylation (d = 0.16) as well as deacetylation (c = 0.8) of TcAChE when ASCh is used as substrate (see Supplementary Table S1).
Crystal structure of the TcAChE–2a complex
The results obtained from the kinetic analysis confirm that 2a, similar to 1a, indeed possesses its own inhibitory activity against AChE, and that, whether produced enzymatically or not, it binds, showing an even slightly higher affinity than 2. We therefore simulated the development of the residual enzyme activity within the drop at crystallization conditions and were able to predict that in the event that we wished to capture, i.e. not the carbamoylated form of the enzyme, but the leaving group caught within the gorge, we would have to soak the crystal for at least 20 h (Figure 3). Hence we soaked the crystals of TcAChE for 26 h in a solution of 2 and, thereafter, determined the structure at 2.26 Å resolution.
Figure 3. Time course simulation of residual TcAChE enzyme activity.

Simulated time course of residual TcAChE enzyme activity, as a result of the hydrolysis of 2 by TcAChE present in the crystalline state as well as in the mother liquor of the crystallization drop, during long-term soaking. The estimated TcAChE concentration in the mother liquor was 0.25 mM, whereas the added concentration of 2 was 10-fold higher. For the simulation, the proposed reaction model and the evaluated kinetic parameters from Table 1 and Supplementary Table S1 at http://www.BiochemJ.org/bj/444/bj4440269add.htm were used. Note that when the hydrolysis approaches its completion, the residual activity sharply increases.
Analysis of the electron density maps with coefficients (2Fo − Fc) and (Fo − Fc) computed at the end of the refinement procedure revealed within the active site the presence of 2a, positioned at the bottom of the gorge (Figure 4), forming contacts with Ser200, His440 and Trp84, with an orientation similar to the one observed for the inhibitor tacrine in complex with TcAChE (PDB code 1ACJ) [46].
Figure 4. Close-up view of the of active site of TcAChE in complex with 2a.
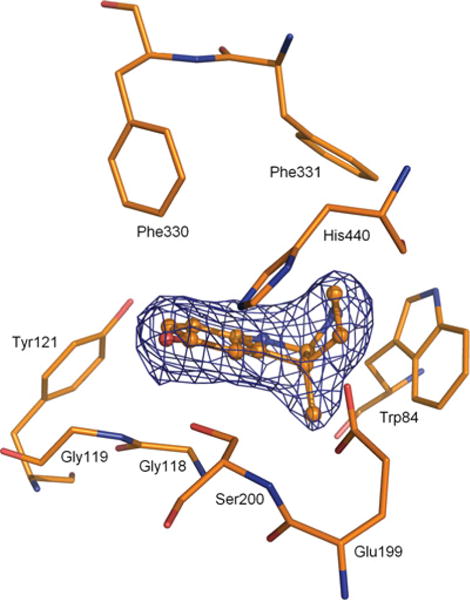
The final 2Fo−Fc σA-weighted electron density map, carved around 2a, is contoured at 1.2 σ. 2a is rendered as a ball and-stick model with carbon, oxygen and nitrogen atoms coloured orange, red and blue respectively. Selected key protein residues in the vicinity of 2a are rendered in stick format and labelled appropriately.
More interesting, however, is the comparison with the crystal structures of the TcAChE–rivastigmine conjugate (PDB code 1GQR) [24] as well as with the structure of the TcAChE–NAP complex (PDB code 1QQS) [24], where NAP is the leaving group of rivastigmine (Figure 5). The phenolic oxygen of 2a forms a hydrogen bond with Ser200 Oγ (2.76 Å) and His440 Nɛ2 (2.97 Å) (Figure 4), thus disrupting the hydrogen bond that exists, in the native enzyme, between these two amino acids of the catalytic triad. In the TcAChE–NAP complex, the phenolic oxygen of the NAP moiety is engaged instead in a 2.73 Å hydrogen bond with Glu199 Oɛ1. In the TcAChE–2a and TcAChE–NAP complexes, the χ1 angle of the freed Ser200 is rotated by 27.3° and 26.9° relative to its position in the native TcAChE crystal structure [20] respectively. As a consequence, the distance between Ser200 Oγ and His440 Nɛ2 increases from 2.96 Å in the native structure to 3.73 Å and 3.74 Å, in the TcAChE–NAP and TcAChE–2a complexes, respectively. The position of the His440 imidazole ring in the TcAChE–2a complex is very similar to the one in the TcAChE–NAP complex and in the native TcAChE structure, with distances between His440 Nδ1 and Glu327 Oɛ1 and between His440 Nδ1 and Glu199 Oɛ2 of 2.80 Å, 2.67 Å, 2.57 Å and 3.81 Å, 3.59 Å, 3.78 Å respectively. Thus binding of 2a produces no significant movement of the catalytic histidine. A comparison of the TcAChE–2a complex with that of the TcAChE–rivastigmine conjugate reveals a substantial change in the position of the imidazole ring of the catalytic His440. Thus the distance between His440 Nδ1 and Glu327 Oɛ1 increases from 2.80 Å to 4.02 Å, whereas the distance between His440 Nδ1 and Glu199 Oɛ2 decreases concomitantly from 3.81 Å to 2.85 Å. Moreover, the position of the main chain Cα carbon atom of His440 in the TcAChE–rivastigmine conjugate moves by 0.62 Å relative to its position in the native structure, whereas in the TcAChE–NAP and TcAChE–2a complexes it moves by only 0.10 Å and 0.20 Å respectively.
Figure 5. Comparison of the orientation of the ligands in the TcAChE–2a complex, the TcAChE–rivastigmine conjugate and the TcAChE–NAP complex.

(A) The phenolic oxygen of 2a is positioned to make two hydrogren bonds (broken lines) with Oγ and Nɛ2 of Ser200 and His440 respectively, and the pyrrolic nitrogen of 2a is engaged in a N–H ⋯ π hydrogen bond contact with Trp84. Selected key protein residues are rendered in stick format (carbon atoms coloured green) and labelled appropriately. (B) An overlay of the active-site gorge in the three structures is presented. The inhibitors and the selected protein residues are rendered in stick format. The TcAChE–2a complex, the TcAChE–rivastigmine conjugate (PDB code 1GQR) and the TcAChE–NAP complex (PDB code 1QQS) are coloured magenta, cyan and green respectively. The colour scheme of 2a is as in Figure 4.
The orientations of Trp84 and of the residues in the oxyanion hole and in the acyl pocket, in the TcAChE–2a and TcAChE–NAP complexes, and the TcAChE–rivastigmine conjugate, are similar to their orientations in the native enzyme. In the TcAChE–2a complex, the pyrrolic ring of 2a is stacked against Trp84, with an N–H ⋯ π hydrogen bonding contact [47] of 3.11 Å between the nitrogen atom (donor) and Cδ2 of the indole ring (acceptor), which to our knowledge represents an example of a not previously reported interaction in TcAChE–inhibitor complexes. In the TcAChE–rivastigmine conjugate, the phenyl ring of the NAP moiety is stacked against the indole ring of Trp84 and orientated in a herringbone fashion with respect to the phenyl ring of Phe330. In the TcAChE–NAP complex, the NAP moiety is positioned approximately at the same location as in the TcAChE–rivastigmine conjugate, but in a different orientation. The π ⋯ π interactions of NAP with Trp84 and Phe330 are retained. The orientation of the Phe330 phenyl ring, which shows a high degree of conformational variability [15], undergoes, in the TcAChE–2a complex and in the TcAChE–rivastigmine conjugate, minor rotations of 4.5° and 9.7°, and of 3.0° and 7.9°, respectively of its χ1 and χ2 angles. Instead, in the TcAChE–NAP complex, substantial rotations of 48.7° and 39.7° relative to the native structure are observed. Furthermore, in the TcAChE–2a complex, the indolic nitrogen of 2a forms a strong hydrogen bond (2.76 Å) with water molecule W2099, which, in turn, is engaged in hydrogen bonding with Ser122 Oγ (2.81 Å) and with water molecules W2066 (2.67 Å) and W2068 (3.21 Å), respectively.
Finally within the structure, the presence of some highly conserved water molecules [48] was observed. Additionally, a pentamer fragment of PEG was detected that stretches along the gorge and reaches Trp279, analogous to the PEG fragment found within the structures of the complex TcAChE–galanthamine (PDB codes 1QTI [49] and 1DX6 [50]) as well as the complex TcAChE–ganstigmine (PDB code 2BAG) [19].
The experimental data from the present study provide novel kinetic and structural insights into the interaction of 2 with TcAChE. We found that, with a k2 of 0.011 min−1 (Table 1) and t1/2 of 63 min, the decarbamoylation of the TcAChE–2 conjugate, although comparable with that of TcAChE–physostigmine (rate constant of 0.02 min−1 and t1/2 of 40 min [51]), is fast compared with the one of the TcAChE–rivastigmine [24] and TcAChE–MF268 [51] conjugates, which are the most refractory to reactivation. Overall, the kinetic experiments fully support and clarify the X-ray crystallography findings: 2 reacts with Ser200 in the active site of TcAChE and, following enzyme reactivation, a stable and reversible complex with the leaving group 2a is formed.
A model of the carbamoylated TcAChE–2 conjugate was built by replacing the 2-ethyl phenyl moiety in the TcAChE–ganstigmine conjugate (PDB code 2BAG) [19], used as template, with the 4-isopropyl phenyl moiety.
The isopropyl group of the substituent at position 4 of the phenyl ring shows unfavourable close contacts (2.3 Å–3.3 Å) with the Oη of Tyr121. The side chain conformation of the swinging gate residue Tyr121, in contrast with that of Phe330, appears to be fixed in TcAChE crystal structures [15]. This result confirms what had already been pointed out by the analysis of the interactions between the carbamic moiety in the structure of the TcAChE–ganstigmine complex, where the distances of C-4 of the phenyl ring of the 2′-ethylphenyl group were 3.16 Å and4.37 Å apart from the Oη of Tyr121 and the carbonyl oxygen of Gly118 respectively. Accordingly, the IC50 value for TcAChE inhibition in vitro of an analogue of geneserine methylated at position 4 of the phenyl ring (compound 8, see Figure 1 in [19]), was lower (7.61 μM) than the parent compound (1.71 μM).
The overlay of the model of the carbamoylated TcAChE–2 conjugate and of the crystallographic structure of the full-length recombinant human BChE (PDB code 2PM8) [52] [rmsd (root mean square deviation) of 0.78 Å], provides a structure-based rationale for the 110-fold selectivity of 2 for BChE defined as IC50 (human plasma AChE)/IC50 (human erythrocyte BChE) [11]. In fact, Tyr121 in TcAChE is structurally replaced in human BChE by Gln119, which allows the relaxation of the clashes observed in the model discussed above (Supplementary Figure S6 at http://www.BiochemJ.org/bj/444/bj4440269add.htm). Interestingly, the flexible side chain of Gln119 shows the same orientation in all 29 crystal structures of human BChE deposited in the PDB, but is opposite to the one observed for the side chain of Tyr121 in the TcAChE crystal structures.
Supplementary Material
Acknowledgments
We are grateful to the staff of the XRD-1 beamline at ELETTRA, Sincrotrone Trieste S.C.p.A., Trieste, Italy for assistance during the data collection. We thank Professor Israel Silman, Weizmann Institute of Science, Rehovot, Israel, for the gift of a TcAChE sample used for the enzyme kinetics studies.
FUNDING
This research was supported in part by the Istituto di Cristallografia, Consiglio Nazionale delle Ricerche, Roma, Italy, the Slovenian Research Agency [grant number P1-0170], the Intramural Research Program, National Institute on Aging, National Institutes of Health, U.S.A., and the Istituto di Cristallografia, Consiglio Nazionale delle Ricerche, Trieste, Italy.
Abbreviations
- AD
Alzheimer’s disease
- ACh
acetylcholine
- AChE
acetylcholinesterase
- ASCh
acetylthiocholine
- BChE
butyrylcholinesterase
- CAS
catalytic anionic site
- MF268
8-(cis-2,6-dimethylmorpholino) octylcarbamoyl-eseroline
- NAP
(−)-S-3-[1-(dimethylamino)ethyl]phenol
- PAS
peripheral anionic site
- PEG
poly(ethylene glycol)
- rmsd
root mean square deviation
- Tc
Torpedo californica
- TMTFA
m-(N,N,N-trimethylammonio)-2,2,2-trifluoro-1,1-dihydroxyethylbenzene
Footnotes
The structural co-ordinates reported will appear in the PDB under accession code 3ZV7.
AUTHOR CONTRIBUTION
Cecilia Bartolucci designed and performed the crystallographic study. Jure Stojan designed and carried out the inhibition studies, and analysed the kinetic data. Qian-sheng Yu and Nigel Greig synthesized bisnorcymserine and bisnoreseroline. Doriano Lamba coordinated the work and participated in the interpretation of the structural data. Cecilia Bartolucci, together with Jure Stojan and Doriano Lamba, wrote the paper. All authors contributed to revising and improving the final version of the paper prior to submission.
References
- 1.Francis PT, Ramírez MJ, Lai MK. Neurochemical basis for symptomatic treatment of Alzheimer’s disease. Neuropharmacology. 2010;59:221–229. doi: 10.1016/j.neuropharm.2010.02.010. [DOI] [PubMed] [Google Scholar]
- 2.Pepeu G, Giovannini MG. Cholinesterase inhibitors and beyond. Curr Alzheimer Res. 2009;6:86–96. doi: 10.2174/156720509787602861. [DOI] [PubMed] [Google Scholar]
- 3.Lahiri DK, Rogers JT, Greig NH, Sambamurti K. Rationale for the development of cholinesterase inhibitors as anti-Alzheimer agents. Curr Pharm Des. 2004;10:3111–3119. doi: 10.2174/1381612043383331. [DOI] [PubMed] [Google Scholar]
- 4.Darvesh S, Hopkins DA, Geula C. Neurobiology of butyrylcholinesterase. Nat Rev Neurosci. 2003;4:131–138. doi: 10.1038/nrn1035. [DOI] [PubMed] [Google Scholar]
- 5.Greig NH, Lahiri DK, Sambamurti K. Butyrylcholinesterase: an important new target in Alzheimer’s disease therapy. Int Psychogeriatrics. 2002;14:77–91. doi: 10.1017/s1041610203008676. [DOI] [PubMed] [Google Scholar]
- 6.Greig NH, Utsuki T, Ingram DK, Wang Y, Pepeu G, Scali C, Yu QS, Mamczarz J, Holloway HW, Giordano T, et al. Selective butyrylcholinesterase inhibition elevates brain acetylcholine, augments learning and lowers Alzheimer β-amyloid peptide in rodent. Proc Natl Acad Sci USA. 2005;102:17213–17218. doi: 10.1073/pnas.0508575102. [DOI] [PMC free article] [PubMed] [Google Scholar]
- 7.Mesulam MM, Guillozet A, Shaw P, Levey A, Duysen EG, Lockridge O. Acetylcholinesterase knockouts establish central cholinergic pathways and can use butyrylcholinesterase to hydrolyze acetylcholine. Neuroscience. 2002;110:627–639. doi: 10.1016/s0306-4522(01)00613-3. [DOI] [PubMed] [Google Scholar]
- 8.Hartmann J, Kiewert C, Duysen EG, Lockridge O, Greig NH, Klein J. Excessive hippocampal acetylcholine levels in acetylcholinesterase-deficient mice are moderated by butyrylcholinesterase activity. J Neurochem. 2007;100:1421–1429. doi: 10.1111/j.1471-4159.2006.04347.x. [DOI] [PubMed] [Google Scholar]
- 9.Ballard CG, Greig NH, Guillozet-Bongaarts AL, Enz A, Darvesh S. Cholinesterases: roles in the brain during health and disease. Curr Alzheimer Res. 2005;2:281–290. doi: 10.2174/1567205054367838. [DOI] [PubMed] [Google Scholar]
- 10.Diamant S, Podoly E, Friedler A, Ligumsky H, Livnah O, Soreq H. Butyrylcholinesterase attenuates amyloid fibril formation in vitro. Proc Natl Acad Sci USA. 2006;103:8628–8633. doi: 10.1073/pnas.0602922103. [DOI] [PMC free article] [PubMed] [Google Scholar]
- 11.Yu QS, Holloway HW, Utsuki T, Brossi A, Greig N. Synthesis of novel phenserine-based selective inhibitors of butyrylcholinesterase for Alzheimer’s disease. J Med Chem. 1999;42:1855–1861. doi: 10.1021/jm980459s. [DOI] [PubMed] [Google Scholar]
- 12.Greig NH, Yu QS, Brossi A, Matin E, Lahiri DK, Darvesh S. Butyrylcholinesterase, the Cinderella cholinesterase, as a drug target for Alzheimer’s diseases and related dementias. In: Martinez A, editor. Medicinal Chemistry of Alzheimer’s Disease. Transworld Research Network; Trivandrum: 2008. pp. 79–109. [Google Scholar]
- 13.Harel M, Sussman JL, Krejci E, Bon S, Chanal P, Massoulié J, Silman I. Conversion of acetylcholinesterase to butyrylcholinesterase: modelling and mutagenesis. Proc Natl Acad Sci USA. 1992;89:10827–10831. doi: 10.1073/pnas.89.22.10827. [DOI] [PMC free article] [PubMed] [Google Scholar]
- 14.Barak D, Ordentlich A, Stein D, Yu QS, Greig NH, Schafferman A. Accomodation of physostigmine and its analogues by acetylcholinesterase is dominated by hydrophobic interactions. Biochem J. 2009;417:213–222. doi: 10.1042/BJ20081276. [DOI] [PMC free article] [PubMed] [Google Scholar]
- 15.Xu Y, Colletier JP, Weik M, Jiang H, Moult J, Silman I, Sussman JL. Flexibility of aromatic residues in the active-site gorge of acetylcholinesterase: X-ray versus molecular dynamics. Biophys J. 2008;95:2500–2511. doi: 10.1529/biophysj.108.129601. [DOI] [PMC free article] [PubMed] [Google Scholar]
- 16.Colletier JP, Fournier D, Greenblatt HM, Stojan J, Sussman JL, Zaccai G, Silman I, Weik M. Structural insights into traffic and inhibition in acetylcholinesterase. EMBO J. 2006;25:2746–2756. doi: 10.1038/sj.emboj.7601175. [DOI] [PMC free article] [PubMed] [Google Scholar]
- 17.Kamal MA, Klein P, Yu QS, Tweedie D, Li Y, Holloway HW, Greig NH. Kinetics of human serum butyrylcholinesterase and its inhibition by a novel experimental Alzheimer therapeutic, bisnorcymserine. J Alzheimer’s Dis. 2006;10:43–51. doi: 10.3233/jad-2006-10108. [DOI] [PubMed] [Google Scholar]
- 18.Bartolucci C, Perola E, Cellai L, Brufani M, Lamba D. ‘Back door’ opening implied by the crystal structure of a carbamoylated acetylcholinesterase. Biochemistry. 1999;18:5714–5719. doi: 10.1021/bi982723p. [DOI] [PubMed] [Google Scholar]
- 19.Bartolucci C, Siotto M, Ghidini E, Amari G, Bolzoni PT, Racchi M, Villetti G, Delcanale M, Lamba D. Structural determinants of Torpedo californica acetylcholinesterase inhibition by a novel and orally active carbamate based anti-Alzheimer drug Ganstigmine (CHF-2819) J Med Chem. 2006;49:5051–5058. doi: 10.1021/jm060293s. [DOI] [PubMed] [Google Scholar]
- 20.Dvir H, Jiang HL, Wong DM, Harel M, Chetrit M, He XC, Jin GY, Yu GL, Tang XC, Silman I, et al. X-ray structures of Torpedo californica acetylcholinesterase complexed with (+)-Huperzine A and (−)-Huperzine B: structural evidence for an active site rearrangement. Biochemistry. 2002;41:10810–10818. doi: 10.1021/bi020151+. [DOI] [PubMed] [Google Scholar]
- 21.Xu Y, Colletier JP, Weik M, Qin G, Jiang H, Silman I, Sussman JL. Long route or shortcut? A molecular dynamics study of traffic of thiocholine within the active-site gorge of acetylcholinesterase. Biophys J. 2010;99:4003–4011. doi: 10.1016/j.bpj.2010.10.047. [DOI] [PMC free article] [PubMed] [Google Scholar]
- 22.Sanson B, Colletier JP, Xu Y, Lang PT, Jiang H, Silman I, Sussman JL, Weik M. Backdoor opening mechanism in acetylcholinesterase based on X-ray crystallography and MD simulation. Protein Sci. 2011;20:1114–1118. doi: 10.1002/pro.661. [DOI] [PMC free article] [PubMed] [Google Scholar]
- 23.Gilson MK, Straatsma TP, McCammon JA, Ripoll DR, Faerman CH, Axelsen PH, Silman I, Sussman JL. Open ‘back door’ in a molecular dynamics simulation of acetylcholinesterase. Science. 1994;263:1276–1278. doi: 10.1126/science.8122110. [DOI] [PubMed] [Google Scholar]
- 24.Bar-On P, Millard CB, Harel M, Dvir H, Enz A, Sussman JL, Silman I. Kinetic and structural studies on the interaction of cholinesterase with the anti-Alzheimer drug rivastigmine. Biochemistry. 2002;41:3555–3564. doi: 10.1021/bi020016x. [DOI] [PubMed] [Google Scholar]
- 25.Emre M, Cummings JL, Lane RM. Rivastigmine in dementia associated with Parkinson’s disease and Alzheimer’s disease: similarities and differences. J Alzheimer’s Dis. 2007;11:509–519. doi: 10.3233/jad-2007-11412. [DOI] [PubMed] [Google Scholar]
- 26.Polinsky RJ. Clinical pharmacology of rivastigmine: a new-generation acetylcholinesterase inhibitor for the treatment of Alzheimer’s disease. Clin Ther. 1998;20:634–647. doi: 10.1016/s0149-2918(98)80127-6. [DOI] [PubMed] [Google Scholar]
- 27.Golicnik M, Stojan J. Transient kinetic approach of the study of acetylcholinesterase reversible inhibition by eseroline. J Enzym Inhib Med Chem. 2002;17:279–285. doi: 10.1080/1475636021000013920. [DOI] [PubMed] [Google Scholar]
- 28.Galli A, Renzi G, Grazzini E, Bartolini R, Aiello-Malmberg P, Bartolini A. Reversibile inhibition of acetylcholinesterase by eseroline, an opioid agonist structurally related to physostigmine (eserine) and morphine. Biochem Pharmacol. 1982;31:1233–1238. doi: 10.1016/0006-2952(82)90009-0. [DOI] [PubMed] [Google Scholar]
- 29.Bevc S, Konc J, Stojan J, Hodošček M, Penca M, Praprotnik M, Janežič D. ENZO: A web tool for derivation and evaluation of kinetic models of enzyme catalyzed reactions. PLoS ONE. 2011;6:e22265. doi: 10.1371/journal.pone.0022265. [DOI] [PMC free article] [PubMed] [Google Scholar]
- 30.Stojan J, Golicnik M, Fournier D. Rational polynomial equation as an unbiased approach for the kinetic studies of Drosophila melanogaster acetylcholinesterase reaction mechanism. Biochim Biophys Acta. 2004;1703:53–61. doi: 10.1016/j.bbapap.2004.09.017. [DOI] [PubMed] [Google Scholar]
- 31.Stojan J. Kinetic evaluation of multiple initial rate data by simultaneous analysis with two equations. Chem Biol Interact. 2008;175:242–248. doi: 10.1016/j.cbi.2008.05.017. [DOI] [PubMed] [Google Scholar]
- 32.Stojan J. Analysis of progress curves in an acetylcholinesterase reaction: a numerical integration treatment. J Chem Inf Comput Sci. 1997;37:1025–1028. [Google Scholar]
- 33.Sussman JL, Harel M, Frolow F, Varon L, Toker L, Futerman AH, Silman I. Purification and crystallization of a dimeric form of acetylcholinesterase from Torpedo californica subsequent to solubilization with phosphatidylinositol-specific phospholipase C. J Mol Biol. 1988;203:821–823. doi: 10.1016/0022-2836(88)90213-6. [DOI] [PubMed] [Google Scholar]
- 34.Otwinowski Z, Minor W. Processing of X-ray diffraction data collected in oscillation mode. Methods Enzymol. 1997;276:307–326. doi: 10.1016/S0076-6879(97)76066-X. [DOI] [PubMed] [Google Scholar]
- 35.Winn MD, Ballard CC, Cowtan KD, Dodson EJ, Emsley P, Evans PR, Keegan RM, Krissinel EB, Leslie AGW, McCoy A, et al. Overview of the CCP4 suite and current developments. Acta Crystallogr Sect D Biol Crystallogr. 2011;67:235–242. doi: 10.1107/S0907444910045749. [DOI] [PMC free article] [PubMed] [Google Scholar]
- 36.Sussmann JL, Harel M, Frolow F, Oefner C, Goldman A, Toker L, Silman I. Atomic structure of acetylcholinesterase from Torpedo californica: a prototypic acetylcholine-binding protein. Science. 1991;253:872–879. doi: 10.1126/science.1678899. [DOI] [PubMed] [Google Scholar]
- 37.Brünger AT, Adams PD, Clore GM, DeLano WL, Gros P, Grosse-Kunstleve RW, Jiang JS, Kuszewski J, Nigels M, Pannu NS, et al. Crystallography & NMR system: a new software suite for macromolecular structure determination. Acta Crystallogr Sect D Biol Crystallogr. 1998;54:905–921. doi: 10.1107/s0907444998003254. [DOI] [PubMed] [Google Scholar]
- 38.Brünger AT. Version 1.2 of the Crystallography and NMR System. Nat Protoc. 2007;2:2728–2733. doi: 10.1038/nprot.2007.406. [DOI] [PubMed] [Google Scholar]
- 39.Read RJ. Improved Fourier coefficients for maps using phases from partial structures with errors. Acta Crystallogr Sect A Found Crystallogr. 1986;42:140–149. [Google Scholar]
- 40.Jones TA, Zou JY, Cowan SW, Kjeldgaard M. Improved methods for building protein models in electron density maps and the location of errors in these models. Acta Crystallogr Sect A Found Crystallogr. 1991;47:110–119. doi: 10.1107/s0108767390010224. [DOI] [PubMed] [Google Scholar]
- 41.Kleywegt GJ. Use of non-crystallographic symmetry in protein structure refinement. Acta Crystallogr Sect D Biol Crystallogr. 1996;52:842–857. doi: 10.1107/S0907444995016477. [DOI] [PubMed] [Google Scholar]
- 42.Reference deleted
- 43.Radić Z, Gibney G, Kawamoto S, MacPhee-Quigley K, Bongiorno C, Taylor P. Expression of recombinant acetylcholinesterase in a baculovirus system: kinetic properties of glutamate 199 mutants. Biochemistry. 1992;31:9760–9767. doi: 10.1021/bi00155a032. [DOI] [PubMed] [Google Scholar]
- 44.Mallender WD, Szegletes T, Rosenberry TL. Acetylthiocholine binds to Asp74 at the peripheral site of human acetylcholinesterase as the first step in the catalytic pathway. Biochemistry. 2000;39:7753–7763. doi: 10.1021/bi000210o. [DOI] [PubMed] [Google Scholar]
- 45.Goliknic M, Stojan J. Generalized theoretical and practical treatment of the kinetics of an enzyme-catalyzed reaction in the presence of an enzyme equimolar irreversible inhibitor. J Chem Inf Comput Sci. 2003;43:1486–1493. doi: 10.1021/ci0304021. [DOI] [PubMed] [Google Scholar]
- 46.Harel M, Schalk I, Ehet-Sabatier L, Bouet F, Goeldner M, Hirth C, Axelsen PH, Silman I, Sussman JL. Quaternary ligand binding to aromatic residues in the active-site gorge of acetylcholinesterase. Proc Natl Acad Sci USA. 1993;90:9031–9035. doi: 10.1073/pnas.90.19.9031. [DOI] [PMC free article] [PubMed] [Google Scholar]
- 47.Salonen LM, Ellermann M, Diederich F. Aromatic rings in chemical and biological recognition: energetics and structures. Angew Chem, Int Ed Engl. 2011;50:4808–4842. doi: 10.1002/anie.201007560. [DOI] [PubMed] [Google Scholar]
- 48.Koellner G, Kryger G, Millard CB, Silman I, Sussman JL, Steiner T. Active-site gorge and buried water molecules in crystal structures of acetylcholinesterase from Torpedo californica. J Mol Biol. 2000;296:713–735. doi: 10.1006/jmbi.1999.3468. [DOI] [PubMed] [Google Scholar]
- 49.Bartolucci C, Perola E, Pilger C, Fels G, Lamba D. Three dimensional structure of a complex of galanthamine (Nivalin) with acetylcholinesterase from Torpedo californica: implications for the design of new anti-Alzheimer drugs. Proteins. 2001;42:182–191. doi: 10.1002/1097-0134(20010201)42:2<182::aid-prot50>3.0.co;2-1. [DOI] [PubMed] [Google Scholar]
- 50.Greenblatt HM, Kryger G, Lewis TT, Silman I, Sussman JL. Structure of acetylcholinesterase complexed with (−)-galanthamine at 2.3 Å resolution. FEBS Lett. 1999;463:321–326. doi: 10.1016/s0014-5793(99)01637-3. [DOI] [PubMed] [Google Scholar]
- 51.Perola E, Cellai L, Lamba D, Filocamo L, Brufani M. Long chain analogs of physostigmine as potential drugs for Alzheimer’s disease: new insights into the mechanism of action in the inhibition of acetylcholinesterase. Biochim Biophys Acta. 1997;1343:41–50. doi: 10.1016/s0167-4838(97)00133-7. [DOI] [PubMed] [Google Scholar]
- 52.Ngamelue MN, Homma K, Lockridge O, Asojo OA. Crystallization and X-ray structure of full-length recombinant human butyrylcholinesterase. Acta Crystallogr Sect F Struct Biol Crystal Commun. 2007;63:723–727. doi: 10.1107/S1744309107037335. [DOI] [PMC free article] [PubMed] [Google Scholar]
Associated Data
This section collects any data citations, data availability statements, or supplementary materials included in this article.