

Abstract
Purpose
Less than 20% of patients with melanoma who undergo sentinel lymph node (SLN) biopsy based on American Society of Clinical Oncology/Society of Surgical Oncology recommendations are SLN positive. We present a multi-institutional study to discover new molecular risk factors associated with SLN positivity in thin and intermediate-thickness melanoma.
Patients and Methods
Gene clusters with functional roles in melanoma metastasis were discovered by next-generation sequencing and validated by quantitative polymerase chain reaction using a discovery set of 73 benign nevi, 76 primary cutaneous melanoma, and 11 in-transit melanoma metastases. We then used polymerase chain reaction to quantify gene expression in a model development cohort of 360 consecutive thin and intermediate-thickness melanomas and a validation cohort of 146 melanomas. Outcome of interest was SLN biopsy metastasis within 90 days of melanoma diagnosis. Logic and logistic regression analyses were used to develop a model for the likelihood of SLN metastasis from molecular, clinical, and histologic variables.
Results
ITGB3, LAMB1, PLAT, and TP53 expression were associated with SLN metastasis. The predictive ability of a model that included these molecular variables in combination with clinicopathologic variables (patient age, Breslow depth, and tumor ulceration) was significantly greater than a model that only considered clinicopathologic variables and also performed well in the validation cohort (area under the curve, 0.93; 95% CI, 0.87 to 0.97; false-positive and false-negative rates of 22% and 0%, respectively, using a 10% cutoff for predicted SLN metastasis risk).
Conclusion
The addition of cell adhesion–linked gene expression variables to clinicopathologic variables improves the identification of patients with SLN metastases within 90 days of melanoma diagnosis.
INTRODUCTION
The identification of metastatic disease to regional lymph nodes in patients who present with cutaneous melanoma remains a challenge despite advances in imaging, molecular genetics, and cancer cell biology. Sentinel lymph node (SLN) biopsy is an established technique for nodal staging with therapeutic implications1,2 Recommendations on when to use an SLN biopsy are based on clinicopathologic variables, including Breslow depth, mitotic rate, and tumor ulceration.3–5 Morton et al1,2 reported that 122 (16.0%) of 770 patients with intermediate-thickness (Breslow depth of 1.2 to 3.5 mm) melanoma who underwent SLN biopsy had nodal metastasis. Moreover, the Sentinel Lymph Node Working Group reported that among 1,250 patients with thin melanoma (≤ 1 mm Breslow depth) who had an SLN biopsy, 65 (5.2%) had nodal metastasis.6 Attempts to improve identification of patients at risk for SLN positivity using additional histopathology-derived variables have been largely unsuccessful.3–9
Changes in cell adhesion, specifically the remodeling of integrin-linked cell adhesion structures, are associated with a migratory and invasive cellular phenotype, both physiologically (eg, in wound healing)10 and in cancer.11,12 Evidence that integrin adhesion remodeling (IAR) occurs in melanoma is derived from immunohistochemistry,13–15 gene expression microarray studies,16,17 and subsequent validation studies.18,19 We conducted a retrospective study of patients with primary cutaneous melanoma who underwent SLN biopsy within 90 days of primary diagnosis to uncover IAR profiles that differ between those with and without nodal metastases. We also examined whether combining molecular IAR profile information with clinicopathologic features could improve the ability of clinicopathologic features alone to identify pigmented lesions at increased likelihood of nodal metastasis.
PATIENTS AND METHODS
Patient Cohorts
Discovery sets.
Differential gene expression analysis by next-generation sequencing (NGS) was used to identify cellular systems differentially expressed between nevi and primary cutaneous melanoma either known or not known to have developed regional metastases. Initially, three patients with benign nevi were age, sex, and tumor cellularity matched one-to-one to patients with primary cutaneous melanomas that had metastasized regionally. We then determined differential gene expression in age- and tumor cellularity–matched patients with melanoma that had (n = 3) and had not (n = 4) metastasized regionally.
A set of 160 patients presenting at Mayo Clinic (MC) Rochester with benign nevi (73 patients; from 2010 to 2011), primary skin melanoma with negative SLN that had not metastasized (regionally or distantly) over at least a 2- year period (38 patients; from 2009 to 2012), primary skin melanoma with positive SLN (38 patients; from 2004 to 2012), and in-transit regional melanoma metastases (11 patients; from 2009 to 2012) were identified by electronic searches of pathology reports using International Classification of Diseases for Oncology codes. Formalin-fixed, paraffin-embedded primary biopsy material was obtained from the MC tissue archive. This patient cohort was used for a focused examination of the differences in adhesion gene expression between disease stages by quantitative polymerase chain reaction (PCR). A set of patients with primary cutaneous melanoma (n = 154) or benign nevi (n = 24) was used to assess whether a key component of cell adhesion, β3 integrin, seen at the RNA level, was also differentially expressed at the protein level between these patient groups.
Model development and validation cohorts.
The model development and validation cohorts consisted of patients who had an SLN biopsy performed within 90 days of their diagnosis. Patients with cutaneous melanoma who presented at MC (2000 to 2014) with known SLN status were retrospectively identified by electronic searches of pathology reports using International Classification of Diseases for Oncology codes and text strings (ie, “sentinel AND “melano%” AND “lymph node”). Charts were then reviewed for eligibility criteria (see next paragraph), and if met, tissue was requested from either the MC tissue archive or outside practices. Specimens for the model development cohort were processed between March 13, 2012, and December 6, 2013, and included patients who had their SLN biopsy performed between June 2003 and September 2013 (MC Rochester), February 2000 and December 2013 (MC Scottsdale), and August 2012 and May 2013 (MC Jacksonville). Specimens for the model validation cohort were processed between December 9, 2013, and November 18, 2014, and included patients who had their SLN biopsy performed between October 2008 and November 2014 (MC Rochester), March 2007 and September 2014 (MC Scottsdale), February 2009 and November 2014 (MC Jacksonville), and March 2013 and June 2013 (Copenhagen University, Denmark). Time to tissue retrieval varied for logistic, administrative, and regulatory reasons. This is reflected by an overlap of SLN biopsy dates between model development and validation cohorts.
Eligibility was determined based on histopathology data derived from patient medical records and established by two or more board-certified MC dermatopathologists. Inclusion was determined by our institution practice guidelines for recommending SLN biopsy, which are based on Breslow depth, ulceration, mitoses, and age. Patients were eligible for this study if they met one of the following three conditions: Breslow depth of 1.0 to 4.0 mm; Breslow depth of 0.75 to 0.99 mm and presence or ulceration, mitoses, and/or age less than 40 years; or Breslow depth of 0.50 to 0.74 mm and presence of at least two of the following: ulceration, mitoses, and age less than 40 years. Exclusion criteria were as follows: melanomas with Breslow depth of more than 4 mm; ambiguous pathology or SLN biopsy findings; insufficient primary tumor tissue; inadequate RNA obtained, and for MC Rochester, denial of access to medical records for research purposes (per Minnesota state law). This study was approved by the Mayo Foundation Institutional Review Board (IRB11-6390), the ethics committee of Region Sjaelland, Denmark (Reference No. SJ-395), and the Danish Data Protection Agency (Datatilsynet, Reference No. REG-22-2014).
Gene Expression by NGS
See the Appendix (online only) for details.
Gene Expression by Chip-Based Quantitative PCR
RNA purification was from formalin-fixed, paraffin-embedded tissue (Qiagen, Hilden, Germany). Quantitative reverse transcriptase PCR was done using the BioMark HD System and dynamic array integrated fluid circuits (Fluidigm, South San Francisco, CA). Seventy-seven specific targets in 62 genes (54 experimental and eight control genes; Table 1) were amplified per cDNA (standards, controls, and experimental samples). The following cDNA was run per array: standards in triplicates, control cDNA (nevi and melanoma metastases), and experimental cDNA; the latter two were in duplicates. All cDNA was preamplified (TaqMan Preamp Master Mix; Applied Biosystems, Waltham, MA). Array-based quantitative PCR was performed with the help of the TaqMan Gene Expression Master Mix (Applied Biosystems). After thermal cycling, raw Ct data for standards was checked for linear amplification. Copy numbers for negative and positive controls were normalized to housekeeping genes. Averaged, normalized gene copy numbers were compared with an internal standard for interexperiment variation. Data that did not pass both linear amplification and reproducibility checks were discarded.
Table 1.
Classification of the 62 Genes (54 experimental and eight control) Evaluated by Chip-Based Quantitative Polymerase Chain Reaction
| Classification | Gene |
|---|---|
| Control genes including | |
| Housekeeping | ACTB, RPLP0, RPL8 |
| Melanocyte lineage | MITF, TYR, PMEL, MLANA |
| Keratinocyte lineage | KRT14 |
| Integrin cell adhesion receptors | ITGB1, ITGB3, ITGA2, ITGA3, ITGA5, ITGAV |
| Adhesion signaling | PTK2, SRC |
| Cell cycle | CDKN1A, CDKN2A, TP53, YAP, TAZ |
| Integrin trafficking | SNX17, SNX31, TP53 |
| Fibronectin related | FN1, THBS1, THBS2, THBS4, SPP1, PLAT, TNC, SPARC, POSTN, FBLN2, DSPP1 |
| Collagen related | COL1A1, COL4A1, COL18A1, PLOD1, PLOD2, PLOD3, LOX, LOXL1, LOXL3, PCOLCE, PCOLCE2 |
| Laminins | LAMA1, LAMB1, LAMC1, LAMA3, LAMB3, LAMC2 |
| Other extracellular matrix | AGRN, VCAN, GDF15, BGAN, CTGF, CYR61, CSF2, CXCL1, CCL2, IL8, IL6 |
To account for RNA contamination by basal keratinocytes, we quantified keratin 14 (KRT14), a basal keratinocyte marker. KRT14 copy number was multiplied with a gene-specific, per-copy-of-KRT14 contamination factor that was predetermined by analyzing normal skin; the product of this calculation was used to correct for keratinocyte background.
To assess for melanocyte content, at least two melanocyte lineage markers were amplified, MLANA and MITF. If melanocyte markers could not be detected, presence of melanocytic tumor had to be confirmed on tissue recuts followed by histologic review.
Immunohistochemistry
See the Appendix for details.
Statistical Methods
The primary outcome measure for this study was SLN metastasis within 90 days of the primary melanoma diagnosis. Multivariable logistic regression modeling was used to assess which clinical and pathologic characteristics were significantly associated with the likelihood of a nodal metastasis on SLN biopsy within 90 days of primary diagnosis. Classification and regression tree (CART) modeling20 and logic regression modeling21 were performed to identify gene combinations that best differentiated between patients who had and did not have nodal metastasis on SLN biopsy within 90 days of diagnosis. For each gene, a separate CART model was fit to identify the best RNA copy number cutoffs to differentiate between patients with and without SLN metastasis using the Gini rule for splitting, prior probabilities proportional to the observed data frequencies, and 0-1 loss functions. Next, logic regression was used to discover and model interactions of the binary variables created using these cutoffs, and gene expression categories were defined using Boolean operator (“and,” “or,” and “not”) combinations of these variables. The optimal logic regression model size was determined using cross validation and permutation techniques (for details, see the Appendix). Finally, logistic regression modeling was performed to determine whether the molecular finding made a significant contribution in predicting the likelihood of a nodal metastasis on SLN biopsy after accounting for clinical and pathologic parameters. Associations were summarized using the odds ratio and corresponding 95% CIs derived from the model estimates. Receiver operating characteristic (ROC) curves were constructed for the clinicopathologic prediction model and the clinicopathologic and molecular model. The predictive ability of each model was summarized by the area under curve (AUC), and the AUC estimates were compared between models using the DeLong, DeLong, and Clarke-Pearson nonparametric method for comparing the AUC for correlated ROC curves.
The performance of the prognostic model developed using the development cohort was validated by assessing the discriminatory characteristics using ROC analysis and false-negative and false-positive rates. The statistical analysis was performed using SAS version 9.2 (SAS Institute, Cary, NC) and R version 3.0.1. The CART analysis was performed using the rpart package (http://CRAN.R-project.org/package=rpart).
RESULTS
Gene Expression Networks in Benign and Malignant Pigmented Lesions
To identify cellular systems differentially expressed between metastatic and nonmetastatic pigmented lesions of the skin, we first assembled an age-, sex-, and tumor cellularity–matched cohort of three patients with primary skin melanoma that metastasized regionally and three patients with benign nevi. A total of 16,029 genes were measured by NGS. Differential gene expression analysis yielded 164 genes with a false-discovery rate of less than 0.01, which clustered into a large network linked to integrin cell adhesion (Appendix Fig A1, online only). Within that cluster, β3 integrin (ITGB3) had the highest number of functional connections to other genes in the network. We then determined differential gene expression by NGS in a cohort of four patients with primary skin melanoma that had not metastasized (median Breslow depth, 2.6 mm) and three patients who had regional metastasis (median Breslow depth, 2.3 mm). Of a total of 15,196 genes, 208 genes were identified with a false-discovery rate less than 0.01. ITGB3 and SRC, a key downstream effector of β3 integrin,22 formed the center of a functional network deregulated in regionally metastatic versus nonmetastatic melanoma (Appendix Fig A1).
To further investigate cell adhesion as a cellular system that discriminates between metastatic and nonmetastatic pigmented lesions, we developed a targeted quantitative PCR assay with 54 candidate discriminatory adhesion-related genes (Table 1) that were identified by NGS (Appendix Fig A1), previous mappings of functional relationships with genes identified by NGS,23 or previous reports of their association with integrin cell adhesion.16,24–27 RNA copy number was determined in a set of 73 benign nevi (53 were without histologic atypia, and seven had mild, 11 had moderate, and two had severe atypia), 38 primary skin melanomas that had not metastasized (median Breslow depth, 1.2 mm; interquartile range, 0.9 to 1.9 mm), 38 primary skin melanomas that had metastasized regionally (median Breslow depth, 3 mm; interquartile range, 2 to 4 mm), and 11 in-transit regional melanoma metastases. To improve the signal-to-noise ratio with quantitative PCR, we designed a method to account and normalize for sample contamination by basal keratinocytes—a major contaminant cell type in skin with stem cell–like features28 and high levels of adhesion gene expression.29 We found that genes upregulated in regionally metastatic melanoma versus nonmetastatic melanoma were mainly in the categories of integrin adhesion receptors, specifically β3 integrin (Appendix Fig A2, online only), confirming NGS results.
In addition, observed agreement between immunohistochemistry and PCR findings of positive β3 integrin expression (Appendix Fig A3A, online only) was 79% with a κ = 0.46 (Appendix Fig A3B). Specifically, all benign nevi were negative for β3 integrin expression by immunohistochemistry (no cell surface staining) and PCR (normalized RNA copy number ≤ 10).
Using Cell Adhesion Data to Predict SLN Metastasis
A cohort of 360 patients, of whom 74 (20.6%) had nodal metastasis on SLN biopsy, was used to first develop a model of the likelihood of SLN metastasis based on clinicopathologic factors of the primary tumor and then to assess the additional contributions made by the molecular factors (Table 2). Multivariable logistic regression modeling found younger age, tumor ulceration, and greater Breslow depth were associated with an increased likelihood of nodal metastasis detected by SLN within 90 days of primary diagnosis (Table 3, clinicopathologic model). CART modeling and logic regression modeling (Appendix Fig A4, online only) were used to identify gene expression categories defined from four genes—ITGB3, cellular tumor antigen p53 (TP53), laminin B1 chain (LAMB1), and tissue-type plasminogen activator (PLAT; protein name, t-PA)—that differentiated the patients with and without nodal metastases detected by SLN. The likelihood of a nodal metastasis by SLN within 90 days of primary diagnosis was significantly decreased for patients in whom RNA copy numbers were as follows: ITGB3 ≤ 10, TP53 more than 50, and neither LAMB1 more than 250 or PLAT more than 427 (herein referred to as the ITLP group). Finally, logistic regression modeling was used to develop a model combining the clinicopathologic (age, tumor ulceration, and Breslow depth) and molecular factors (ITLP group).
Table 2.
Patient and Tumor Characteristics of the Model Development and Validation Cohorts
| Characteristic | No./Total No. (%) |
P* | |
|---|---|---|---|
| Model Development Cohort (n = 360) | Model Validation Cohort (n = 146) | ||
| Male sex | 225 (62.5) | 101 (69.2) | .16 |
| Age at SLN, years | .03 | ||
| Mean | 59.6 | 63.0 | |
| SD | 17.0 | 15.0 | |
| 16-39 | 55 (15.3) | 13 (8.9) | |
| 40-59 | 112 (31.1) | 43 (29.5) | |
| 60+ | 193 (53.6) | 90 (61.6) | |
| Breslow depth, mm | .41 | ||
| 0.50-1 | 93 (25.8) | 35 (24.0) | |
| 1.01-2 | 177 (49.2) | 66 (45.2) | |
| 2.01-4 | 90 (25.0) | 45 (30.8) | |
| Ulceration | 65 (18.1) | 24 (16.4) | .66 |
| Mitotic rate | .23 | ||
| Absent | 42/346 (12.1) | 11/132 (8.3) | |
| 1-6 | 246/346 (71.1) | 104/132 (78.8) | |
| > 6 | 58/346 (16.8) | 17/132 (12.9) | |
| Tumor-invading lymphocytes | 243/329 (73.9) | 92/115 (80.0) | .19 |
| Angiolymphatic invasion | 16 (4.4) | 6 (4.1) | .87 |
| Histologic type | — | ||
| Superficial spreading | 180 (50.0) | 81 (55.5) | |
| Nodular | 70 (19.4) | 28 (19.2) | |
| Unclassifiable | 30 (8.3) | 4 (2.7) | |
| Desmoplastic | 16 (4.4) | 1 (0.7) | |
| Lentigo maligna | 15 (4.2) | 4 (2.7) | |
| Spindled | 13 (3.6) | 4 (2.7) | |
| Acral lentiginous | 9 (2.5) | 2 (1.4) | |
| Spitzoid | 4 (1.1) | 0 | |
| Nevoid | 3 (0.8) | 3 (2.1) | |
| Dermal | 1 (0.3) | 1 (0.7) | |
| Not documented | 19 (5.3) | 18 (12.3) | |
| A260/280 ratio | < .001 | ||
| Median | 1.88 | 1.90 | |
| IQR | 1.85-1.91 | 1.86-1.94 | |
| RNA concentration, ng/μL | .03 | ||
| Median | 177 | 142.8 | |
| IQR | 102-279 | 82.2-249.0 | |
| Tissue age, days | < .001 | ||
| Median | 952.5 | 632 | |
| IQR | 326.5-1,825 | 39-1,426 | |
| SLN metastasis | 74 (20.6) | 43 (29.5) | .03 |
Abbreviations: IQR, interquartile range; SD, standard deviation; SLN, sentinel lymph node.
Comparisons of the model development and model validation cohorts were performed using the χ2 test for categorical variables, the two-sample t test for patient age, and the Wilcoxon rank sum test for all other variables.
Table 3.
Multivariable Logistic Regression Analyses of Characteristics Associated With SLN Metastasis
| Factor | Patients With SLN Metastasis No./Total No. (%) | Clinicopathologic Multivariable Model |
Clinicopathologic and Molecular Multivariable Model |
||
|---|---|---|---|---|---|
| Adjusted OR (95% CI) | P | Adjusted OR (95% CI) | P | ||
| Age at SLN, years | < .001 | .001 | |||
| 16-39 | 16/55 (29.1) | 3.85 (1.75 to 8.50) | 5.14 (1.99 to 13.25) | ||
| 40-59 | 33/112 (29.5) | 3.47 (1.83 to 6.59) | 2.91 (1.41 to 6.00) | ||
| 60+ | 25/193 (13.0) | 1 | 1 | ||
| Breslow depth, mm | < .001 | .036 | |||
| 0.50-1 | 6/93 (6.4) | 1 | 1 | ||
| 1.01-2 | 31/177 (17.5) | 3.33 (1.31 to 8.44) | 1.50 (0.54 to 4.21) | ||
| 2.01-4 | 37/90 (41.1) | 11.46 (4.34 to 30.27) | 3.30 (1.11 to 9.77) | ||
| Ulceration | .026 | .39 | |||
| No | 50/295 (16.9) | 1 | 1 | ||
| Yes | 24/65 (36.9) | 2.11 (1.10 to 4.06) | 1.38 (0.66 to 2.88) | ||
| ITLP gene expression* | < .001 | ||||
| Negative | 10/237 (4.2) | — | 1 | ||
| Positive | 64/123 (52.0) | — | 17.32 (8.02 to 37.41) | ||
| Sex | |||||
| Male | 47/225 (20.9) | — | — | ||
| Female | 27/135 (20.0) | — | — | ||
| Mitotic rate | |||||
| Absent | 4/42 (9.5) | — | — | ||
| 1-6 | 51/246 (20.7) | — | — | ||
| > 6 | 15/58 (25.9) | — | — | ||
| Tumor-invading lymphocytes | |||||
| No | 19/86 (22.1) | — | — | ||
| Yes | 43/243 (17.7) | — | — | ||
| Angiolymphatic invasion | |||||
| No | 69/344 (20.1) | — | — | ||
| Yes | 5/16 (31.3) | — | — | ||
Abbreviations: OR, odds ratio; SLN, sentinel lymph node.
ITLP gene expression was negative if ITGB3 ≤ 10, TP53 > 50, and neither LAMB1 > 250 nor PLAT > 427.
The overall discriminatory ability of the clinicopathologic model (AUC, 0.78; 95% CI, 0.73 to 0.83) was significantly improved with the addition of the molecular factors (AUC, 0.89; 95% CI, 0.85 to 0.93; P < .001; Fig 1A). The sensitivity and specificity curves associated with this combined model indicate that the sensitivity and specificity pair is maximized at a cut point of 0.255 (82% for both). In contrast, a cut point of 0.10 yields a sensitivity of 89% and specificity of 76% (Fig 1B).
Fig 1.

A combined clinicopathologic and molecular model for predicting sentinel lymph node (SLN) metastasis. (A) Receiver operating characteristic (ROC) curves for the clinicopathologic model and the clinicopathologic and molecular model in Table 3 using the model development cohort. (B) Summary of the sensitivity and specificity according to the predicted probability of SLN metastasis estimated from the clinicopathologic and molecular model. (C) ROC curves for the clinicopathologic model and the clinicopathologic and molecular model in Table 3 applied to the validation cohort.
Having developed a promising clinicopathologic and molecular model to predict the likelihood of nodal metastasis to SLN within 90 days of diagnosis, we examined its predictive ability in our 146-patient validation cohort (Table 2). The model development and validation cohorts were similar in patient and disease characteristics with the exception of the age of the tumor specimen (Table 2). The discriminative ability of the clinicopathologic and molecular model held up when applied to this validation cohort (AUC, 0.93; 95% CI, 0.87 to 0.97; Fig 1C). Using the suggested cutoff of 10%,4 the false-positive rate was 22% and the false-negative rate was 0%.
DISCUSSION
Histopathology has been shown to perform relatively poorly as a means to determine whether or not a patient who presents with cutaneous melanoma has a high enough likelihood of nodal metastases and therefore warrants undergoing an SLN biopsy.9,30,31 Morton et al1,2 reported that less than 20% of patients with intermediate-thickness melanoma who underwent SLN biopsy per current guidelines were found to be node positive. Thus, a large number of SLN biopsies could be avoided if additional methods became available to better identify nodal metastasis in patients with primary cutaneous melanoma at the time of their diagnosis. In this study, we found that molecular data in combination with Breslow depth, tumor ulceration, and patient age were useful for discriminating between primary cutaneous melanomas that had or had not metastasized to SLN. These clinicopathologic variables are easily obtained and quantified and have been validated previously as predictors of SLN positivity.7 Mitotic rate (MR), an intensely studied potential biomarker of high-risk pigmented lesions,6,8,19,32–48 was not found to be associate with SLN positivity in our cohort, which is consistent with a number of previous reports6,43–48 but contradicts others.8,19,32–42 The lack of a clear consensus on MR as a marker of SLN positivity may partially originate from inconsistencies in MR quantification.7
Histopathologic assessment of pigmented lesions is often heavily reliant on individuals because the integration of computer-aided image analysis tools has not yet advanced to the mainstream in clinical laboratories.42 Although it is difficult to consistently determine MR within and across institutions,7 it seems even less likely that complex histopathologic measure such as tumor-infiltrating lymphocytes or angiolymphatic invasion are graded consistently enough to consider for inclusion into multivariable models. Non–image-derived highly quantitative variables obtained through gene expression–based testing may hold greater promise.
Gene expression–based testing has been successfully used in breast cancer to individualize therapy.49 Previous research on gene expression in invasive melanoma consistently demonstrated the upregulation of integrin adhesion receptors13–15 and tumor-associated extracellular matrix, including the integrin ligands osteopontin16,17,50 and fibronectin.16,18,50 Here, we have confirmed this upregulation and found an association between ITLP gene expression and SLN positivity in primary cutaneous melanoma. The functional roles of β3 integrin and laminin B1, a β1 integrin ligand, in cell adhesion and invasive growth are well documented.12 It is perhaps less well known that t-PA at sites of focal contacts promotes cell migration and β3 integrin activity,51 which in turn inhibits p53 to induce melanoma cell survival.52 Mutant forms of p53 may also stimulate invasion by regulating integrin recycling.53 The ITLP gene expression signature may thus be viewed as a biomarker of IAR, which is well known to promote invasion and metastasis in murine or humanized cancer models. For example, β3 integrin mediates bone54 and liver metastasis22 in breast and pancreatic cancer, respectively. Overexpression of β3 integrin in primary human melanoma induces a switch from radial to invasive vertical growth.55
ITLP gene expression can be quantified in small amounts of punch or shave biopsy tissue. Because our method accounts for RNA contamination by keratinocytes, the major contaminant cell type in skin, the use of laser capture microdissection is not required. Signal quantification is automated and free of subjective influence. This is an important distinction to other molecular approaches where data analysis is often observer dependent.56
A limitation to our retrospective study was that referral bias and variations in pathology assessment could have influenced results, specifically for MR and other complex histopathologic figures (ie, tumor-invading lymphocytes and angiolymphatic invasion). Furthermore, model development and validation cohorts were from a highly selected group of patients seeking care at tertiary care centers. Molecular testing was performed in a single laboratory, and as of yet, our method has not been independently validated elsewhere. Additional research is ongoing to externally validate the model and develop a scoring system for risk classification.
In summary, this study represents, to our knowledge, the largest multimarker molecular analysis of primary cutaneous melanoma with known SLN status to date and demonstrates an association between ITLP gene expression and SLN positivity. Data obtained by gene expressing profiling can be combined with Breslow depth, tumor ulceration, and patient age to calculate the predicted probability of SLN positivity at the time of primary diagnosis. These data have the potential to improve patient care by avoiding unnecessary SLN procedures.
Acknowledgment
We thank Jeannette Olazagasti Lourido; Angela Sutton, MD; Sultan A. Mirza, MD; Tina E. Abraham, DO; Desiree A. Godar, MD; and Valerie Laniosz, MD, PhD, for help with specimen retrieval and processing. We thank Vernadette A. Simon and the Mayo Clinic Gene Expression Core Facility for excellent technical assistance. We thank Pauline J. Funk for help with medical index retrieval and Erica R. Leitzen for help with specimen retrieval. We thank Asha A. Nair and Jaime I. Davila, PhD, for help with next-generation sequencing biostatistics. We thank Svetomir N. Markovic, MD, PhD; Robert B. Jenkins, MD, PhD; George Vasmatzis, PhD; and Gianrico Farrugia, MD, for helpful discussions and project review.
Appendix
Gene Expression by Next-Generation Sequencing
Briefly, RNA-derived cDNA libraries were prepared using the NuGen Ovation RNAseq (Life Technologies, Grand Island, NY) formalin-fixed, paraffin-embedded library system. Concentration and size distribution of the resulting libraries were determined on an Agilent Bioanalyzer DNA 1000 chip and confirmed by Qubit fluorometry (Life Technologies). Unique indexes were incorporated at the adaptor ligation phase for three-plex sample loading. Libraries were loaded onto paired end flow cells to generate cluster densities of 700,000/mm2 following Illumina's (San Diego, CA) standard protocol. The flow cells were sequenced as 51 × 2 paired end reads on an Illumina HiSeq 2000. The samples were processed through the Mayo RNA-Seq analysis pipeline, MAP-RSeq (Kalari KR, et al: BMC Bioinformatics 15:224, 2014). Raw and normalized (read per kilobase of gene per million mapped reads) gene expression read counts were obtained per sample. Differential gene expression analysis was carried out using the freely available edgeR (Robinson MD, et al: Bioinformatics 26:139-140, 2010) bioconductor software package (http://bioconductor.org). Because scaling by total lane counts can bias estimates of differential expression, edgeR uses trimmed mean normalization on raw read counts to determine whether genes are differentially expressed (Bullard JH, et al: BMC Bioinformatics 11:94, 2010) using the negative binomial method. The Benjamini and Hochberg correction is used to control for multiple testing to obtain a false discovery rate of less than 0.05.
Immunohistochemistry
Tissue recuts were processed and stained with a Leica Bond-Max autostainer (Leica Biosystems, Buffalo Grove, IL). Briefly, β3 integrin antibody (clone 2f2) was used in combination with an alkaline phosphatase–based red detection kit. Heat-induced epitope retrieval was done with the help of a pH 9.0 EDTA solution. Slides were digitalized with an Aperio ScanScope (Leica Biosystems). Lesions were categorized as immunohistochemistry positive if cell surface staining was detected in any part of the tumor.
Statistical Methods: Logic Regression
When evaluating gene expression data as potential predictors of outcomes, it is useful to model interactions between the genes. Logic regression can be used to discover and model interactions of binary explanatory variables. The variables are combined into trees using Boolean operators (“and,” “or,” and “not”) where each variable is a node on the tree.21
Logic regression fits regression models using one to five trees, and the trees can be composed of many leaves. Simulated annealing was used to explore possible logic regression models to find a good model. The technique starts by fitting a model built randomly using a specified number of leaves and trees. A new model is created by randomly permuting the current model by changing a leaf or Boolean operator. The performance of the current model is then compared with the new model. If the new model performs better, then it becomes the current model and the process is repeated. Simulated annealing avoids local optima by controlling when inferior models were chosen. The null model randomization test was used to determine whether there was a relationship between the 147 binary gene expression variables and sentinel lymph node (SLN) positivity. The optimal number of leaves and trees was determined using cross validation and permutation techniques. First, the best model was fit for all biopsy samples using logic regression. Next, we randomly reassigned the SLN positivity outcome for all the patients and fit another model. The process of randomly reassigning the SLN positivity outcome and fitting a model was performed 25 times; Figure A4A shows the histogram of the deviance scores from the models built using the randomized outcomes. The null model randomization test demonstrated there was a relationship between SLN positivity and gene expression because the deviance scores were all worse than the best model deviance scores.
The optimal number of leaves and trees in the logic regression model was determined using cross validation and permutation techniques. Ten-fold cross validation was used to help determine the ideal model size given the data; Figure A4B shows the deviance score for the test samples for different model configurations. Each point is labeled with the number of trees used in the model. The x axis indicates the number of binary variables or leaves used in the model. The best deviance score was obtained using a two-tree model using four binary explanatory variables. When more than four explanatory variables are used in the model, there may be an overfitting issue because the test data deviance scores degrade when there are more than four explanatory variables. The permutation test was also used to confirm ideal model size given the data. The permutation test fits the best model given the model size. In each tree, the binary variables are put together using “and,” “or,” and “not.” It follows that each logic tree has a binary outcome. For a model having n trees, the sample could be partitioned into 2n groups. With two trees, the sample was partitioned into four groups. The SLN outcomes were permuted by randomly reassigning the outcome within each of the four groups. The model was refit based on permuted data. Notice that the exact same model can be found within the permuted data. Models scoring better than the best model were likely because of fitting on noise. Models scoring worse than the best model were likely caused by the model being too small; Figure A4C shows this process repeated 1,000 times for each model size. Most of the permuted models with two leaves performed worse than the best model, indicating a larger model would be optimal. Approximately 10% of the models using five leaves fit using permuted data outperformed the best model. Ruczinski et al21 recommended choosing the model size where the permuted outcome variables outperform the best model 5% to 20% of the time. The cross-validation test and the permutation test indicated that the optimum model size was two trees using four or five binary variables. The formulas for the best-fitting models involved two trees with a model size of four or five (Fig A4D). The best four-leaf model considered β3 integrin (ITGB3), cellular tumor antigen p53 (TP53), the laminin B1 chain (LAMB1), and tissue-type plasminogen activator (PLAT). The best five-leaf model considered the same four genes plus agrin (AGRN). Notice that the composition for one tree was exactly the same for both models (LAMB1 > 250 or PLAT > 427). The four-leaf model was preferred because it is simpler and the performance is similar to the five-leaf model.21
Fig A1.
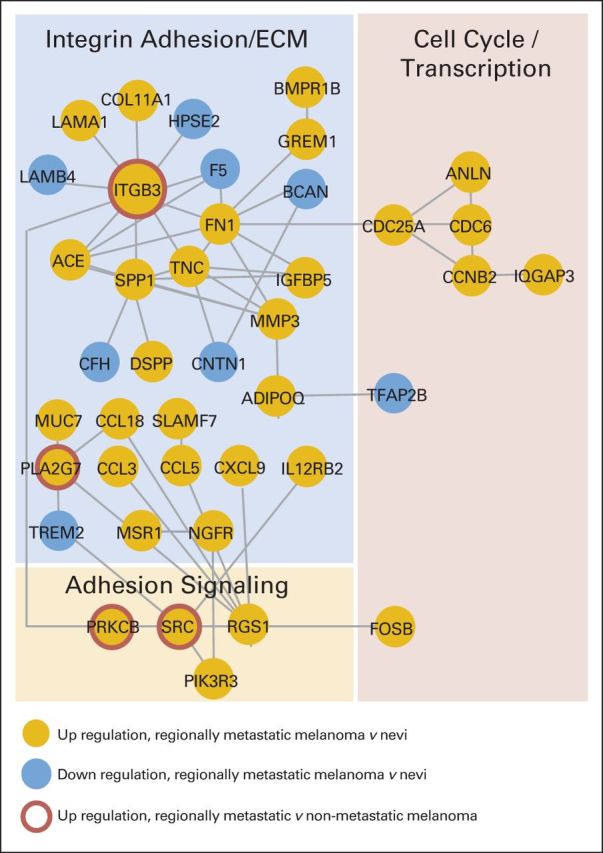
Integrin cell adhesion is a cellular system differentially expressed in metastatic melanoma versus nonmetastatic pigmented lesions. One hundred sixty-four of 16,029 genes were significantly regulated in benign nevi versus regionally metastatic melanoma (false-discovery rate < 0.01) as determined by next-generation sequencing (NGS). Functional relationships between these genes were mapped by the STRING database (http://string.embl.de). Genes without known functional relationships to other genes (ie, disconnected nodes) or networks with three genes or less were hidden. A large cluster emerged that was functionally related to integrin cell adhesion and the extracellular matrix (ECM). Additional NGS-based comparison of samples from patients with regional metastasis versus nonmetastatic melanoma revealed the deregulation of an ITGB3/protein kinase C/SRC network in regionally metastatic melanoma. Gold circles indicate gene upregulation in regionally metastatic melanoma versus nevi; blue circles indicate downregulation in regionally metastatic melanoma versus nevi. Red rings indicate upregulation in regionally metastatic versus nonmetastatic melanoma.
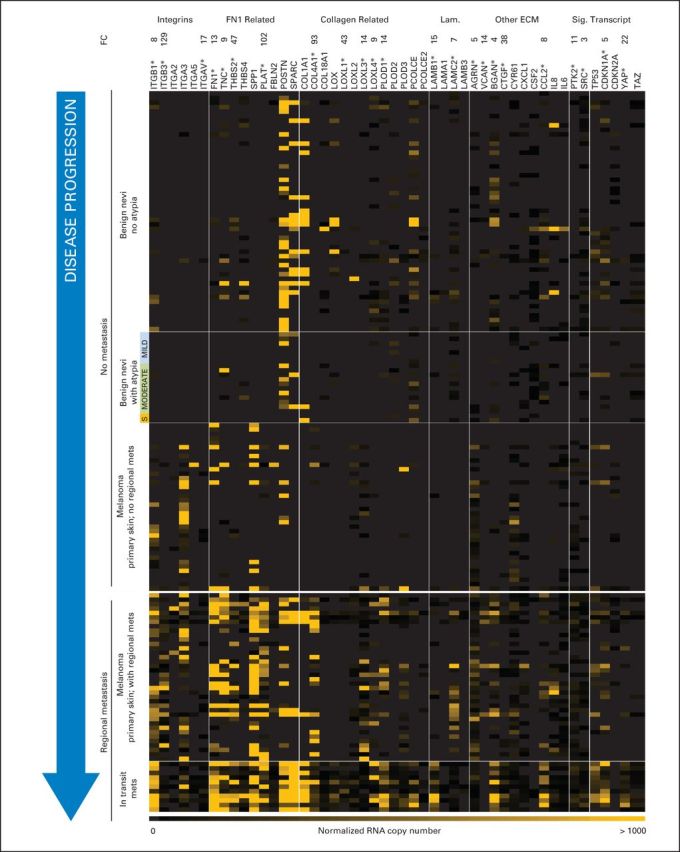
Fig A2.
Genes with functional roles in cell adhesion are overexpressed in regionally metastatic versus nonmetastatic pigmented lesions. Adhesion gene copy numbers are shown for stages of disease progression. (*) Genes with significant regulation (metastatic v nonmetastatic; P < .001, Wilcoxon rank sum test). ECM, extracellular matrix; FC, fold change; Lam., laminins; S, severe atypia; Sig., signaling; Transcript, transcription.
Fig A3.
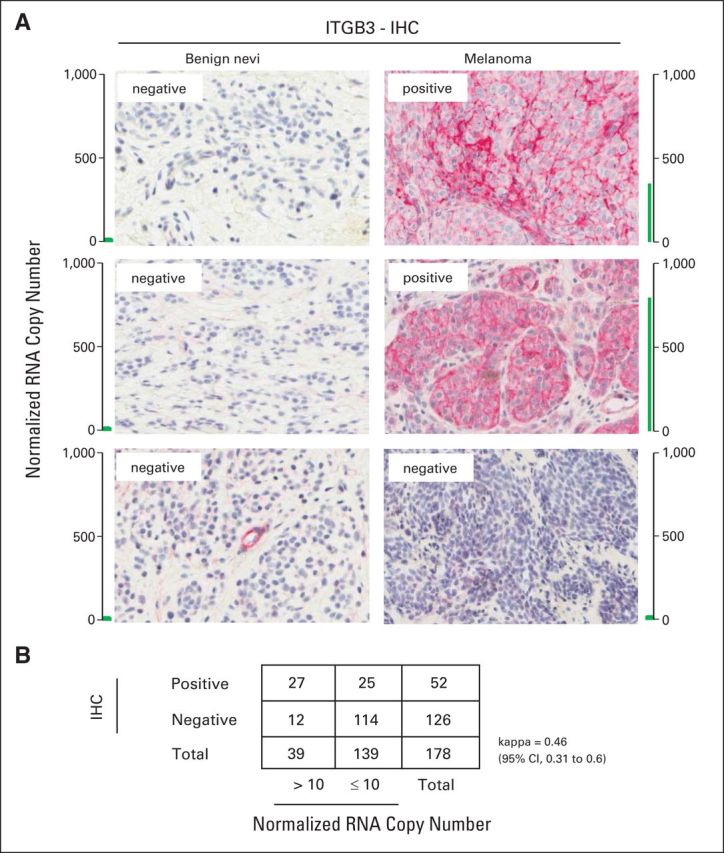
Agreement between ITGB3 expression by immunohistochemistry (IHC) and quantitative polymerase chain reaction (PCR). (A) Examples of pigmented lesions categorized as ITGB3 positive by IHC with their respective normalized RNA copy number as obtained by quantitative PCR. (B) Agreement by κ based on 178 pigmented lesions (IHC v quantitative PCR).
Fig A4.

Logic regression. (A) The null model randomization test suggests that a relationship exists between sentinel lymph node (SLN) positivity and the gene expression variables. The best model and null model reference lines mark the deviance scores for the best model fit to outcomes and the null model. The histogram shows the distribution of deviance scores for models fit against randomized outcomes. Because the best model outperforms the randomized outcome models, there was a relationship between SLN positivity and gene expression. (B) Ten-fold cross-validation results for models using one, two, and three trees with at most six binary variables or leaves. The label in each square denotes the number of trees used in the model. The scores on the y-axis are the deviance scores using the test data, and the x-axis denotes the number of binary variables (leaves) used in each model. Notice that the model using two trees and four leaves had the best test score. (C) Summary of the permutation test results for two trees using two to five leaves. The two solid reference lines indicate the best deviance score and the null model deviance score. The dashed reference line represents the deviance score using a one-tree model. The histogram summarizes the deviance scores using permuted outcomes. There were 1,000 model fits for each model size. Scores above the best model reference line indicate there were models that fit the permuted data better than the actual data. For the model with two trees and five leaves, approximately 10% deviance scores for models fit using permuted data have a lower score than using the best model for the observed original data indicated by the left-most vertical reference line. (D) The formulas for the best-fitting models involved two trees with a model size of four or five. The four-leaf model is preferred because it is simpler and the performance is similar to the five-leaf model.21
Footnotes
Supported by the Mayo Clinic, Department of Dermatology, the Center for Clinical and Translational Science (Grant No. UL1TR000135), the Mayo Clinic Center for Individualized Medicine, and the Mayo Clinic Cancer Center. It was further supported by generous gifts from Lucille and Smith Gibson, the Mendelin family, and Arnold and Kit Palmer.
Authors' disclosures of potential conflicts of interest are found in the article online at www.jco.org. Author contributions are found at the end of this article.
AUTHORS' DISCLOSURES OF POTENTIAL CONFLICTS OF INTEREST
Disclosures provided by the authors are available with this article at www.jco.org.
AUTHOR CONTRIBUTIONS
Conception and design: Alexander Meves, Mark R. Pittelkow, Clark C. Otley, Amy L. Weaver, Vera J. Suman
Financial support: Alexander Meves, Clark C. Otley
Administrative support: Alexander Meves, Clark C. Otley
Provision of study materials or patients: Alexander Meves, Clark C. Otley
Collection and assembly of data: Alexander Meves, Ekaterina Nikolova, Joel B. Heim, Edwin J. Squirewell, Mark A. Cappel, Nille Behrendt, Ditte M. Saunte, Jorgen Lock-Andersen, Vera J. Suman
Data analysis and interpretation: Alexander Meves, Louis A. Schenck, Amy L. Weaver, Vera J. Suman
Manuscript writing: All authors
Final approval of manuscript: All authors
AUTHORS' DISCLOSURES OF POTENTIAL CONFLICTS OF INTEREST
Tumor Cell Adhesion As a Risk Factor for Sentinel Lymph Node Metastasis in Primary Cutaneous Melanoma
The following represents disclosure information provided by authors of this manuscript. All relationships are considered compensated. Relationships are self-held unless noted. I = Immediate Family Member, Inst = My Institution. Relationships may not relate to the subject matter of this manuscript. For more information about ASCO's conflict of interest policy, please refer to www.asco.org/rwc or jco.ascopubs.org/site/ifc.
Alexander Meves
Patents, Royalties, Other Intellectual Property: have patents pending (Inst)
Ekaterina Nikolova
Patents, Royalties, Other Intellectual Property: patent application
Joel B. Heim
No relationship to disclose
Edwin J. Squirewell
No relationship to disclose
Mark A. Cappel
No relationship to disclose
Mark R. Pittelkow
No relationship to disclose
Clark C. Otley
Patents, Royalties, Other Intellectual Property: I hold a patent for a varicose vein device unrelated to the content of this manuscript
Nille Behrendt
No relationship to disclose
Ditte M. Saunte
Honoraria: Galderma, Bayer, Astellas Pharma
Consulting or Advisory Role: Abbvie
Travel, Accommodations, Expenses: Desitin, Abbvie, Pfizer
Jorgen Lock-Andersen
No relationship to disclose
Louis A. Schenck
Stock or Other Ownership: Johnson & Johnson, Medtronic
Amy L. Weaver
No relationship to disclose
Vera J. Suman
No relationship to disclose
REFERENCES
- 1.Morton DL, Thompson JF, Cochran AJ, et al. Sentinel-node biopsy or nodal observation in melanoma. N Engl J Med. 2006;355:1307–1317. doi: 10.1056/NEJMoa060992. [DOI] [PubMed] [Google Scholar]
- 2.Morton DL, Thompson JF, Cochran AJ, et al. Final trial report of sentinel-node biopsy versus nodal observation in melanoma. N Engl J Med. 2014;370:599–609. doi: 10.1056/NEJMoa1310460. [DOI] [PMC free article] [PubMed] [Google Scholar]
- 3.Wong SL, Balch CM, Hurley P, et al. Sentinel lymph node biopsy for melanoma: American Society of Clinical Oncology and Society of Surgical Oncology joint clinical practice guideline. J Clin Oncol. 2012;30:2912–2918. doi: 10.1200/JCO.2011.40.3519. [DOI] [PMC free article] [PubMed] [Google Scholar]
- 4.Balch CM, Morton DL, Gershenwald JE, et al. Sentinel node biopsy and standard of care for melanoma. J Am Acad Dermatol. 2009;60:872–875. doi: 10.1016/j.jaad.2008.09.067. [DOI] [PubMed] [Google Scholar]
- 5.Balch CM, Gershenwald JE, Soong SJ, et al. Final version of 2009 AJCC melanoma staging and classification. J Clin Oncol. 2009;27:6199–6206. doi: 10.1200/JCO.2009.23.4799. [DOI] [PMC free article] [PubMed] [Google Scholar]
- 6.Han D, Zager JS, Shyr Y, et al. Clinicopathologic predictors of sentinel lymph node metastasis in thin melanoma. J Clin Oncol. 2013;31:4387–4393. doi: 10.1200/JCO.2013.50.1114. [DOI] [PubMed] [Google Scholar]
- 7.Sabel MS, Rice JD, Griffith KA, et al. Validation of statistical predictive models meant to select melanoma patients for sentinel lymph node biopsy. Ann Surg Oncol. 2012;19:287–293. doi: 10.1245/s10434-011-1979-6. [DOI] [PMC free article] [PubMed] [Google Scholar]
- 8.Sondak VK, Taylor JM, Sabel MS, et al. Mitotic rate and younger age are predictors of sentinel lymph node positivity: Lessons learned from the generation of a probabilistic model. Ann Surg Oncol. 2004;11:247–258. doi: 10.1245/aso.2004.03.044. [DOI] [PubMed] [Google Scholar]
- 9.Sabel MS. Sentinel lymph node biopsy for thin melanoma-con. J Surg Oncol. 2012;106:217–218. doi: 10.1002/jso.23001. [DOI] [PubMed] [Google Scholar]
- 10.Martin P. Wound healing: Aiming for perfect skin regeneration. Science. 1997;276:75–81. doi: 10.1126/science.276.5309.75. [DOI] [PubMed] [Google Scholar]
- 11.Brakebusch C, Bouvard D, Stanchi F, et al. Integrins in invasive growth. J Clin Invest. 2002;109:999–1006. doi: 10.1172/JCI15468. [DOI] [PMC free article] [PubMed] [Google Scholar]
- 12.Desgrosellier JS, Cheresh DA. Integrins in cancer: Biological implications and therapeutic opportunities. Nat Rev Cancer. 2010;10:9–22. doi: 10.1038/nrc2748. [DOI] [PMC free article] [PubMed] [Google Scholar]
- 13.Hieken TJ, Farolan M, Ronan SG, et al. Beta3 integrin expression in melanoma predicts subsequent metastasis. J Surg Res. 1996;63:169–173. doi: 10.1006/jsre.1996.0242. [DOI] [PubMed] [Google Scholar]
- 14.Hieken TJ, Ronan SG, Farolan M, et al. Beta 1 integrin expression in malignant melanoma predicts occult lymph node metastases. Surgery. 1995;118:669–675. doi: 10.1016/s0039-6060(05)80034-0. [DOI] [PubMed] [Google Scholar]
- 15.Albelda SM, Mette SA, Elder DE, et al. Integrin distribution in malignant melanoma: Association of the β3 subunit with tumor progression. Cancer Res. 1990;50:6757–6764. [PubMed] [Google Scholar]
- 16.Talantov D, Mazumder A, Yu JX, et al. Novel genes associated with malignant melanoma but not benign melanocytic lesions. Clin Cancer Res. 2005;11:7234–7242. doi: 10.1158/1078-0432.CCR-05-0683. [DOI] [PubMed] [Google Scholar]
- 17.Conway C, Mitra A, Jewell R, et al. Gene expression profiling of paraffin-embedded primary melanoma using the DASL assay identifies increased osteopontin expression as predictive of reduced relapse-free survival. Clin Cancer Res. 2009;15:6939–6946. doi: 10.1158/1078-0432.CCR-09-1631. [DOI] [PMC free article] [PubMed] [Google Scholar]
- 18.Kashani-Sabet M, Rangel J, Torabian S, et al. A multi-marker assay to distinguish malignant melanomas from benign nevi. Proc Natl Acad Sci U S A. 2009;106:6268–6272. doi: 10.1073/pnas.0901185106. [DOI] [PMC free article] [PubMed] [Google Scholar]
- 19.Mitra A, Conway C, Walker C, et al. Melanoma sentinel node biopsy and prediction models for relapse and overall survival. Br J Cancer. 2010;103:1229–1236. doi: 10.1038/sj.bjc.6605849. [DOI] [PMC free article] [PubMed] [Google Scholar]
- 20.Therneau T, Atkinson B, Ripley B. Recursive Partitioning, R package version 4.1-3. Rochester, MN: Mayo Clinic; 2013. [Google Scholar]
- 21.Ruczinski I, Kooperberg C, LeBlanc M. Logic regression. J Comput Graph Stat. 2003;12:475–511. [Google Scholar]
- 22.Desgrosellier JS, Barnes LA, Shields DJ, et al. An integrin alpha(v)beta(3)-c-Src oncogenic unit promotes anchorage-independence and tumor progression. Nat Med. 2009;15:1163–1169. doi: 10.1038/nm.2009. [DOI] [PMC free article] [PubMed] [Google Scholar]
- 23.Szklarczyk D, Franceschini A, Kuhn M, et al. The STRING database in 2011: Functional interaction networks of proteins, globally integrated and scored. Nucleic Acids Res. 2011;39:D561–D568. doi: 10.1093/nar/gkq973. [DOI] [PMC free article] [PubMed] [Google Scholar]
- 24.Zanivan S, Meves A, Behrendt K, et al. In vivo SILAC-based proteomics reveals phosphoproteome changes during mouse skin carcinogenesis. Cell Rep. 2013;3:552–566. doi: 10.1016/j.celrep.2013.01.003. [DOI] [PubMed] [Google Scholar]
- 25.Meves A, Stremmel C, Böttcher TR, et al. β1 integrins with individually disrupted cytoplasmic NPxY motifs are embryonic lethal but partially active in epidermis. J Invest Dermatol. 2013;133:2722–2731. doi: 10.1038/jid.2013.232. [DOI] [PMC free article] [PubMed] [Google Scholar]
- 26.Böttcher RT, Stremmel C, Meves A, et al. Sorting nexin 17 prevents lysosomal degradation of β1 integrins by binding to the β1-integrin tail. Nat Cell Biol. 2012;14:584–592. doi: 10.1038/ncb2501. [DOI] [PubMed] [Google Scholar]
- 27.Meves A, Geiger T, Zanivan S, et al. Beta1 integrin cytoplasmic tyrosines promote skin tumorigenesis independent of their phosphorylation. Proc Natl Acad Sci U S A. 2011;108:15213–15218. doi: 10.1073/pnas.1105689108. [DOI] [PMC free article] [PubMed] [Google Scholar]
- 28.Jones PH, Watt FM. Separation of human epidermal stem cells from transit amplifying cells on the basis of differences in integrin function and expression. Cell. 1993;73:713–724. doi: 10.1016/0092-8674(93)90251-k. [DOI] [PubMed] [Google Scholar]
- 29.Tumbar T, Guasch G, Greco V, et al. Defining the epithelial stem cell niche in skin. Science. 2004;303:359–363. doi: 10.1126/science.1092436. [DOI] [PMC free article] [PubMed] [Google Scholar]
- 30.Glusac EJ. The melanoma ‘epidemic,’ a dermatopathologist's perspective. J Cutan Pathol. 2011;38:264–267. doi: 10.1111/j.1600-0560.2010.01660.x. [DOI] [PubMed] [Google Scholar]
- 31.Glusac EJ. The melanoma ‘epidemic’: Lessons from prostate cancer. J Cutan Pathol. 2012;39:17–20. doi: 10.1111/j.1600-0560.2011.01848.x. [DOI] [PubMed] [Google Scholar]
- 32.Han D, Yu D, Zhao X, et al. Sentinel node biopsy is indicated for thin melanomas ≥ 0.76 mm. Ann Surg Oncol. 2012;19:3335–3342. doi: 10.1245/s10434-012-2469-1. [DOI] [PMC free article] [PubMed] [Google Scholar]
- 33.Karakousis GC, Gimotty PA, Botbyl JD, et al. Predictors of regional nodal disease in patients with thin melanomas. Ann Surg Oncol. 2006;13:533–541. doi: 10.1245/ASO.2006.05.011. [DOI] [PubMed] [Google Scholar]
- 34.Kesmodel SB, Karakousis GC, Botbyl JD, et al. Mitotic rate as a predictor of sentinel lymph node positivity in patients with thin melanomas. Ann Surg Oncol. 2005;12:449–458. doi: 10.1245/ASO.2005.04.027. [DOI] [PubMed] [Google Scholar]
- 35.Ranieri JM, Wagner JD, Wenck S, et al. The prognostic importance of sentinel lymph node biopsy in thin melanoma. Ann Surg Oncol. 2006;13:927–932. doi: 10.1245/ASO.2006.04.023. [DOI] [PubMed] [Google Scholar]
- 36.Kruper LL, Spitz FR, Czerniecki BJ, et al. Predicting sentinel node status in AJCC stage I/II primary cutaneous melanoma. Cancer. 2006;107:2436–2445. doi: 10.1002/cncr.22295. [DOI] [PubMed] [Google Scholar]
- 37.Wagner JD, Gordon MS, Chuang TY, et al. Predicting sentinel and residual lymph node basin disease after sentinel lymph node biopsy for melanoma. Cancer. 2000;89:453–462. doi: 10.1002/1097-0142(20000715)89:2<453::aid-cncr34>3.0.co;2-v. [DOI] [PubMed] [Google Scholar]
- 38.Mraz-Gernhard S, Sagebiel RW, Kashani-Sabet M, et al. Prediction of sentinel lymph node micrometastasis by histological features in primary cutaneous malignant melanoma. Arch Dermatol. 1998;134:983–987. doi: 10.1001/archderm.134.8.983. [DOI] [PubMed] [Google Scholar]
- 39.Sassen S, Shaw HM, Colman MH, et al. The complex relationships between sentinel node positivity, patient age, and primary tumor desmoplasia: Analysis of 2303 melanoma patients treated at a single center. Ann Surg Oncol. 2008;15:630–637. doi: 10.1245/s10434-007-9684-1. [DOI] [PubMed] [Google Scholar]
- 40.Paek SC, Griffith KA, Johnson TM, et al. The impact of factors beyond Breslow depth on predicting sentinel lymph node positivity in melanoma. Cancer. 2006;109:100–108. doi: 10.1002/cncr.22382. [DOI] [PubMed] [Google Scholar]
- 41.Oliveira Filho RS, Ferreira LM, Biasi LJ, et al. Vertical growth phase and positive sentinel node in thin melanoma. Braz J Med Biol Res. 2003;36:347–350. doi: 10.1590/s0100-879x2003000300009. [DOI] [PubMed] [Google Scholar]
- 42.Nielsen PS, Spaun E, Riber-Hansen R, et al. Automated quantification of MART1-verified Ki-67 indices: Useful diagnostic aid in melanocytic lesions. Hum Pathol. 2014;45:1153–1161. doi: 10.1016/j.humpath.2014.01.009. [DOI] [PubMed] [Google Scholar]
- 43.Nguyen CL, McClay EF, Cole DJ, et al. Melanoma thickness and histology predict sentinel lymph node status. Am J Surg. 2001;181:8–11. doi: 10.1016/s0002-9610(00)00533-x. [DOI] [PubMed] [Google Scholar]
- 44.Wong SL, Brady MS, Busam KJ, et al. Results of sentinel lymph node biopsy in patients with thin melanoma. Ann Surg Oncol. 2006;13:302–309. doi: 10.1245/ASO.2006.02.021. [DOI] [PubMed] [Google Scholar]
- 45.Taylor RC, Patel A, Panageas KS, et al. Tumor-infiltrating lymphocytes predict sentinel lymph node positivity in patients with cutaneous melanoma. J Clin Oncol. 2007;25:869–875. doi: 10.1200/JCO.2006.08.9755. [DOI] [PubMed] [Google Scholar]
- 46.Yonick DV, Ballo RM, Kahn E, et al. Predictors of positive sentinel lymph node in thin melanoma. Am J Surg. 2011;201:324–328. doi: 10.1016/j.amjsurg.2010.09.011. [DOI] [PubMed] [Google Scholar]
- 47.Venna SS, Thummala S, Nosrati M, et al. Analysis of sentinel lymph node positivity in patients with thin primary melanoma. J Am Acad Dermatol. 2013;68:560–567. doi: 10.1016/j.jaad.2012.08.045. [DOI] [PubMed] [Google Scholar]
- 48.Murali R, Haydu LE, Quinn MJ, et al. Sentinel lymph node biopsy in patients with thin primary cutaneous melanoma. Ann Surg. 2012;255:128–133. doi: 10.1097/SLA.0b013e3182306c72. [DOI] [PubMed] [Google Scholar]
- 49.Paik S, Tang G, Shak S, et al. Gene expression and benefit of chemotherapy in women with node-negative, estrogen receptor-positive breast cancer. J Clin Oncol. 2006;24:3726–3734. doi: 10.1200/JCO.2005.04.7985. [DOI] [PubMed] [Google Scholar]
- 50.Hoek KS, Schlegel NC, Brafford P, et al. Metastatic potential of melanomas defined by specific gene expression profiles with no BRAF signature. Pigment Cell Res. 2006;19:290–302. doi: 10.1111/j.1600-0749.2006.00322.x. [DOI] [PubMed] [Google Scholar]
- 51.Stefansson S, Lawrence DA. The serpin PAI-1 inhibits cell migration by blocking integrin αvβ 3 binding to vitronectin. Nature. 1996;383:441–443. doi: 10.1038/383441a0. [DOI] [PubMed] [Google Scholar]
- 52.Bao W, Strömblad S. Integrin alphav-mediated inactivation of p53 controls a MEK1-dependent melanoma cell survival pathway in three-dimensional collagen. J Cell Biol. 2004;167:745–756. doi: 10.1083/jcb.200404018. [DOI] [PMC free article] [PubMed] [Google Scholar]
- 53.Muller PA, Caswell PT, Doyle B, et al. Mutant p53 drives invasion by promoting integrin recycling. Cell. 2009;139:1327–1341. doi: 10.1016/j.cell.2009.11.026. [DOI] [PubMed] [Google Scholar]
- 54.Sloan EK, Pouliot N, Stanley KL, et al. Tumor-specific expression of αvβ3 integrin promotes spontaneous metastasis of breast cancer to bone. Breast Cancer Res. 2006;8:R20. doi: 10.1186/bcr1398. [DOI] [PMC free article] [PubMed] [Google Scholar]
- 55.Hsu MY, Shih DT, Meier FE, et al. Adenoviral gene transfer of beta3 integrin subunit induces conversion from radial to vertical growth phase in primary human melanoma. Am J Pathol. 1998;153:1435–1442. doi: 10.1016/s0002-9440(10)65730-6. [DOI] [PMC free article] [PubMed] [Google Scholar]
- 56.Gerami P, Barnhill RL, Beilfuss BA, et al. Superficial melanocytic neoplasms with pagetoid melanocytosis: A study of interobserver concordance and correlation with FISH. Am J Surg Pathol. 2010;34:816–821. doi: 10.1097/PAS.0b013e3181dd1e72. [DOI] [PubMed] [Google Scholar]