

Abstract
Purpose
African American women are more likely to die as a result of breast cancer than white women. The influence of somatic genomic profiles on this racial disparity is unclear. We aimed to compare the racial distribution of tumor genomic characteristics and breast cancer recurrence.
Methods
We assessed white and African American women with stage I to III breast cancer diagnosed from 1988 to 2013 and primary tumors submitted to The Cancer Genome Atlas from 2010 to 2014. We used Cox proportional hazards models to evaluate the association of race and genetic traits with tumor recurrence.
Results
We investigated exome sequencing and gene expression data in 663 and 711 white and 105 and 159 African American women, respectively. African Americans had more TP53 mutations (42.9% v 27.6%; P = .003) and fewer PIK3CA mutations (20.0% v 33.9%; P = .008). Intratumor genetic heterogeneity was greater in African American than white tumors overall by 5.1 units (95% CI, 2.4 to 7.7) and within triple-negative tumors by 4.1 units (95% CI, 1.4 to 6.8). African Americans had more basal tumors by the 50-gene set predictor using the predication analysis of microarray method (PAM50; 39.0% v 18.6%; P < .001) and fewer PAM50 luminal A tumors (17.0% v 34.7%; P < .001). Among triple-negative subtypes, African Americans had more basal-like 1 and mesenchymal stem-like tumors. African Americans had a higher risk of tumor recurrence than whites (hazard ratio, 2.22; 95% CI, 1.05 to 4.67). Racial differences in TP53 mutation, PAM50 basal subtype, and triple-negative tumor prevalence but not intratumor genetic heterogeneity influenced the magnitude and significance of the racial disparity in tumor recurrence.
Conclusion
African Americans had greater intratumor genetic heterogeneity and more basal gene expression tumors, even within triple-negative breast cancer. This pattern suggests more aggressive tumor biology in African Americans than whites, which could contribute to racial disparity in breast cancer outcome.
INTRODUCTION
Breast cancer is the most common noncutaneous cancer among women in the United States, with a 12% lifetime risk in US women.1 Approximately 231,840 women will be diagnosed with and 40,290 women will die as a result of breast cancer in 2015.2 Although treatment advancements have substantially lowered the mortality rate for breast cancer,3 the decline in mortality rate in African American women has lagged behind that in white women.1,4 African American women are 40% more likely to die as a result of breast cancer than white women in the United States.5 Although patients with breast cancer should have the same opportunities for treatment success regardless of their race, inequity in breast cancer outcome more heavily affects minority women with breast cancer and their families. This is particularly concerning because equitable care is paramount to health care quality. Reducing health care disparities is a specific goal of the national strategy to improve health.6 Addressing inequities in cancer treatment and mortality will help to alleviate the overall burden of cancer on US society.7
The reasons underlying the racial disparity in breast cancer outcome are multifactorial. Socioeconomic issues, including income, access to care, trust in physicians, and treatment delays, play a critical role.8–12 However, many studies have found that the disparity remains even after adjustment for socioeconomic and treatment differences.9–11 Some studies have suggested that tumor biology may contribute to the inequity.13,14 Although triple-negative breast cancers (TNBCs) are known to occur more frequently among African Americans,14–18 the influence of somatic genomic profiles on breast cancer disparity is not clear. Gene expression analyses by race in primary breast cancer have identified intriguing differences,19–25 such as higher expression of dysregulated cell-cycle genes and lower expression of cell-adhesion genes in African Americans.24 However, all but one of these studies did not explore whether the observed gene expression differences were related to racial disparity in breast cancer outcome. Thus, the contribution of genomic profiles to racial differences in clinical outcome is uncertain.
To address the dearth of large studies probing racial differences in breast tumor genomic traits, the objectives of this study were to determine the racial distribution of genotypic traits, including tumor-specific somatic mutations, subclonal intratumor genetic heterogeneity, and gene expression profiles, and to investigate the contribution of discovered differences to the observed racial disparity in breast tumor recurrence.
METHODS
Clinical Variables
We used all available breast cancer data from The Cancer Genome Atlas (TCGA).26 The patient cases of breast cancer were diagnosed between 1988 and 2013, with a median diagnosis year of 2009. The clinical data were submitted to TCGA between August 2010 and November 2014. Only woman with white or African American race were included. Stage IV tumors were excluded because tumor recurrence could not be adequately assessed. Clinical subtype, staging,27 and recurrence were defined by standard protocols described in the Data Supplement.
Genomic Variables
Tumor-specific somatic mutations from whole-exome sequencing of these primary breast tumors in TCGA were analyzed.26 Exome sequencing was performed with a minimum of 70% coverage at 20× depth and 90% genotype concordance with single-nucleotide polymorphism array data.28 The most frequently mutated genes for each race were determined as the genes that had mutations across the largest number of tumors. Only genes that were found in prior analyses to be mutated in > 5% of patients with breast cancer and to be potential driver mutations were included.29
We assessed somatic mutation number per tumor and intratumor genetic heterogeneity, measured by the mutant-allele tumor heterogeneity (MATH) algorithm.30 MATH was calculated as the percentage ratio of the median absolute deviation to the median of the variant allele fractions among all loci having tumor-specific mutations.30 In head and neck squamous cell carcinoma, each 10% increase in MATH was associated with an 8.8% increase in hazard of death.31
Gene expression signatures were assessed with RNA sequencing data from TCGA.26,28 Tumor samples were categorized by a 50-gene set predictor that employed the predication analysis of microarray method (PAM50).32 Within this gene expression data set, TNBC tumors were identified as tumors negative for estrogen receptor, progesterone receptor, and human epidermal growth factor receptor 2 (HER2) by immunohistochemistry. Seven additional possible estrogen receptor–positive samples were filtered out because of ESR1 expression > 75% of the genes in the sample.33 Using the online TNBC type predictor tool,34 these TNBC tumors were categorized into six previously identified gene expression subtypes: basal-like 1 and 2, immunomodulatory, mesenchymal, mesenchymal stem-like, and luminal androgen receptor.33
Statistical Analysis
Clinical and genomic characteristics were compared by race using one-way analysis of variance for continuous variables, χ2 distributions for categorical variables, and Kruskal-Wallis rank test for skewed variables. Given normally distributed residuals, MATH was also used as the dependent variable in generalized linear regression models using the identity link corrected for age as a linear predictor and stage as a three-level factor variable. The prevalence of somatic mutations and PAM50 gene expression subtypes was compared by race with logistic regression models adjusted for age and stage. Firth logistic regression analysis was used for TNBC gene expression subtypes, given the small sample sizes.
Disease progression analyses were conducted based on pooled TCGA follow-up data using number of days from initial pathologic diagnosis to tumor recurrence or last follow-up, with death handled as a competing risk event.26 Cumulative incidence graphs for time to progression were constructed for all tumors and for each subtype by race. Gray's test was used to calculate P values to compare curves within each graph. Cox proportional hazards models adjusted for age and stage were used to evaluate the association of race, MATH, TP53 mutation, PAM50 basal subtype (basal v nonbasal), and PAM50 subtype (five indicator variables) with risk of tumor recurrence. A propensity score analysis matching African Americans and whites on age, hormone receptor (HR) –positive status, MATH, TNBC, TP53 and PIK3CA mutations, and PAM50 basal status further probed the racial differences in tumor recurrence. Stage was not included in the propensity score analysis, because stage distributions for African Americans and whites were not different and including stage worsened the bias reduction. Statistical analyses were conducted using STATA software (version 13.1; STATA, College Station, TX). A two-tailed P value < .05 was considered significant.
RESULTS
Primary Breast Tumor Characteristics
The whole-exome sequencing data set consisted of somatic gene mutations in primary breast cancers from 105 African American and 663 white women. African Americans were younger and had significantly fewer HR-positive tumors and significantly more TNBCs than whites (Table 1). There was no significant difference in stage at diagnosis by race (Table 1). Samples from African American and white patients were obtained from a similar number of clinical sites, with eight and seven sites each contributing > 5% of African American and white samples, respectively.
Table 1.
Primary Breast Cancer Characteristics
| Characteristic | African American (n = 105; %) | White (n = 663; %) | P |
|---|---|---|---|
| Age at diagnosis, years | .02 | ||
| Median | 53.7 | 59.6 | |
| IQR | 46.5-66.2 | 49.5-67.9 | |
| Triple-negative breast cancer | 36.3 | 13.7 | < .001 |
| HER2 positive | 16.8 | 17.1 | .96 |
| Hormone receptor positive | 42.9 | 67.3 | < .001 |
| Stage at diagnosis | .93 | ||
| I | 21.0 | 19.9 | |
| II | 58.1 | 57.6 | |
| III | 21.0 | 22.5 | |
| Gene mutation | |||
| TP53 | 42.9 | 27.6 | .001 |
| PIK3CA | 20.0 | 33.9 | .004 |
| GATA3 | 8.6 | 9.8 | .69 |
| CDH1 | 7.6 | 11.8 | .21 |
| MLLT3 | 11.4 | 6.2 | .05 |
| Follow-up, months | .15 | ||
| Median | 29.9 | 24.4 | |
| IQR | 17.2-48.0 | 15.4-44.7 | |
| Tumor recurrence | 10.6 | 4.6 | .02 |
NOTE. Sample sizes for whole-exome sequencing data set for triple-negative breast cancer, HER2 positivity, hormone receptor positivity, stage I, II, and III disease, months of follow-up, and tumor recurrence for African Americans and whites were n = 102 and 612, 95 and 580, 98 and 587, 22 and 132, 61 and 382, 22 and 149, 94 and 526, and 94 and 526, respectively.
Abbreviations: HER2, human epidermal growth factor 2; IQR, interquartile range.
Somatic Mutation Prevalence
The five genes with the highest mutation prevalence were the same for each race (Table 1). The top two genes showed different racial patterns, with African Americans having more TP53 mutations (42.9% v 27.6%) and fewer PIK3CA mutations (20.0% v 33.9%) than whites (Table 1). After adjustment for age and stage, African Americans had higher odds of TP53 mutation (odds ratio [OR], 1.90; 95% CI, 1.24 to 2.92) and lower odds of PIK3CA mutation (OR, 0.50; 95% CI, 0.30 to 0.83; Data Supplement). Within TNBC, there was a similar trend but no difference by race in odds of TP53 or PIK3CA mutation (Data Supplement). There was no significant racial difference in these mutations within HER2-positive or HR-positive tumors (Data Supplement).
Intratumor Genetic Heterogeneity and Mutation Number per Tumor
Overall intratumor genetic heterogeneity as measured by median MATH was 38.9 units (interquartile range, 30.1 to 48.3 units). High intratumor heterogeneity was associated with breast cancer subtypes with worse prognosis. For PAM50 subtypes, MATH was higher in basal versus nonbasal tumors by 4.66 units (95% CI, 2.40 to 6.92) and in luminal B versus A tumors by 5.50 units (95% CI, 2.92 to 8.09) after adjustment for age and stage. Within TNBC gene expression subtypes, MATH was significantly higher in basal-like 1 compared with nonbasal-like 1 tumors by 9.69 units (95% CI, 3.50 to 15.89) after correcting for age and stage.
High intratumor heterogeneity was also associated with African American race. In unadjusted analyses, MATH was greater in African Americans overall and within TNBC and HR-positive tumors (Data Supplement). In generalized linear regression models adjusted for age and stage, MATH was greater by 5.1 units (95% CI, 2.4 to 7.7) in African Americans than whites overall (Data Supplement). After additional adjustment for TNBC, MATH remained greater by 4.1 units (95% CI, 1.4 to 6.8) in African Americans than whites overall.
The overall median for somatic mutation number per tumor was 42.0 (interquartile range, 27.0 to 75.5). In unadjusted analyses, mutation number per tumor was greater in African Americans overall and within HR-positive tumors (Data Supplement). Density plots for mutation number showed that whites had a unique subpopulation of approximately 25 tumors with mutation number > 300, which was not found in African Americans (Data Supplement).
Gene Expression Signatures
The PAM50 gene expression data set consisted of 159 African American and 711 white women, of whom 27 African Americans and 58 whites had TNBC. By PAM50 categorization, African Americans had more basal tumors (39.0% v 18.6%) and fewer luminal A tumors (17.0% v 34.7%; Figs 1A and 1B). Adjusting for age and stage, this corresponded to higher odds of basal tumors (OR, 2.70; 95% CI, 1.85 to 3.95) and lower odds of luminal A tumors (OR, 0.39; 95% CI, 0.25 to 0.60; Table 2).
Fig 1.

Fifty-gene set predictor using predication analysis of microarray method (PAM50) and triple-negative breast cancer (TNBC) gene expression subtypes stratified by race. African Americans compared with whites had (A, B) more basal and fewer luminal A PAM50 tumors and (C, D) more basal-like 1 and mesenchymal stem-like TNBC tumors. P < .05 (adjusted for age and stage).
Table 2.
Gene Expression Subtypes Stratified by Race
| Subtype | No. of Samples* |
Adjusted OR† | 95% CI | Adjusted P | |
|---|---|---|---|---|---|
| African American | White | ||||
| PAM50 | |||||
| Luminal A | 27 | 247 | 0.39 | 0.25 to 0.60 | < .001 |
| Luminal B | 35 | 178 | 0.87 | 0.57 to 1.31 | .51 |
| HER2 | 24 | 84 | 1.32 | 0.81 to 2.16 | .27 |
| Basal-like | 62 | 132 | 2.70 | 1.85 to 3.95 | < .001 |
| Normal-like | 11 | 70 | 0.68 | 0.35 to 1.32 | .25 |
| TNBC | |||||
| Mesenchymal | 4 | 17 | 0.43 | 0.14 to 1.38 | .16 |
| Mesenchymal stem-like | 5 | 3 | 4.38 | 1.01 to 18.97 | .048 |
| Luminal androgen receptor | 0 | 4 | 0.13 | 0.01 to 3.08 | .21 |
| Immunomodulatory | 7 | 10 | 1.62 | 0.54 to 4.83 | .38 |
| Basal-like 1 | 7 | 4 | 6.21 | 1.53 to 25.25 | .01 |
| Basal-like 2 | 3 | 6 | 1.06 | 0.25 to 4.39 | .94 |
| Unsure | 1 | 14 | 0.19 | 0.03 to 1.08 | .06 |
NOTE. Odds ratios (ORs) adjusted for age and sex.
Abbreviations: HER2, human epidermal growth factor receptor 2; PAM50, 50-gene set predictor using predication analysis of microarray method; TNBC, triple-negative breast cancer.
For RNA sequencing data set.
African Americans compared with whites.
Although the numbers were small, the TNBC subtype analysis revealed that African Americans had more basal-like 1 and mesenchymal stem-like tumors (Figs 1C and 1D). Adjusting for age and stage, this corresponded to higher odds of basal-like 1 (OR, 6.21; 95% CI, 1.53 to 25.25) and mesenchymal stem-like (OR, 4.38; 95% CI, 1.01 to 18.97) tumors (Table 2). Similarly, African Americans had higher age- and stage-adjusted odds of having basal-like 1 or 2 tumors than whites (OR, 3.24; 95% CI, 1.12 to 9.36).
Tumor Recurrence
The cumulative incidence analysis showed that African American women had shorter time to progression than white women (Fig 2A). This difference persisted among those with TNBC (Fig 2B) but not among those with HR-positive or HER2-positive tumors (Data Supplement). TNBC tumors with high and low MATH had similar time to progression (Data Supplement). African Americans with basal tumors had shorter time to disease progression than African Americans with nonbasal tumors, and interestingly, African Americans with nonbasal tumors had similar time to disease progression as compared with whites with nonbasal tumors (Fig 2C), suggesting that basal tumors are potentially an important contributor to the racial disparity in outcome.
Fig 2.
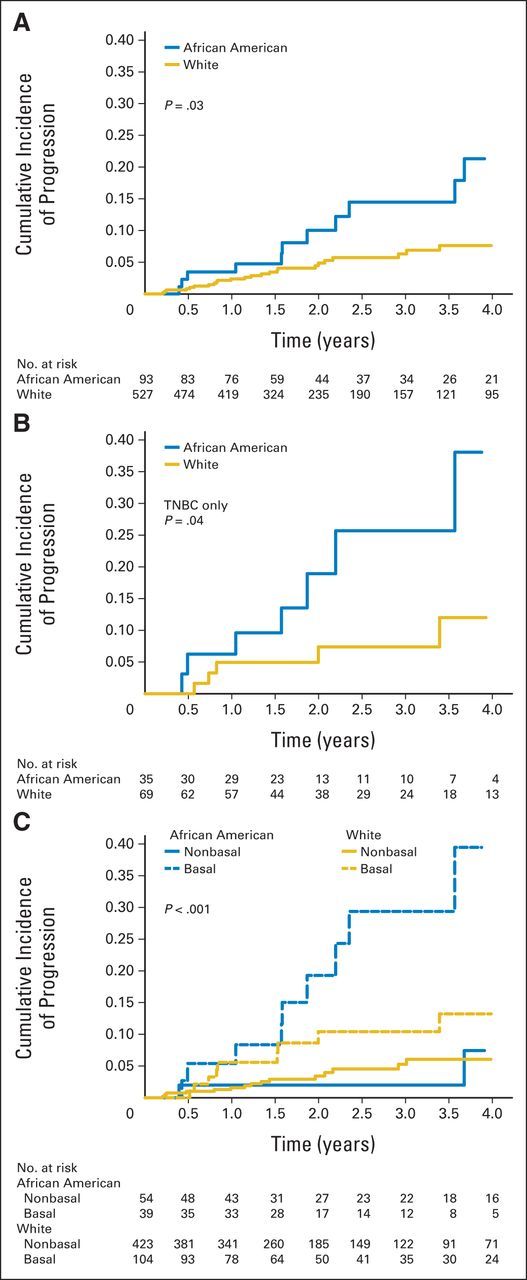
Cumulative incidence of progression by race for (A) all tumors, (B) triple-negative breast cancer (TNBC), and (C) basal tumors by 50-gene set predictor using predication analysis of microarray method.
We then analyzed the association between race and clinical outcome using multivariable models, adjusting for the key variables. The Cox proportional hazards analysis for tumor recurrence consisted of 526 whites and 94 African Americans with complete data for multivariable models. There were 34 tumor recurrences in this group. Age- and stage-adjusted models showed that African American women had a higher hazard of tumor recurrence than white women (Table 3). MATH was not associated with hazard of tumor recurrence, so adjustment for MATH did not change the racial difference in tumor recurrence (Table 3). TP53 mutation, PAM50 basal subtype, TNBC, and PAM50 overall subtype were all significantly associated with tumor recurrence (Table 3). Separate adjustment for each of these four variables decreased the magnitude and significance of the racial association with tumor recurrence. The reduction was largest and similar after adjustment for TNBC or PAM50 basal or overall subtype (Table 3). There was no interaction between race and TNBC (P = .51) or race and basal tumors (P = .92) with respect to tumor recurrence. Results for the larger combined data set with all available data were similar (Data Supplement). Cox regression using propensity scores matched on age, HR-positive status, MATH, TNBC, TP53 and PIK3CA mutations, and PAM50 basal status found no difference in tumor recurrence when comparing African Americans with whites (hazard ratio, 1.39; 95% CI, 0.68 to 2.84; P = .36).
Table 3.
Age- and Stage-Adjusted Hazard Ratios for Tumor Recurrence
| Characteristic | Hazard Ratio | 95% CI | P |
|---|---|---|---|
| African American v white race | 2.15 | 1.04 to 4.48 | .04 |
| African American v white race also adjusted for:* | |||
| MATH | 2.11 | 1.03 to 4.34 | .04 |
| TP53 mutation | 1.93 | 0.90 to 4.14 | .09 |
| PAM50 basal subtype | 1.48 | 0.67 to 3.27 | .33 |
| TNBC | 1.47 | 0.68 to 3.14 | .32 |
| PAM50 subtype | 1.35 | 0.62 to 2.95 | .45 |
| Multivariable model | 1.24 | 0.57 to 2.71 | .59 |
| MATH | 1.01 | 0.99 to 1.03 | .53 |
| TP53 mutation | 2.06 | 1.03 to 4.11 | .04 |
| PAM50 basal subtype | 3.82 | 1.86 to 7.85 | < .001 |
| TNBC | 3.86 | 1.84 to 8.12 | < .001 |
| PAM50 subtype | |||
| Luminal A | Referent | Referent | Referent |
| Luminal B | 2.07 | 0.76 to 5.66 | .16 |
| HER2 | 1.31 | 0.32 to 5.33 | .71 |
| Basal-like† | 4.84 | 1.91 to 12.26 | .001 |
| Normal-like | 0.40 | 0.05 to 2.97 | .37 |
NOTE. African Americans, n = 94; whites, n = 526; hazard ratio for tumor recurrence, n = 34.
Abbreviations: HER2, human epidermal growth factor receptor 2; MATH, mutant allele tumor heterogeneity; PAM50, 50-gene set predictor using predication analysis of microarray method; TNBC, triple-negative breast cancer.
Hazard ratio for tumor recurrence comparing African Americans with whites adjusted for age and stage, separately for MATH, TP53 mutation, basal v nonbasal PAM50 subtype, TNBC, PAM50 subtype (with indicator variables), or in multivariable model including all of these variables.
Hazard ratio comparing PAM50 basal subtype with PAM50 luminal A subtype.
DISCUSSION
To our knowledge, this is the first study to systematically characterize the racial pattern of genomic and gene expression traits in primary breast tumors and evaluate the relationship of these racial patterns with tumor recurrence. Our study found that in addition to having a higher prevalence of TNBC than white women, African American women had significantly greater intratumor genetic heterogeneity and more TP53 mutations, PAM50 basal tumors, and TNBC basal-like 1 and mesenchymal stem-like tumors, all of which suggest more aggressive tumor biology. Not surprisingly, the observed higher risk of tumor recurrence in African Americans compared with whites was attenuated in multivariable analysis adjusting for some of these genomic factors, specifically TP53 mutation and PAM50 basal and overall subtypes, suggesting that differences in tumor genomic profile contribute, at least partly, to the known racial disparity in breast cancer–free survival between African American and white patients with breast cancer.
This study described the racial pattern of breast cancer somatic mutations previously identified as driver mutations.29 The most frequent mutations in breast tumors of African American and white patients were TP53, PIK3CA, CDH1, GATA3, MLLT3, and MAP3K1 mutations, albeit with different frequencies by race. These mutations might have implications as genotype-driven targeted therapies are developed in breast cancer. TP53 and PIK3CA each had significantly different mutation prevalence by race that was consistent with the observed difference in PAM50 subtype; as luminal tumors are more likely to have PIK3CA mutations, and basal tumors are more likely to have TP53 mutations.18,35 These findings support previous reports showing more TNBCs and TP53 mutations in African Americans.18,36
Although TNBC is more frequent in African Americans than whites, intratumor genetic heterogeneity was higher in African American than white primary breast tumors even within TNBC. Greater intratumor genetic heterogeneity in African American tumors may reflect either greater underlying genomic instability or more exposure to epigenetic or environmental agents of DNA damage.37 Either way, the greater genomic diversity within African American tumors suggests a greater capacity for clonal evolution that may contribute to aggressive or therapy-resistant disease.
This work builds on prior studies of racial differences in breast tumor gene expression subtype. Similar to one previous analysis,19 our study showed that African Americans versus whites were more likely to have PAM50 basal tumors and less likely to have PAM50 luminal A tumors. Other gene expression studies have reported specific genes that are differentially expressed by race, which include some of the genes comprising the PAM50 subtypes.20–24 For instance, African Americans are more likely than whites to display low to no expression of the estrogen receptor gene ESR1,24 progesterone receptor gene PGR,24 HER2 gene ERBB2,24 and cell-cycle regulator gene FOXA1,22 which are part of the PAM50 algorithm and have low to no expression in the basal-like subgroup.33 Our study also demonstrated that African Americans had a higher prevalence of basal-like 1 TNBC than whites, similar to the findings of one prior study.23 Our study extended the results of the prior study by linking gene expression profiles to MATH score to show that basal-like 1 tumors had higher intratumor genetic heterogeneity than other TNBC tumors. This is consistent with the higher expression of proliferation genes and DNA damage response pathways in the basal-like 1 subtype and the greater response of the basal-like 1 subtype to cisplatin therapy, which exacerbates existing DNA repair defects.33 These findings indicate that African Americans are more likely to have tumors with high genomic instability that may respond better to treatments targeting this genomic characteristic.
This study further helps to clarify the contribution of tumor genomic traits to the known racial disparity in breast cancer recurrence. The observation in this study that adjustment for TNBC, TP53 mutation, or PAM50 basal subtype attenuated the higher risk of tumor recurrence in African Americans may signify that this racial difference is explained partially by the higher prevalence of TNBC and basal-like tumors in African Americans. A prior study that also observed a higher risk of recurrence in African Americans found that adjustment for PAM50 subtype did not attenuate this disparity.25 This may be explained by the different enrollment time periods (1996 to 2000 and 2006 to 2008), geographic distribution (primarily northern California), or adjustment variables (age, stage, education, income, tumor size, nodes, grade, chemotherapy, radiation therapy, hormone therapy, comorbidity, age at first birth, parity, breast feeding, smoking, body mass index, alcohol, and physical activity) of that study compared with ours.25 Additional research is needed to evaluate the observed findings and provide a deeper understanding of the complex association between tumor genomics and outcome among the racial subgroups.
Strengths of our study include its large sample size, whole-exome sequencing data, measurement of intratumor genetic heterogeneity, evaluation of gene expression profiles, and clinical outcome analysis. Limitations include a lack of information on cause of death that prevented an analysis of racial differences in breast cancer–specific mortality, the potential for nonrandom data selection in TCGA that may have contributed to the observed racial differences, and short follow-up time that restricted the interpretation of all nonstatistically significant recurrence relationships. In particular, the short follow-up time precluded the observation of outcome differences in HR-positive tumors, which usually recur after the first 5 years, as opposed to TNBCs, which generally recur within the first 5 years. Moreover, the study did not have information on sociodemographic factors, germline mutations, or treatment variables. The lack of information about chemotherapy specifically may have limited our ability to discern an influence of MATH on breast cancer outcome, because MATH has been observed to be more related to outcome among patients with head and neck cancer receiving chemotherapy compared with other therapies.34 Future studies with larger TNBC cohorts are needed to better elucidate racial differences in TNBC genomics adjusted for socioeconomic, germline, and therapeutic influences.
The major findings of this study are that tumors of African American women had greater genetic heterogeneity and a larger burden of the basal gene expression subtype, even within TNBC. Adjustment for the observed difference in basal subtype decreased the magnitude and significance of the known racial disparity in breast cancer recurrence. These observations suggest that poor breast cancer outcome in African American women may be driven not only by a greater burden of TNBC but also by genomic profile differences that make TNBCs in African Americans more aggressive than TNBCs in whites. These results highlight the critical need for research investigating the underlying pathogenesis and exploiting therapeutically the distinct biology of basal-like TNBC. Ultimately, this work underscores the potential for individualized tumor molecular analysis to mitigate the racial divide in breast cancer outcome.
Supplementary Material
Glossary Term
- genomics:
the scientific discipline in which multiple genes, gene products, or regions of the genome are analyzed via large-scale, high-throughput molecular approaches directed to DNA and RNA. This definition is a deviation from that of the original term, which meant an analysis of the whole genome.
Footnotes
Supported in part by a Jerry Younger Grant for Clinical and Translational Breast Cancer Research.
Presented at the 37th Annual San Antonio Breast Cancer Symposium, San Antonio, TX, December 9-13, 2014, and the 51st Annual Meeting of the American Society of Clinical Oncology, Chicago, IL, May 29-June 2, 2015.
Terms in blue are defined in the glossary, found at the end of this article and online at www.jco.org.
Authors' disclosures of potential conflicts of interest are found in the article online at www.jco.org. Author contributions are found at the end of this article.
AUTHORS' DISCLOSURES OF POTENTIAL CONFLICTS OF INTEREST
Disclosures provided by the authors are available with this article at www.jco.org.
AUTHOR CONTRIBUTIONS
Conception and design: Tanya Keenan, Beverly Moy, Leif W. Ellisen, Aditya Bardia
Collection and assembly of data: Tanya Keenan, Edmund A. Mroz, Kenneth Ross, Aditya Bardia
Data analysis and interpretation: Tanya Keenan, Edmund A. Mroz, Kenneth Ross, Andrzej Niemierko, James W. Rocco, Steven Isakoff, Leif W. Ellisen, Aditya Bardia
Manuscript writing: All authors
Final approval of manuscript: All authors
AUTHORS' DISCLOSURES OF POTENTIAL CONFLICTS OF INTEREST
Comparison of the Genomic Landscape Between Primary Breast Cancer in African American Versus White Women and the Association of Racial Differences With Tumor Recurrence
The following represents disclosure information provided by authors of this manuscript. All relationships are considered compensated. Relationships are self-held unless noted. I = Immediate Family Member, Inst = My Institution. Relationships may not relate to the subject matter of this manuscript. For more information about ASCO's conflict of interest policy, please refer to www.asco.org/rwc or jco.ascopubs.org/site/ifc.
Tanya Keenan
No relationship to disclose
Beverly Moy
Consulting or Advisory Role: MOTUS (I), Olympus (I)
Edmund A. Mroz
Patents, Royalties, Other Intellectual Property: Massachusetts General Hospital has filed patent application based on MATH with Drs Mroz and Rocco listed as inventors (Inst)
Kenneth Ross
No relationship to disclose
Andrzej Niemierko
No relationship to disclose
James W. Rocco
Patents, Royalties, Other Intellectual Property: Massachusetts General Hospital has filed patent application based on MATH with Drs Mroz and Rocco listed as inventors (Inst)
Steven Isakoff
Consulting or Advisory Role: Myriad Genetics
Research Funding: Genentech, PharmaMar, Abbvie
Travel, Accommodations, Expenses: Genentech, Myriad Genetics
Leif W. Ellisen
Consulting or Advisory Role: Bioreference/GeneDx Laboratory, Vertex
Aditya Bardia
Consulting or Advisory Role: Novartis, Immunomedics, Genentech
REFERENCES
- 1.Howlader N, Noone AM, Krapcho M, et al., editors. SEER cancer statistics review, 1975-2011. http://seer.cancer.gov/csr/1975_2011/
- 2.Siegal RL, Miller KD, Jemal A. Cancer statistics, 2015. CA Cancer J Clin. 2015;65:5–29. doi: 10.3322/caac.21254. [DOI] [PubMed] [Google Scholar]
- 3.Berry DA, Cronin KA, Plevritis SK, et al. Effect of screening and adjuvant therapy on mortality from breast cancer. N Engl J Med. 2005;353:1784–1792. doi: 10.1056/NEJMoa050518. [DOI] [PubMed] [Google Scholar]
- 4.Akinyemiju TF, Soliman AS, Copeland G, et al. Trends in breast cancer stage and mortality in Michigan (1992-2009) by race, socioeconomic status, and area healthcare resources. PLoS One. 2013;8:e61879. doi: 10.1371/journal.pone.0061879. [DOI] [PMC free article] [PubMed] [Google Scholar]
- 5.Centers for Disease Control and Prevention (CDC) Vital signs: Racial disparities in breast cancer severity—United States, 2005-2009. MMWR Morb Mortal Wkly Rep. 2012;61:922–926. [PubMed] [Google Scholar]
- 6. Pub Law 111-148, Patient Protection and Affordable Care Act, March 23, 2010.
- 7.Moy B, Polite BN, Halpern MT, et al. American Society of Clinical Oncology policy statement: Opportunities in the Patient Protection and Affordable Care Act to reduce cancer care disparities. J Clin Oncol. 2011;29:3816–3824. doi: 10.1200/JCO.2011.35.8903. [DOI] [PubMed] [Google Scholar]
- 8.Sheppard VB, Isaacs C, Luta G, et al. Narrowing racial gaps in breast cancer chemotherapy initiation: The role of the patient-provider relationship. Breast Cancer Res Treat. 2013;139:207–216. doi: 10.1007/s10549-013-2520-3. [DOI] [PMC free article] [PubMed] [Google Scholar]
- 9.Smith EC, Ziogas A, Anton-Culver H. Delay in surgical treatment and survival after breast cancer diagnosis in young women by race/ethnicity. JAMA Surg. 2013;148:516–523. doi: 10.1001/jamasurg.2013.1680. [DOI] [PubMed] [Google Scholar]
- 10.Tannenbaum SL, Koru-Sengul T, Miao F, et al. Disparities in survival after female breast cancer diagnosis: A population-based study. Cancer Causes Control. 2013;24:1705–1715. doi: 10.1007/s10552-013-0246-5. [DOI] [PubMed] [Google Scholar]
- 11.Parise CA, Caggiano V. Disparities in race/ethnicity and socioeconomic status: Risk of mortality of breast cancer patients in the California cancer registry, 2000-2010. BMC Cancer. 2013;13:449. doi: 10.1186/1471-2407-13-449. [DOI] [PMC free article] [PubMed] [Google Scholar]
- 12.Nurgalieva ZZ, Franzini L, Morgan RO, et al. Impact of timing of adjuvant chemotherapy initiation and completion after surgery on racial disparities in survival among women with breast cancer. Med Oncol. 2013;30:419. doi: 10.1007/s12032-012-0419-1. [DOI] [PubMed] [Google Scholar]
- 13.Silber JH, Rosenbaum PR, Clark AS, et al. Characteristics associated with differences in survival among black and white women with breast cancer. JAMA. 2013;310:389–397. doi: 10.1001/jama.2013.8272. [DOI] [PubMed] [Google Scholar]
- 14.Iqbal J, Ginsburg O, Rochon PA, et al. Differences in breast cancer stage at diagnosis and cancer-specific survival by race and ethnicity in the United States. JAMA. 2015;313:165–173. doi: 10.1001/jama.2014.17322. [DOI] [PubMed] [Google Scholar]
- 15.Batina NG, Trentham-Dietz A, Gangnon RE, et al. Variation in tumor natural history contributes to racial disparities in breast cancer stage at diagnosis. Breast Cancer Res Treat. 2013;138:519–528. doi: 10.1007/s10549-013-2435-z. [DOI] [PMC free article] [PubMed] [Google Scholar]
- 16.Perez CA, Zumsteg ZS, Gupta G, et al. Black race as a prognostic factor in triple-negative breast cancer patients treated with breast-conserving therapy: A large, single-institution retrospective analysis. Breast Cancer Res Treat. 2013;139:497–506. doi: 10.1007/s10549-013-2550-x. [DOI] [PubMed] [Google Scholar]
- 17.Gleason MX, Mdzinarishvili T, Sherman S. Breast cancer incidence in black and white women stratified by estrogen and progesterone receptor statuses. PLoS One. 2012;7:e49359. doi: 10.1371/journal.pone.0049359. [DOI] [PMC free article] [PubMed] [Google Scholar]
- 18.Carey LA, Perou CM, Livasy CA, et al. Race, breast cancer subtypes, and survival in the Carolina Breast Cancer Study. JAMA. 2006;295:2492–2502. doi: 10.1001/jama.295.21.2492. [DOI] [PubMed] [Google Scholar]
- 19.Sweeney C, Bernard PS, Factor RE, et al. Intrinsic subtypes from PAM50 gene expression assay in a population-based breast cancer cohort: Differences by age, race, and tumor characteristics. Cancer Epidemiol Biomarkers Prev. 2014;23:714–724. doi: 10.1158/1055-9965.EPI-13-1023. [DOI] [PMC free article] [PubMed] [Google Scholar]
- 20.Field LA, Love B, Deyarmin B, et al. Identification of differentially expressed genes in breast tumors from African American compared with Caucasian women. Cancer. 2012;118:1334–1344. doi: 10.1002/cncr.26405. [DOI] [PubMed] [Google Scholar]
- 21.Martin DN, Boersma BJ, Yi M, et al. Differences in the tumor microenvironment between African-American and European-American breast cancer patients. PLoS One. 2009;4:e4531. doi: 10.1371/journal.pone.0004531. [DOI] [PMC free article] [PubMed] [Google Scholar]
- 22.Stewart PA, Luks J, Roycik MD, et al. Differentially expressed transcripts and dysregulated signaling pathways and networks in African American breast cancer. PLoS One. 2013;8:e82460. doi: 10.1371/journal.pone.0082460. [DOI] [PMC free article] [PubMed] [Google Scholar]
- 23.Lindner R, Sullivan C, Offor O, et al. Molecular phenotypes in triple negative breast cancer from African American patients suggest targets for therapy. PLoS One. 2013;8:e71915. doi: 10.1371/journal.pone.0071915. [DOI] [PMC free article] [PubMed] [Google Scholar]
- 24.Grunda JM, Steg AD, He Q, et al. Differential expression of breast cancer-associated genes between stage- and age-matched tumor specimens from African- and Caucasian-American women diagnosed with breast cancer. BMC Res Notes. 2012;5:248. doi: 10.1186/1756-0500-5-248. [DOI] [PMC free article] [PubMed] [Google Scholar]
- 25.Kroenke CH, Sweeney C, Kwan ML, et al. Race and breast cancer survival by intrinsic subtype based on PAM50 gene expression. Breast Cancer Res Treat. 2014;144:689–699. doi: 10.1007/s10549-014-2899-5. [DOI] [PMC free article] [PubMed] [Google Scholar]
- 26.National Cancer Institute. The Cancer Genome Atlas Data Portal: Data Matrix data sets for whole-exome sequencing and clinical data and for RNA sequencing and clinical data. https://tcga-data.nci.nih.gov/tcga/dataAccessMatrix.htm.
- 27.Edge SB, Byrd DR, Compton CC, et al., editors. AJCC Cancer Staging Manual (ed 7) New York, NY: Springer; 2010. pp. 347–376. [Google Scholar]
- 28.Cancer Genome Atlas Network Comprehensive molecular portraits of human breast tumours. Nature. 2012;490:61–70. doi: 10.1038/nature11412. [DOI] [PMC free article] [PubMed] [Google Scholar]
- 29.Lawrence MS, Stojanov P, Mermel CH, et al. Discovery and saturation analysis of cancer genes across 21 tumour types. Nature. 2014;505:495–501. doi: 10.1038/nature12912. [DOI] [PMC free article] [PubMed] [Google Scholar]
- 30.Mroz EA, Rocco JW. MATH, a novel measure of intratumor genetic heterogeneity, is high in poor-outcome classes of head and neck squamous cell carcinoma. Oral Oncol. 2013;49:211–215. doi: 10.1016/j.oraloncology.2012.09.007. [DOI] [PMC free article] [PubMed] [Google Scholar]
- 31.Mroz EA, Tward AM, Hammon RJ, et al. Intra-tumor genetic heterogeneity and mortality in head and neck cancer: Analysis of data from The Cancer Genome Atlas. PLoS Med. 2015;12:e1001786. doi: 10.1371/journal.pmed.1001786. [DOI] [PMC free article] [PubMed] [Google Scholar]
- 32.Parker JS, Mullins M, Cheang MC, et al. Supervised risk predictor of breast cancer based on intrinsic subtypes. J Clin Oncol. 2009;27:1160–1167. doi: 10.1200/JCO.2008.18.1370. [DOI] [PMC free article] [PubMed] [Google Scholar]
- 33.Lehmann BD, Bauer JA, Chen X, et al. Identification of human triple-negative breast cancer subtypes and preclinical models for selection of targeted therapies. J Clin Invest. 2011;121:2750–2767. doi: 10.1172/JCI45014. [DOI] [PMC free article] [PubMed] [Google Scholar]
- 34.Chen X, Li J, Gray WH, et al. TNBCtype: A subtyping tool for triple-negative breast cancer. Cancer Inform. 2012;11:147–156. doi: 10.4137/CIN.S9983. [DOI] [PMC free article] [PubMed] [Google Scholar]
- 35.Fu X, Osborne CK, Schiff R. Biology and therapeutic potential of PI3K signaling in ER+/HER2-negative breast cancer. Breast. 2013;22(suppl 2):S12–S18. doi: 10.1016/j.breast.2013.08.001. [DOI] [PMC free article] [PubMed] [Google Scholar]
- 36.Jones BA, Kasl SV, Howe CL, et al. African-American/white differences in breast carcinoma: P53 alterations and other tumor characteristics. Cancer. 2004;101:1293–1301. doi: 10.1002/cncr.20500. [DOI] [PubMed] [Google Scholar]
- 37.Ng CK, Pemberton HN, Reis-Filho JS. Breast cancer intratumor genetic heterogeneity: Causes and implications. Expert Rev Anticancer Ther. 2012;12:1021–1032. doi: 10.1586/era.12.85. [DOI] [PubMed] [Google Scholar]
Associated Data
This section collects any data citations, data availability statements, or supplementary materials included in this article.