

SUMMARY
The polarized light microscope reveals orientational order in native molecular structures inside living cells, tissues, and whole organisms. It is a powerful tool used to monitor and analyze the early developmental stages of organisms that lend themselves to microscopic observations. In this article, we briefly discuss the components specific to a traditional polarizing microscope and some historically important observations on: chromosome packing in the sperm head, the first zygote division of the sea urchin, and differentiation initiated by the first asymmetric cell division in the sand dollar. We then introduce the LC-PolScope and describe its use for measuring birefringence and polarized fluorescence in living cells and tissues. Applications range from the enucleation of mouse oocytes to analyzing the polarized fluorescence of the water strider acrosome. We end with new results on the birefringence of the developing chick brain, which we analyzed between developmental stages of days 12–20.
INTRODUCTION
Most biological structures exhibit some degree of alignment that is characteristic of their molecular architecture, such as membranes and filament arrays. A membrane is modeled as a sheet of lipid molecules in which proteins are embedded, all of which maintain some degree of orientation with respect to the membrane plane. Hence, tissues, cells, and organelles that include extensive membranous structures—such as mitochondria, photoreceptors, and the retina—can exhibit birefringence (anisotropy of the refractive index) and dichroism (anisotropy of the absorption coefficient) that are characteristic of their molecular architecture. In addition to membranes, all cells and tissues include filaments that are in themselves anisotropic, such as collagen fibrils, stress fibers made of filamentous actin and myosin, and microtubules that form the mitotic spindle.
The polarized light microscope is used to analyze the anisotropy of a specimen’s optical properties, such as refraction and absorption. Optical anisotropy is a consequence of molecular order, which renders material properties—such as absorption, refraction, and scattering—that depend on the polarization of light. Polarized light microscopy exploits this dependency and provides a sensitive tool to analyze the alignment of molecular bonds or fine structural form in cells and whole organisms.
We tell our story through images of cellular and organismal structures, and by discussing the basic instrumentation needed to record these images. In the process, we hope to show that the polarized light microscope and its modern version, the LC-PolScope, have great potential to reveal, monitor, and analyze the intricate architectural dynamics of the developing embryo. To uniquely illustrate this potential, we include here the first images of optical sections of the chick cerebellum recorded with the LC-PolScope. While still in its infancy, the birefringence images of unstained brain slices and whole-mount samples give tantalizing views of how polarized light can be used to analyze the architecture of the developing brain.
TRADITIONAL POLARIZING MICROSCOPE
The traditional polarized light microscope generally differs from a standard trans-illuminating microscope by the inclusion of a polarizer and a compensator before the condenser, an analyzer behind the objective lens, and a graduated circular revolving stage (Fig. 1). Such a configuration can enhance cellular architecture, as exemplified by the aster assembled in a surf clam extract (Fig. 1B,C; Palazzo et al., 1988). Here, we briefly discuss the polarization optical components of the polarizing microscope.
Figure 1.

Traditional polarized light microscope. A: Schematic optical arrangement of a conventional polarizing microscope. B: Schematic depicting, at its center, the image of an aster as it appears when located between a crossed polarizer (P) and analyzer (A). The arrows on the polarizer and analyzer sheet indicate their transmission directions. An aster is made of birefringent microtubule arrays radiating from a centrosome (aster diameter, 15 μm). Microtubules that run diagonal to the polarizer and analyzer appear bright, while microtubules that run parallel to polarizer or analyzer appear dark. C: Schematic of an aster as it appears when located between a polarizer, analyzer, and a compensator (C), which is made of a uniformly birefringent plate. The arrow in the compensator plate indicates its slow-axis direction. Microtubules that are nearly parallel to the slow axis of the compensator appear bright, while those that are more perpendicular to the slow axis are dark. Therefore, the birefringence of microtubules has a slow axis that is parallel to the polymer axis, as is the case for many biopolymers. Reprinted with permission from Oldenbourg (2013).
Polarizers
Most light sources (halogen bulb, arc burner, light emitting diode) generate unpolarized light, hence the first polarizer located before the condenser optics polarizes the light that illuminates the specimen. The second polarizer serves to analyze the polarization of the light after it passed through the specimen, therefore it is called the analyzer. In its most basic configuration, the polarizing microscope has no compensator so the polarizer and analyzer are in orthogonal orientation such that the analyzer blocks (absorbs) nearly all the light that has passed through the specimen. In this configuration, the image of the specimen looks dark, except for specimen structures that are birefringent or otherwise optically anisotropic and appear bright against the dark background (Fig. 1B). When the specimen is rotated on a revolving stage (around the axis of the microscope), the brightness of any birefringent components change from dark to bright and back to dark four times during a full 360° rotation. A uniformly birefringent specimen structure appears darkest when its optical axes are parallel to the polarizer and analyzer. This is called the extinction orientation of that structure. Rotating the specimen by 45° away from the extinction orientation makes the birefringent part appear brightest. When rotating the specimen, not all birefringent components in the field of view will turn dark at the same orientation because, in general, each component of the specimen has different axial orientations. The radial microtubule array of the aster in Figure 1B illustrates this angular-dependency of image contrast without having to rotate the specimen on the stage.
Compensator
While not absolutely necessary for some basic observations, especially of highly birefringent objects, the compensator can significantly improve the detection and visibility of weakly birefringent objects, is required to determine the slow and fast axis of specimen’s birefringence, and is an indispensable tool for the quantitative measurement of object birefringence. There are several types of compensators; most of them are named for their original inventors. For the observation of weakly birefringent objects, typically encountered in biological specimens, the Brace-Köhler compensator is used most often. It consists of a thin, birefringent plate, often made from mica, with a retardance of a tenth to a thirtieth of a wavelength (λ/10 to λ/30). The birefringent plate is placed in a graduated, rotatable mount and inserted either between the polarizer and condenser, as in Figure 1C, or between the objective lens and the analyzer. The location varies between microscope manufacturers and specific microscope types. In either location, the effect of the Brace-Köhler compensator on the observed image is the same, and its standard usage is independent of its location in the light path. In general, the birefringence of the compensator causes the image background to become brighter, while birefringent specimen parts can turn either brighter or darker than the background, depending on their orientation with respect to the compensator. If the birefringent structure turns brighter, its slow axis aligns more parallel to the compensator’s slow axis, whereas if the structure turns darker, its slow axis aligns more perpendicular to the compensator’s slow axis. Hence, the slow axis of birefringent components in the specimen can be determined based on the known slow-axis orientation of the Brace-Köhler compensator. The compensator can also enhance specimen contrast, and it is used to quantify specimen birefringence by measuring its retardance (see, for example, Oldenbourg, 2013). For example, one can deduce that the slow axis of a microtubule array is parallel to the microtubule axes in the surf clam aster image in Figure 1C.
All biopolymers, when aligned parallel to each other and suspended in an aqueous medium, exhibit birefringence. This is usually due to a combination of form and intrinsic birefringence, such as collagen fibrils, stress fibers made of filamentous actin and myosin, and microtubules that form the mitotic spindle. Double-stranded DNA is also a polymer with high intrinsic birefringence due to the alignment of the aromatic rings that are part of the uniformly stacked base pairs. Figure 2 shows the birefringence observed in a cave cricket sperm head, in which the packing arrangement of DNA results in a series of birefringent domains inside each chromosome (Inoué and Sato, 1966). This amount of detail and contrast in the birefringence pattern can usually only be observed using strain-free objectives and polarization rectifiers that were invented and used by S. Inoué in the traditional polarizing microscope (Inoué and Hyde, 1957). Despite the high optical anisotropy of the DNA molecule, however, condensed chromosomes in meiotic or mitotic cells usually display little birefringence because DNA is wound around histones, canceling the anisotropy of the long, linear molecule by its tight, chromosomal packing.
Figure 2.
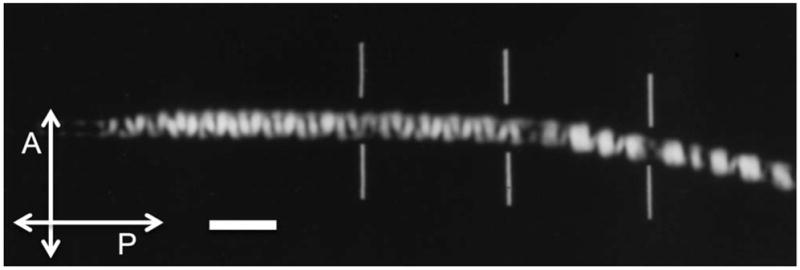
Cave cricket sperm head. Live sperm head of cave cricket viewed between crossed polarizers. The helical regions of the DNA, wound in a coil of coils within the chromosomes, appear bright or dark depending on their orientation with respect to the crossed polarizer (P) and analyzer (A). Bars indicate junctions of chromosomes that are packed in tandem in the needle-shaped sperm head. This is the first (and virtually only) mode of microscopy by which the packing arrangement of DNA and the chromosomes have been clearly imaged in live sperm of any species. The sperm head was immersed in dimethyl sulfoxide for index matching, and imaged with a high-resolution polarizing microscope using rectified optics (97–/1.25 NA). Scale bar, 2 μm. Figure adapted from Inoue and Sato (1966).
The spindle apparatus of dividing cells induces significant birefringence, which has been instrumental in establishing the filamentous nature of the molecules building the spindle (Inoué, 1953) and their assembly/disassembly dynamics that contributes to the generation of mechanical force acting during mitosis and related movements (Inoue and Salmon, 1995). Figure 3, for example, shows a series of birefringent features that appear in the center of a freshly fertilized sea urchin egg observed with a polarizing microscope (Salmon and Wolniak, 1990). These features are generated by the birefringence of the parallel arrays of microtubules that form the mitotic spindle and astral rays in dividing, eukaryotic cells (Sato et al., 1975). In addition to the mitotic spindle, the images in Figure 3 show the strong birefringence of the fertilization envelope that surrounds the cell and is formed by tangentially aligned filaments and paracrystalline polymer layers (Chandler and Heuser, 1980). Similarly, Figure 4 shows the fourth cleavage division in the egg of the sand dollar, Echinarachnius parma (Inoué and Kiehart, 1978; Inoue, 1981). The characteristically asymmetric cleavage of the eight-cell stage embryo is viewed from its vegetal pole in polarized light. In early anaphase, the positively birefringent spindles and the asters at the center of each of the four cells are in focus, standing out in bright or dark contrast. The spindles are tilted towards the observer at the vegetal pole (the middle of the picture). In this orientation, the astral birefringence is weak and the spindle fibers do not converge at the poles. In telophase, the four cells have cleaved perpendicular to the spindle axes and have given rise to four micromeres and four macromeres. Portions of the (birefringent) fertilization membrane can be seen as bright crescents at the top and bottom of the pictures.
Figure 3.

Sea urchin zygote first division. Birefringence of spindle, asters, and fertilization envelope in the early zygote of the sea urchin Lytechinus variegatus. a: The streak stage. After a large, weakly birefringent monaster with radially aligned, slow-axis directions disappears, its mid-region turns into a birefringent streak with a slow axis perpendicular to the streak. b: The streak is replaced by a compact birefringent spindle with a slow axis now parallel to the spindle axis. c: The spindle and astral birefringence increases as they develop further in pro-metaphase. d: In full metaphase to anaphase onset, densely packed microtubules make up the fully formed half spindles and the small but distinct amphiasters. Their birefringence reaches peak values at this stage. e: The two half-spindles lead the chromosomes pole-wards in mid-anaphase. The chromosomes are non-birefringent. f: In telophase, the half spindles and astral rays are made up of longer but less densely packed microtubules, thus exhibiting weaker birefringence. g: Early cleavage. h: Late cleavage stage. The strong birefringence of the fertilization envelope, with a slow axis parallel to its tangent, is visible in all of the panels. Scale bar, 20 μm. Micrographs reprinted with permission from Salmon and Wolniak (1990).
Figure 4.

Sand dollar embryonic fourth division. Fourth division in the embryo of the sand dollar Echinarachnius parma. Left: The spindles have migrated to, and converged at, the vegetal pole of this eight-cell stage embryo (the four animal-pole cells are out of focus). Right: Cleavage bisecting the telophase spindle has given rise to four macromeres and four micromeres. These latter four cells form the skeletal spicules and germ cells. Scale bar, 50 μm. Reprinted with permission from Inoue (1981).
There are many more examples of the impact that traditional polarized microscopy had on observing biological events, which were mostly published before fluorescence microscopy took hold. In 1937, Schmidt published a book on his comprehensive survey and detailed observations of birefringence in cells and other biological materials (Schmidt, 1937). Another followed by Bennett (1950). Finally, Taylor (1976) published a retrospective and in-depth analysis of the orientation of cross bridges using polarized light for observing striated muscle, the poster child of birefringent tissue that has been studied by polarized light microscopy for more than a century.
LC-PolScope
Over the years, several methods have been proposed to automate the measurement process and to more fully exploit the analytic power of the polarizing microscope. These schemes invariably involve the traditional compensator, which is either moved under computer control (Glazer et al., 1996) or replaced by electro-optical modulators, such as Pockel-cells (Allen et al., 1963), Faraday rotators (Kuhn et al., 2001), and liquid crystal variable retarders (Oldenbourg and Mei, 1995; Shribak, 2011). These schemes also involve quantitative intensity measurements using electronic light detectors, such as photomultipliers or charge-coupled device (CCD) cameras. For quantitative measurements, acquisition and processing algorithms relate measured image intensities and compensator settings to optical characteristics of the specimen (see Shribak and Oldenbourg, 2003).
Here, we discuss the LC-PolScope (Fig. 5), a birefringence imaging system that was developed at the Marine Biological Laboratory in Woods Hole, Massachusetts, and is commercially available from Cambridge Research and Instrumentation, Inc., Hopkinton MA, now part of PerkinElmer, Waltham MA. The commercial LC-PolScope is available as an accessory to microscope bases made by major microscope manufacturers. LC-PolScope components usually include the universal compensator, circular polarizer, a camera with control electronics, and a computer with software for image acquisition and processing. Slightly differing versions are available, optimized for specific research areas, including the life sciences (Abrio LS) and for in vitro fertilization and related laboratory techniques (Oosight).
Figure 5.

LC-PolScope. The optical design of the LC-PolScope (left) builds on the traditional polarized light microscope, with the conventional compensator replaced by two variable retarders LC-A and LC-B. The polarization analyzer passes circularly polarized light and is typically built from a linear polarizer and a quarter-wave plate. Images of the specimen (top row, aster isolated from surf clam egg, 15 μm diameter) are captured at five pre-determined retarder settings, which cause the specimen to be illuminated with circularly polarized light (first, left most image) and with elliptically polarized light of different axis orientations (second to fifth image). Based on the raw PolScope images, the computer calculates the retardance image and the slow-axis orientation or azimuth image using specific algorithms (Shribak and Oldenbourg, 2003). The false-color image on the right was created by combining the retardance and slow-axis orientation data, with the orientation encoded as hue and the retardance as brightness. Reprinted with permission from Oldenbourg (2013).
The optical design of the LC-PolScope builds on the traditional polarized light microscope, introducing two essential modifications: the specimen is illuminated with nearly circularly polarized light while the traditional compensator is replaced by a liquid crystal-based universal compensator. The LC-PolScope also requires the use of narrow bandwidth (−40 nm) or monochromatic light. The schematic of the optical train in Figure 5 shows the universal compensator located between the light source (typically an arc lamp followed by an interference filter) and the condenser lens. The analyzer for circularly polarized light is placed after the objective lens.
Unlike the traditional polarizing microscope, the LC-PolScope measures the magnitude and orientation of specimen birefringence without mechanical movement of the specimen or part of the instrument. The circular analyzer and the universal compensator that sandwich the specimen impart this desirable feature, while measurements can be deconvolved using the image acquisition and processing algorithms implemented in the LC-PolScope software.
The universal compensator is built from two variable retarder plates and a linear polarizer. The variable retarder plates are implemented as electro-optical devices made from two liquid crystal plates. Each liquid crystal plate is mechanically fixed and has a uniform retardance that depends on the voltage applied to the device. The slow axis of each device is oriented at 45° to each other (see Fig. 5). This arranged-pair of liquid crystal devices makes it possible to use the universal compensator as a polarizer to generate any polarization, including circular and linear, of any orientation by simply changing the voltages to the two devices. An electronic control box connected to a computer supplies the voltages. The computer is also connected to the electronic camera, typically a CCD camera, to record the specimen images from the microscope optics. Specialized software synchronizes the image acquisition process with the liquid-crystal settings and implements image-processing algorithms. These algorithms compute images that represent the retardance and slow-axis orientation at each resolved image point. (For a more in-depth discussion of the LC-PolScope technology, we refer the reader Oldenbourg and Mei, 1995; Shribak and Oldenbourg, 2003; Oldenbourg, 2005, and to the nascent web domain OpenPolScope.org, which includes instructions on how to assemble the PolScope-specific components on a microscope and to acquire, process, and analyze polarized light images using open-source software.)
The clarity, resolution, and analytic potential of LC-PolScope images are ideal for examining the birefringent fine structure in living cells. This usage is exemplified in the retardance image of the crane fly spermatocyte shown in Figure 6. The photogenic nature of these cell preparations has lead to an instructive series of cell-division movies, often used for educational purposes and available in the Cell Image Library (http://www.cellimagelibrary.org/) created and maintained by the American Society for Cell Biology. Combined with laser microsurgery and fluorescent speckle microscopy, time-lapse series of LC-PolScope images of crane fly spermatocytes have also led to important insights into mechanisms that contribute to the alignment of chromosomes at the metaphase plate (LaFountain et al., 2001; LaFountain and Oldenbourg, 2004) and to the modulation of kinetochore tension during meta- and anaphase (LaFountain et al., 2011, 2012). Yet, even though the birefringence of the spindle has long been studied using the traditional polarizing microscope and was instrumental in establishing the dynamic nature of its microtubule filaments (see above), the origin of birefringence of other cellular structures, like those highlighted in Regions 1 and 3 of Figure 6, is less well understood. In reproductive medicine and research, the LC-PolScope, and its commercial implementation under the trademark Oosight, has made important contributions by providing non-invasive means of identifying the meiotic spindle in mammalian oocytes (Fig. 7) for in vitro fertilization procedures (Keefe et al., 2003) and for enucleation in cloning procedures (Byrne et al., 2007).
Figure 6.

Crane fly spermatocyte. LC-PolScope images of a primary spermatocyte from the crane fly, Nephrotoma suturalis, in late metaphase. At the top left, the retardance image of the whole cell is dominated by the meiotic spindle extending between two poles and with chromosomes aligned at the metaphase plate. Regions 1, 2, and 3 are enlarged, with red lines indicating the slow-axis direction for each pixel. The underlying retardance images were enlarged using bilinear interpolation. Region 1 shows a cross section through the cell membrane in which the slow axis is oriented perpendicular to the plane of the membrane. Region 2 identifies a kinetochore with centromere and attached kinetochore fiber, with slow axes parallel to the microtubule bundles. Region 3 shows a lipid droplet with a highly birefringent shell on the right and slow axes perpendicular to the droplet’s surface. The left side of Region 3 shows parts of mitochondria that surround the meiotic spindle like a mantle of birefringent tubes, with a slow axis parallel to the tube axis. The cell was prepared and the image recorded by James R. LaFountain, University at Buffalo.
Figure 7.
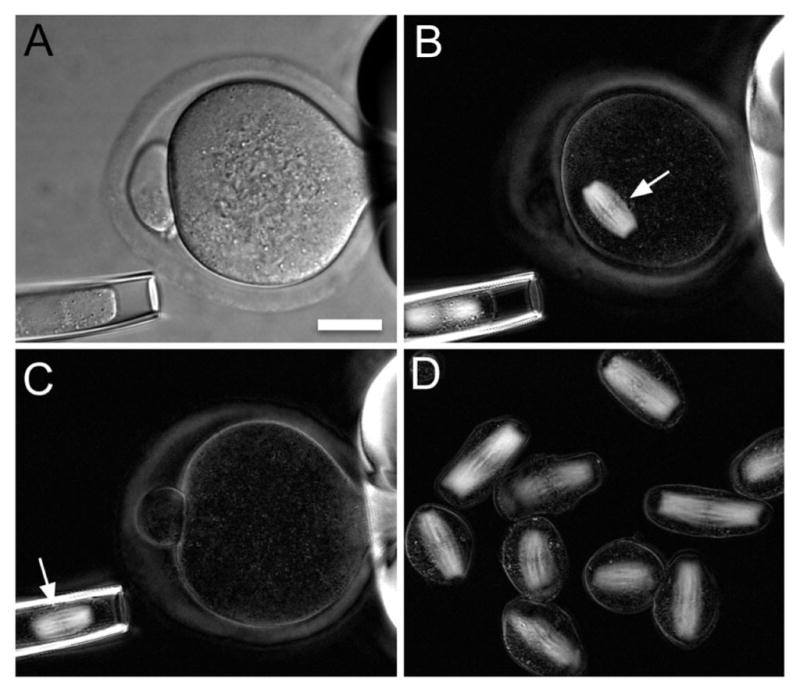
Enucleation of mouse oocytes. A: A mouse oocyte held in place by gentle suction of a holding pipette (scale bar, 20 μm; differential interference contrast microscopy). B: Retardance image of the same oocyte, showing the birefringent spindle of meiosis II (white arrow). C: The spindle (arrow) is aspirated into an enucleation pipette. D: A batch of enucleated spindles and chromosomal karyoplasts. Chromosomes are aligned in the middle of spindles. The figure is courtesy of Dr. Lin Liu (Liu et al., 2000).
In addition to birefringence imaging of the endogenous optical properties of biological molecules and structures, the LC-PolScope can be used to rapidly and comprehensively record the polarized fluorescence of either native or selectively labeled structures. The Fluorescence LC-PolScope can monitor the quasi-static patterns of anisotropy due to the binding of fluorophores to a molecular scaffold that remains static over a time scale of seconds, but might dynamically remodel over minutes or longer (DeMay et al., 2011b). For optimizing the efficiency of this procedure, we have used a wide-field microscope and polarized excitation, recording all emitted fluorescence without a polarization filter in the imaging path. Complete polarization analysis is accomplished using the universal compensator as polarizer to switch the excitation light between four linear polarization states, each rotated by 45°. Figure 8 illustrates the measurement scheme using images of the polarized fluorescence of crystals formed by wild-type green fluorescent protein (GFP). Image arithmetic operations generate maps of anisotropy at a spatial resolution commensurate with the microscope optics used; a map of the fluorescence anisotropy is typically generated in a second or less, depending on the camera exposure time. An example of a native structure that exhibits autofluorescence is the acrosomal matrix of an insect sperm. Figure 9 shows the intrinsic fluorescence of the acrosome of a mature sperm of the water strider, Aquarius remigis. Miyata et al. followed the formation of the acrosome by imaging the fluorescence of its matrix material by recording its fluorescence polarization, and revealed increasing order in the matrix as the acrosome forms (Miyata et al., 2011). An example of fluorescence from a cytoskeletal protein that is genetically linked to GFP is shown in Figure 10. In addition to the molecular specificity of fluorescence labeling, fluorescence polarization adds structural specificity by reporting the preferred orientation of the fluorophores. For example, after carefully optimizing the linker sequence between septin-GFP constructs, the remarkable molecular choreography of septin assemblies involved in cell division was first discovered in the yeast bud neck (Vrabioiu and Mitchison, 2006) and then revealed in other cell types (DeMay et al., 2011a).
Figure 8.

Fluorescence LC-PolScope. a: Diagram of trans-illumination excitation (blue) and fluorescence emission (green) light path. The universal polarizer (linear polarizer, LC-A, and LC-B) is used to rotate the linear polarization to azimuth angles 0°, 45°, 90°, and 135°. b: Graph of fluorescence intensity measured in an image point of a GFP crystal versus the angle of linear polarization of the excitation light. Solid green circles represent measured values, the green line is the best-fit line. c: GFP crystal fluorescence I0, I45, I90, and I135 recorded using excitation light of four polarization angles. Bottom row are ratio and azimuth images computed using image arithmetic. In the right image, the average fluorescence is overlaid with blue lines indicating the azimuth orientation. The ratio and azimuth values in pixels with near-zero average fluorescence (background) are strongly affected by shot noise, and are therefore not reliable and blackened using a mask that was generated based on the average image. Reprinted with permission from DeMay et al. (2011b).
Figure 9.

Water strider acrosome. Images of the sperm acrosome of the water strider Aquarius remigis. A: Differential interference image of a section of the acrosome, which in its entirety can be more than 2 mm long. Scale bar, 5 μm. B: Fluorescence image of the same acrosome section, revealing its intrinsic fluorescence using 470/40 nm excitation, 530/40 emission filters. C: Polarization of the endogenous fluorescence from the boxed region in (B). The orientations of the red lines indicate the prevailing polarization of the fluorescence recorded at every second pixel location of the original image. The underlying grayscale image represents the intensity ratio between maximum and minimum fluorescence (black for ratio = 1, white for ratio = 4) measured at each location. Reprinted with permission from Miyata et al. (2011).
Figure 10.

Septin in Madin-Darby canine kidney cells. Fluorescence image of a living MDCK cell expressing septin molecules linked to GFP. The image was recorded with the Fluorescence LC-PolScope, which reveals the polarized fluorescence of septin fibers in false color. The hue in the image reports the prevailing orientation of the GFP dipoles, which in turn reflects the fiber orientation, as septin-GFP molecules are locked into the fiber assembly. Isotropic fluorescence is shown in white, such as the fluorescence of septin-GFP molecules suspended in the cytosol. The figure legend near the bottom right relates the hue to the polarization orientation indicated by black lines spaced at 45° intervals. This image was recorded by Bradley S. DeMay, Dartmouth College, Hanover NH.
BIREFRINGENCE OF THE DEVELOPING CHICK BRAIN
Polarized light microscopy is a powerful tool for monitoring the ordered biological architecture of tissues and higher organizations in a low-invasive and label-free imaging mode. Historically, polarized light imaging has been applied to analyze the ordered structures of hard tissues with strong birefringence, such as bones, extracellular matrices, and myelinated nerves (Prickett and Stevens, 1939; Wolman, 1975; Bromage et al., 2003). Despite its low-invasiveness, there are very few applications of polarized light microscopy that monitor molecular and cellular architecture at tissue levels. Here we show an example of applying the LC-PolScope for investigating three-dimensional birefringent architecture in live, unlabeled brain slices.
We investigated the cerebellum from the developing chicken embryo using stages from embryonic days E12–E20. The cerebellum of avians and mammals is made of repetitive folds of lobes with grooves that run perpendicular to the sagittal plane, as shown in Figure 11A,B. The organization of the cerebellum at the cellular level is well understood (Hatten and Heintz, 1995; Sillitoe and Joyner, 2007). Major cell types are contained in three layers of the cerebellum (Fig. 11C): The innermost layer is called the granular layer (GL), which is dominated by small granule cells, but also includes other cell types like mossy fiber terminals and Golgi cells. The outermost layer is the molecular layer (ML), which contains granule cell axons (parallel fibers), climbing fiber terminals, Purkinje cell dendrites, and interneurons such as stellate cells, and basket cells. Between these two layers is a monolayer of Purkinje cell bodies that make up the Purkinje cell layer (PCL). The two most distinctive neuronal cells in the cerebellar circuit are Purkinje cells (magenta in Fig. 11C) and granule cells (blue in Fig. 11C). The cerebellar granule cells are the largest single-cell population in the whole brain. The axons of granule cells branch in the molecular layer to form a T-shape, and these axons extend in the molecular layer for a long distance, synapsing on the Purkinje cell dendrites.
Figure 11.

Birefringence of developing chick brain slices. Anatomical structure of embryonic chick cerebellum and LC-PolScope images of brain slices from developing cerebellar cortex. A: Schematic drawing of whole brain (top view). Cerebellum is shown in gray. B: A schematic drawing of cerebellar section cut along sagittal plane. The cerebellar cortex is comprised of three layers: the Molecular Layer (ML), Purkinje Cell Layer (PCL), and Granular Layer (GL). C: Schematic illustration showing the general organization of the cerebellar cortex. Tissue section shown as a dotted square in (B) was cut in both the sagittal and transverse plane, and illustrated to show the organized structure of cerebellar cortex. We used three different planes to observe the structure of the tissue: the sagittal plane, transverse plane, and cross-lobe plane. D,E: Developmental changes of birefringent structures and their increase in retardance in chick cerebellar sagittal slices, observed with an LC-PolScope. Images of a single lobe from 250-μm thick brain slices at developmental stages E12 (D), E15 (E), and E20 (F) of the chick cerebellum. Broken lines indicate the Purkinje Cell Layer. Scale bars, 100 μm.
Polarized Light Microscopy of Unstained, Living Cerebellar Slices
We prepared sagittal slices of cerebella from chick embryos using the method developed for electrophysiological studies (Iino et al., 2001; Hashimoto and Kano, 2003; Koike-Tani et al., 2005). The fresh, acute brain slices (250-μm thick) were obtained from chick embryos at developmental stages E12, E15, and E20. Brain slices were imaged on an inverted microscope stand (Nikon Ti-E) equipped with a 20–/0.5 NA objective lens and condenser with matching numerical aperture (NA), LED illuminator with 546/30 nm interference filter, Hamamatsu Flash 4.0 camera, and LC-PolScope components and software (as described earlier and available on OpenPolScope.org).
In the outer region of the molecular layer in sagittal brain slices of the E12 chick cerebellum, we found filamentous structures with relatively weak birefringence (averaged retardance value, 2.6 nm). The cellular filaments aligned perpendicular to the surface plane of the cerebellum (Fig. 11D). The birefringence of the sagittal cerebellar slice around the molecular layer became stronger as the brain developed. At stage E15, the averaged retardance of the outer molecular layer had increased to 5.6 nm (Fig. 11E). In the later period of cerebellar development (E20) before hatching, the birefringence signal at the molecular layer decreased somewhat (averaged retardance value 2 nm), whereas strong birefringence appeared in the middle of the lobe as a continuous tract from the white matter in the midst of cerebellum.
We also analyzed the optical or slow axis of the birefringent structures in the developing cerebellum. In sagittal sections we observed developmental changes in birefringence in the molecular layer and in the white matter tract (Figs. 11D–F and 12A,B). Figure 12a–d shows the slow-axis orientations and the retardance values measured in two different areas of sagittally sectioned cerebellar slices from developmental stages E15 and E20 (enclosed by white broken rectangles in Fig. 12A,B). The orientation of the bars indicates the slow-axis orientations, and the length of the bars is proportional to the retardance. In the white matter tract of a sagittally sectioned lobe from an E20 brain, we observed bright birefringent, filamentous structures that run parallel to the axis of the tract and extended their branches toward the Purkinje cell layer passing through the granular layer (Fig. 12B). These filamentous structures possess slow axes, which are oriented perpendicular to their filament axes, as shown by the red bars in Figure 12c. The filamentous structures were not observed in sagittal slices of earlier stages of the developing cerebellum (E15), as shown in Figure 12A,a. As the middle of the cerebellar lobe is known to be occupied by myelinated axons from Purkinje cells, mossy fibers, and climbing fibers (Collin et al., 2007), the observed birefringence is expected to originate from myelin sheaths wrapped around axons. We observed strong birefringence in the molecular layer only in early- to mid-stages (E12–E15) of the sagittally sectioned cerebellum (Fig. 12A). The slow axis of these birefringent structures is parallel to the cortical surface, which is orthogonal to the extended cellular structures observed in the polarized light images (Fig. 12b). During these developmental stages, granule cells migrate from the outer layer of the cortex to the inner layer (Karam et al., 2000). A horizontally oriented granule cell extends a large process, at a right angle to the cell, that tracks tangentially along the cortical surface. As this process descends deeper into the cerebellum, the cell body and the nucleus follow whereas the tangentially extended axons remain. The cell bodies eventually migrate past the Purkinje cell layer and stop moving at the internal granule cell layer (Hatten and Heintz, 1995). The transient birefringence that we observed at the molecular layer of the E12–E15 chick embryonic cerebellum can be cellular structures or extracellular matrix bundles, whose orientation might be related to the migration of the granule cells at these developmental stages.
Figure 12.

Birefringent structures in different regions and developmental stages of the cerebellum. A: A PolScope image of sagittal section in the middle stage of development (E15). Regions of white matter tract (a) and the molecular layer (b) are enlarged to show the details of birefringent structure (a,b, left) and the optical slowaxis of birefringence (a,b, right). B: A PolScope image of sagittal brain section in the late stage of development (E20). Regions of white matter tract (c) and the molecular layer (d) are enlarged. C: A PolScope image of a cross-lobe section of a cerebellar lobe at late stage of development (E20). Regions of the molecular layer (e), the granular layer (f) and white matter tract (g) were selected for eDetailed analysis. Tubular structures extended toward Purkinje cell layer (f, top). Structure indicated by an arrow is enlarged to indicate the slow axis (f, bottom). Round-shaped structures that appear in the white matter tract (g, top). Single, round-shaped structure indicated by an arrow is enlarged to indicate the slow axis (g, bottom). Scale bars, 100 μm (A, B, C), 10 μm (a, b, c, d, e, f, g).
The detection of the birefringent architecture in the cerebellum is dependent on the plane of sectioning. In the late developmental stage, there are thick bundles of parallel fibers in the molecular layer. The fibers run perpendicular to the dendritic arbor plane of Purkinje cells (Fig. 11C). In sagittal sections of the chick cerebellum at this stage, we were not able to detect any remarkable birefringence in or near the molecular layer (Fig. 12B,d). When we chose the cross-lobe plane instead of the sagittal plane for sectioning (Fig. 11C), however, we observed bright objects with strong birefringence (Fig. 12C,e). Since the location of these birefringent filaments was in the area of the molecular layer, we suspect they are parallel fibers. The slow axis of the filamentous structures was perpendicular to the length of the filaments (Fig. 12e). In cross-lobe-sectioned slices of the cerebellum at a late developmental stage, we observed many round-shaped structures in cross sections of the white matter tract, where myelinated axons ran perpendicular to the sliced plane (Fig. 12g). There were also many birefringent, tubular structures that branched out from the central white matter tract and extended toward the Purkinje cell layer (Fig. 12f). The diameter of these round or tubular-shaped objects is around 5–10 μm, which is consistent with the diameter of myelin sheaths observed in the cerebellar white matter tract (Feirabend and Voogd, 1986). The slow axis of birefringence observed in these structures was oriented perpendicular to the length of the tubules and radially aligned to the circumference of the round-shaped objects (Fig. 12f,g). These results are consistent with our observation of birefringence and slow-axis orientation in white matter tracts in sagittal sections (Fig. 12c). The birefringence in the molecular layer during late development (Fig. 12e) might be caused by densely packed, non-myelinated parallel fibers. In contrast to the myelinated axons in the white matter tract of cross-lobe slice sections, we failed to detect birefringence in molecular layers of sagittally sliced sections (Fig. 12d). The diameter of non-myelinated parallel fiber axons is as small as 0.2 μm (Morara et al., 2001), which might account for the failure to detect birefringence, as the diameter of cross-sectioned parallel fiber axons is below the resolution limit of the objective lens used. The small diameter of the fibers, in conjunction with the birefringence of the nerve membrane and its axoplasm possibly canceling each other out, might lead to the low level of birefringence in the molecular layer of sagitally sliced sections.
LC-PolScope Imaging of the Unsliced Cerebellar Lobe
We also imaged unsliced lobes of the cerebellum isolated from chick embryo, thus allowing us to use the LC-PolScope to analyze molecular organization of biological tissues in vivo. The isolated single lobes of cerebellum from E18 chick embryo were imaged with the LC-PolScope, and serial optical sections were recorded from the cortical surface to the white matter tract (Fig. 13). As in the polarized light images of cross-lobe sliced preparations, we observed two groups of thick bundles of birefringent filaments in the transverse plane of the lobe (Fig. 11C). The first group of birefringent fiber bundles ran parallel to the cross-lobe plane, appeared −20 μm in depth from the cortical surface (Fig. 13, −24 μm), and disappeared when the focus plane reached around 70 μm from the surface (Fig. 13, −72 μm). The second group of birefringent fiber bundles appeared as the first fibers blurred, and became clearly visible when the focus plane was about 100 μm from the surface (Fig. 13, −96 μm). The fiber axes of the second bundles were perpendicular to the fiber axes of the first bundles. The three-dimensional arrangement of the first fiber bundles closely resembled that of parallel fibers, and the second birefringent bundles might correspond to myelinated axons from Purkinje cells and other myelinated axons along the white matter tract. Thus, we were able to analyze the three-dimensional arrangement of birefringent structures inside living tissue without physical sectioning.
Figure 13.

LC-PolScope optical sections of an E18 cerebellar lobe. Schematic drawing of cerebellar lobe illustrating the orientation of the x, y, and z axes. Parallel fibers are shown in broken lines around the edge. Myelinated axons are shown in circles at the center of the lobe. The PolScope imaging was started from the surface of the cerebellar lobe (z =0). Scale bar, 100 μm.
Our observations of non-stained brain slices and whole cerebellar lobes reveal the LC-PolScope as a potential tool for imaging nerve fibers, both with and without myelination, in live tissues. Using water-immersion, long working-distance objective lenses and appropriate illumination, we could use the LC-PolScope for monitoring the wiring process of neurons in whole developing embryos or regenerating tissues without the need for selective labeling of neurons. This approach should be especially useful for live specimens in which the histochemical or genetic incorporation of fluorescent labels to neurons is difficult.
CONCLUSION
Polarized light microscopy allows one to non-destructively follow the dynamic organization of living cells and tissues at the microscopic as well as sub-microscopic levels. Imaging with polarized light reveals information about the organization of the endogenous molecules that built the complex and highly dynamic architecture of cells and tissues. While polarized light microscopy is not sensitive to the chemical nature of the constituent molecules, it responds to the structural, anisotropic nature of macromolecular assemblies, such as the submicroscopic alignment of molecular bonds and filaments. Polarization analysis can also be applied to fluorescence imaging, combining the molecular specificity of fluorescence labeling with the structural specificity of polarization, as has been demonstrated even at the level of single fluorophores, tracking the orientation of single molecules to reveal the time-dependent association/dissociation of interacting molecules that underlie the signal transduction cascades within living cells (Tani et al., 2005).
This review gives a short survey of traditional and modern approaches to polarized light microscopy and its use in reproductive and developmental biology. Current instrumentation and analysis methods are only scratching the surface of the potential of polarized light microscopy to rapidly capture, compute, and display ongoing fine structural and molecular changes in living cells, tissues, and whole organisms.
FURTHER READING
For a more in-depth discussion of the technique of polarized light microscopy and its application in living cells and organisms, we refer to the many lucid articles published by Inoué and coworkers, including the recent publication of Inoué’s collected works (Inoué, 1986, 2003, 2008; Inoue and Oldenbourg, 1998; Inoue, 2002). For a practical guide on using the LC-PolScope and technical aspects of polarized light microscopy, we refer to the following publications: Oldenbourg, 1999, 2005, 2007; Shribak and Oldenbourg, 2003; Oldenbourg and Shribak, 2010. Parts of this review article are from our previous review published in Biomedical Optical Phase Microscopy and Nanoscopy (Oldenbourg, 2013), which contains a glossary of polarization optical terms, such as birefringence, retardance, and slow-axis orientation.
Acknowledgments
Grant sponsor: National Institute of General Medical Sciences; Grant number: 1R01GM100160; Grant sponsor: National Institute of Biomedical Imaging and Bioengineering; Grant number: R01EB002045
We gratefully acknowledge many years of illuminating discussions on polarized light microscopy with Shinya Inoué of the MBL. This work was supported by funds from the National Institute of General Medical Sciences (grant 1R01GM100160-01A1 awarded to T.T.) and the National Institute of Biomedical Imaging and Bioengineering (grant EB002045 awarded to R.O.).
Abbreviations
- CCD
charge-coupled device
- GFP
green fluorescent protein
References
- Allen RD, Brault J, Moore RD. A new method of polarization microscopic analysis I. Scanning with a birefringence detection system. J Cell Biol. 1963;18:223–235. doi: 10.1083/jcb.18.2.223. [DOI] [PMC free article] [PubMed] [Google Scholar]
- Bennett HS. The microscopical investigation of biological materials with polarized light. In: Jones RM, editor. McClung’s handbook of microscopical techniques for workers in animal and plant tissues. 3. New York, NY: Paul B. Hoeber, Inc., Medical Book Department of Harper & Brothers; 1950. pp. 591–677. [Google Scholar]
- Bromage TG, Goldman HM, McFarlin SC, Warshaw J, Boyde A, Riggs CM. Circularly polarized light standards for investigations of collagen fiber orientation in bone. Anat Rec B New Anat. 2003;274:157–168. doi: 10.1002/ar.b.10031. [DOI] [PubMed] [Google Scholar]
- Byrne JA, Pedersen DA, Clepper LL, Nelson M, Sanger WG, Gokhale S, Wolf DP, Mitalipov SM. Producing primate embryonic stem cells by somatic cell nuclear transfer. Nature. 2007;450:497–502. doi: 10.1038/nature06357. [DOI] [PubMed] [Google Scholar]
- Chandler DE, Heuser J. The vitelline layer of the sea urchin egg and its modification during fertilization. A freeze-fracture study using quick-freezing and deep-etching. J Cell Biol. 1980;84:618–632. doi: 10.1083/jcb.84.3.618. [DOI] [PMC free article] [PubMed] [Google Scholar]
- Collin L, Doretto S, Malerba M, Ruat M, Borrelli E. Oligodendrocyte ablation affects the coordinated interaction between granule and Purkinje neurons during cerebellum development. Exp Cell Res. 2007;313:2946–2957. doi: 10.1016/j.yexcr.2007.05.003. [DOI] [PubMed] [Google Scholar]
- DeMay BS, Bai X, Howard L, Occhipinti P, Meseroll RA, Spiliotis ET, Oldenbourg R, Gladfelter AS. Septin filaments exhibit a dynamic, paired organization that is conserved from yeast to mammals. J Cell Biol. 2011a;193:1065–1081. doi: 10.1083/jcb.201012143. [DOI] [PMC free article] [PubMed] [Google Scholar]
- DeMay BS, Noda N, Gladfelter AS, Oldenbourg R. Rapid and quantitative imaging of excitation polarized fluorescence reveals ordered septin dynamics in live yeast. Biophys J. 2011b;101:985–994. doi: 10.1016/j.bpj.2011.07.008. [DOI] [PMC free article] [PubMed] [Google Scholar]
- Feirabend HK, Voogd J. Myeloarchitecture of the cerebellum of the chicken (Gallus domesticus): An atlas of the compartmental subdivision of the cerebellar white matter. J Comp Neurol. 1986;251:44–66. doi: 10.1002/cne.902510104. [DOI] [PubMed] [Google Scholar]
- Glazer AM, Lewis JG, Kaminsky W. An automatic optical imaging system for birefringent media. Proc R Soc London. 1996;A452:2751–2765. [Google Scholar]
- Hashimoto K, Kano M. Functional differentiation of multiple climbing fiber inputs during synapse elimination in the developing cerebellum. Neuron. 2003;38:785–796. doi: 10.1016/s0896-6273(03)00298-8. [DOI] [PubMed] [Google Scholar]
- Hatten ME, Heintz N. Mechanisms of neural patterning and specification in the developing cerebellum. Annu Rev Neurosci. 1995;18:385–408. doi: 10.1146/annurev.ne.18.030195.002125. [DOI] [PubMed] [Google Scholar]
- Iino M, Goto K, Kakegawa W, Okado H, Sudo M, Ishiuchi S, Miwa A, Takayasu Y, Saito I, Tsuzuki K, Ozawa S. Glia-synapse interaction through Ca2+-permeable AMPA receptors in Bergmann glia. Science. 2001;292:926–929. doi: 10.1126/science.1058827. [DOI] [PubMed] [Google Scholar]
- Inoue S. Cell division and the mitotic spindle. J Cell Biol. 1981;91:131s–147s. doi: 10.1083/jcb.91.3.131s. [DOI] [PMC free article] [PubMed] [Google Scholar]
- Inoue S. Polarization microscopy. Curr Protoc Cell Biol. 2002;Chapter 4(Unit 4):9. doi: 10.1002/0471143030.cb0409s13. [DOI] [PubMed] [Google Scholar]
- Inoué S. Polarization optical studies of the mitotic spindle. I. The demonstration of spindle fibers in living cells. Chromosoma. 1953;5:487–500. doi: 10.1007/BF01271498. [DOI] [PubMed] [Google Scholar]
- Inoué S. Video microscopy. New York: Plenum Press; 1986. [Google Scholar]
- Inoué S. Exploring living cells and molecular dynamics with polarized light microscopy. In: Török P, Kao FJ, editors. Optical imaging and microscopy. 2. Berlin, Heidelberg, New York: Springer-Verlag; 2003. pp. 3–20. [Google Scholar]
- Inoué S. Collected Works of Shinya Inoué: Microscopes, living cells, and dynamic molecules. Singapore: World Scientific; 2008. [Google Scholar]
- Inoué S, Hyde WL. Studies on depolarization of light at microscope lens surfaces II. The simultaneous realization of high resolution and high sensitivity with the polarizing microscope. J Biophys Biochem Cytol. 1957;3:831–838. doi: 10.1083/jcb.3.6.831. [DOI] [PMC free article] [PubMed] [Google Scholar]
- Inoué S, Kiehart DP. In vivo analysis of mitotic spindle dynamics. In: Dirksen ER, Prescott DM, Fox CF, editors. Cell reproduction: In honor of Daniel Mazia. New York, NY: Academic Press; 1978. pp. 433–444. [Google Scholar]
- Inoue S, Oldenbourg R. Microtubule dynamics in mitotic spindle displayed by polarized light microscopy. Mol Biol Cell. 1998;9:1603–1607. doi: 10.1091/mbc.9.7.1603. [DOI] [PMC free article] [PubMed] [Google Scholar]
- Inoue S, Salmon ED. Force generation by microtubule assembly/disassembly in mitosis and related movements. Mol Biol Cell. 1995;6:1619–1640. doi: 10.1091/mbc.6.12.1619. [DOI] [PMC free article] [PubMed] [Google Scholar]
- Inoué S, Sato H. Deoxyribonucleic acid arrangement in living sperm. In: Hayashi T, Szent-Gyorgyi AG, editors. Molecular architecture in cell physiology. Englewood Cliffs, NJ: Prentice Hall; 1966. pp. 209–248. [Google Scholar]
- Karam SD, Burrows RC, Logan C, Koblar S, Pasquale EB, Bothwell M. Eph receptors and ephrins in the developing chick cerebellum: Relationship to sagittal patterning and granule cell migration. J Neurosci. 2000;20:6488–6500. doi: 10.1523/JNEUROSCI.20-17-06488.2000. [DOI] [PMC free article] [PubMed] [Google Scholar]
- Keefe D, Liu L, Wang W, Silva C. Imaging meiotic spindles by polarization light microscopy: Principles and applications to IVF. Reprod Biomed Online. 2003;7:24–29. doi: 10.1016/s1472-6483(10)61724-5. [DOI] [PubMed] [Google Scholar]
- Koike-Tani M, Saitoh N, Takahashi T. Mechanisms underlying developmental speeding in AMPA-EPSC decay time at the calyx of Held. J Neurosci. 2005;25:199–207. doi: 10.1523/JNEUROSCI.3861-04.2005. [DOI] [PMC free article] [PubMed] [Google Scholar]
- Kuhn JR, Wu Z, Poenie M. Modulated polarization microscopy: A promising new approach to visualizing cytoskeletal dynamics in living cells. Biophys J. 2001;80:972–985. doi: 10.1016/S0006-3495(01)76076-6. [DOI] [PMC free article] [PubMed] [Google Scholar]
- LaFountain JR, Jr, Oldenbourg R. Maloriented bivalents have metaphase positions at the spindle equator with more kinetochore microtubules to one pole than to the other. Mol Biol Cell. 2004;15:5346–5355. doi: 10.1091/mbc.E04-06-0524. [DOI] [PMC free article] [PubMed] [Google Scholar]
- LaFountain JR, Jr, Oldenbourg R, Cole RW, Rieder CL. Microtubule flux mediates poleward motion of acentric chromosome fragments during meiosis in insect spermatocytes. Mol Biol Cell. 2001;12:4054–4065. doi: 10.1091/mbc.12.12.4054. [DOI] [PMC free article] [PubMed] [Google Scholar]
- LaFountain JR, Jr, Cohan CS, Oldenbourg R. Functional states of kinetochores revealed by laser microsurgery and fluorescent speckle microscopy. Mol Biol Cell. 2011;22:4801–4808. doi: 10.1091/mbc.E11-06-0494. [DOI] [PMC free article] [PubMed] [Google Scholar]
- LaFountain JR, Jr, Cohan CS, Oldenbourg R. Pac-man motility of kinetochores unleashed by laser microsurgery. Mol Biol Cell. 2012;23:3133–3142. doi: 10.1091/mbc.E12-04-0314. [DOI] [PMC free article] [PubMed] [Google Scholar]
- Liu L, Oldenbourg R, Trimarchi JR, Keefe DL. A reliable, noninvasive technique for spindle imaging and enucleation of mammalian oocytes. Nat Biotechnol. 2000;18:223–225. doi: 10.1038/72692. [DOI] [PubMed] [Google Scholar]
- Miyata H, Noda N, Fairbairn DJ, Oldenbourg R, Cardullo RA. Assembly of the fluorescent acrosomal matrix and its fate in fertilization in the water strider, Aquarius remigis. J Cell Physiol. 2011;226:999–1006. doi: 10.1002/jcp.22413. [DOI] [PMC free article] [PubMed] [Google Scholar]
- Morara S, van der Want JJ, de Weerd H, Provini L, Rosina A. Ultrastructural analysis of climbing fiber-Purkinje cell synap to-genesis in the rat cerebellum. Neuroscience. 2001;108:655–671. doi: 10.1016/s0306-4522(01)00433-x. [DOI] [PubMed] [Google Scholar]
- Oldenbourg R. Polarized light microscopy of spindles. Methods Cell Biol. 1999;61:175–208. doi: 10.1016/s0091-679x(08)61981-0. [DOI] [PubMed] [Google Scholar]
- Oldenbourg R. Polarization microscopy with the LC-PolScope. In: Goldman RD, Spector DL, editors. Live cell imaging: A laboratory manual. Cold Spring Harbor, NY: Cold Spring Harbor Laboratory Press; 2005. pp. 205–237. [Google Scholar]
- Oldenbourg R. Analysis of microtubule dynamics by polarized light. Methods Mol Med. 2007;137:111–123. doi: 10.1007/978-1-59745-442-1_8. [DOI] [PMC free article] [PubMed] [Google Scholar]
- Oldenbourg R. Polarization microscopy. In: Shaked NT, Zalevskey Z, Satterwhite L, editors. Biomedical optical phase microscopy and nanoscopy. Amsterdam: Elsevier; 2013. pp. 123–138. [Google Scholar]
- Oldenbourg R, Mei G. New polarized light microscope with precision universal compensator. J Microsci. 1995;180:140–147. doi: 10.1111/j.1365-2818.1995.tb03669.x. [DOI] [PubMed] [Google Scholar]
- Oldenbourg R, Shribak M. Microscopes. In: Bass M, DeCusatis C, Enoch JM, Lakshminarayanan V, Li G, Macdonald C, Mahajan VN, Van Stryland E, editors. Handbookof optics. 3. New York: McGraw-Hill, Inc; 2010. pp. 28.21–28.62. [Google Scholar]
- Palazzo RE, Brawley JB, Rebhun LI. Spontaneous aster formation in cytoplasmic extracts from eggs of the surf clam. Zool Sci. 1988;5:603–611. [Google Scholar]
- Prickett CO, Stevens C. The polarized light method for the study of myelin degeneration as compared with the Marchi and Sudan III methods. Am J Pathol. 1939;15:241–250. 247. [PMC free article] [PubMed] [Google Scholar]
- Salmon ED, Wolniak SM. Role of microtubules in stimulating cytokinesis in animal cells. Ann NY Acad Sci. 1990;582:88–98. doi: 10.1111/j.1749-6632.1990.tb21670.x. [DOI] [PubMed] [Google Scholar]
- Sato H, Ellis GW, Inoue S. Microtubular origin of mitotic spindle form birefringence. Demonstration of the applicability of Wiener’s equation. J Cell Biol. 1975;67:501–517. doi: 10.1083/jcb.67.3.501. [DOI] [PMC free article] [PubMed] [Google Scholar]
- Schmidt WJ. Die doppelbrechung von karyoplasma, zytoplasma und metaplasma. Berlin: Bornträger; 1937. [Google Scholar]
- Shribak M. Complete polarization state generator with one variable retarder and its application for fast and sensitive measuring of two-dimensional birefringence distribution. J Opt Soc Am A Opt Image Sci Vis. 2011;28:410–419. doi: 10.1364/JOSAA.28.000410. [DOI] [PMC free article] [PubMed] [Google Scholar]
- Shribak M, Oldenbourg R. Techniques for fast and sensitive measurements of two-dimensional birefringence distributions. Appl Opt. 2003;42:3009–3017. doi: 10.1364/ao.42.003009. [DOI] [PubMed] [Google Scholar]
- Sillitoe RV, Joyner AL. Morphology, molecular codes, and circuitry produce the three-dimensional complexity of the cerebellum. Annu Rev Cell Dev Biol. 2007;23:549–577. doi: 10.1146/annurev.cellbio.23.090506.123237. [DOI] [PubMed] [Google Scholar]
- Tani T, Miyamoto Y, Fujimori KE, Taguchi T, Yanagida T, Sako Y, Harada Y. Trafficking of a ligand-receptor complex on the growth cones as an essential step for the uptake of nerve growth factor at the distal end of the axon: A single-molecule analysis. J Neurosci. 2005;25:2181–2191. doi: 10.1523/JNEUROSCI.4570-04.2005. [DOI] [PMC free article] [PubMed] [Google Scholar]
- Taylor DL. Quantitative studies on the polarization optical properties of striated muscle. I. Birefringence changes of rabbit psoas muscle in the transition from rigor to relaxed state. J Cell Biol. 1976;68:497–511. doi: 10.1083/jcb.68.3.497. [DOI] [PMC free article] [PubMed] [Google Scholar]
- Vrabioiu AM, Mitchison TJ. Structural insights into yeast septin organization from polarized fluorescence microscopy. Nature. 2006;443:466–469. doi: 10.1038/nature05109. [DOI] [PubMed] [Google Scholar]
- Wolman M. Polarized light microscopy as a tool of diagnostic pathology. J Histochem Cytochem. 1975;23:21–50. doi: 10.1177/23.1.1090645. [DOI] [PubMed] [Google Scholar]