

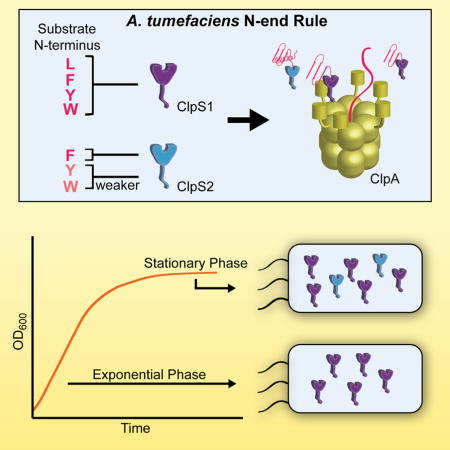
Summary
The N-end rule dictates that a protein’s N-terminal residue determines its half-life. In bacteria, the ClpS adaptor mediates N-end-rule degradation, by recognizing proteins bearing specific N-terminal residues and delivering them to the ClpAP AAA+ protease. Unlike most bacterial clades, many α-proteobacteria encode two ClpS paralogs, ClpS1 and ClpS2. Here, we demonstrate that both ClpS1 and ClpS2 from A. tumefaciens deliver N-end-rule substrates to ClpA, but ClpS2 has more stringent binding specificity, recognizing only a subset of the canonical bacterial N-end-rule residues. The basis of this enhanced specificity is addressed by crystal structures of ClpS2, with and without ligand, and structure-guided mutagenesis, revealing protein conformational changes and remodeling in the substrate-binding pocket. We find that ClpS1 and ClpS2 are differentially expressed during growth in A. tumefaciens and conclude that the use of multiple ClpS paralogs allows fine-tuning of N-end rule degradation at the level of substrate recognition.
Graphical Abstract
Introduction
Proteolysis is critical in all organisms for removing misfolded and/or damaged proteins and regulating central biological processes (Sauer and Baker, 2011). All organisms contain AAA+ proteolytic machines that use the energy of ATP hydrolysis to unfold substrates for degradation (Sauer and Baker, 2011; Sauer et al., 2004). To ensure that only specific proteins are degraded, bacterial substrates are targeted for proteolysis by peptide sequences, called degrons, often located at the N or C-terminus of a target protein. These degrons may be recognized directly by a AAA+ protease or require the assistance of an adaptor protein, such as ClpS (Sauer and Baker, 2011).
The N-end rule describes a proteolytic pathway, present in prokaryotes and eukaryotes, in which the N-terminal amino acid of a protein determines its half-life (Dougan et al., 2011; Varshavsky, 2011). This pathway has been implicated in oxygen homeostasis, cell division, cardiovascular development, apoptosis, putrescine homeostasis, and other processes (Hu et al., 2008; Humbard et al., 2013; Lee et al., 2005; Licausi et al., 2011; Ninnis et al., 2009; Piatkov et al., 2012; Rao et al., 2001; Schmidt et al., 2009; Varshavsky, 2011). In bacteria such as Escherichia coli and Caulobacter crescentus, four hydrophobic N-terminal residues (Phe, Tyr, Trp, Leu) serve as N-end-rule degradation signals (N-degrons). The N-degrons of bacterial substrates are bound directly by ClpS, assembling into a ternary complex with the ClpAP AAA+ protease (Fig. 1A) (Erbse et al., 2006; Rivera-Rivera et al., 2014; Román-Hernández et al., 2011; Tobias et al., 1991). The substrate is then transferred to ClpAP by an active-handoff mechanism involving remodeling of ClpS by ClpA (Rivera-Rivera et al., 2014; Román-Hernández et al., 2011). Interestingly, ClpS also inhibits the degradation of certain ClpAP substrates, such as ssrA-tagged proteins (De Donatis et al., 2010; Dougan et al., 2002; Hou et al., 2008).
Figure 1. ClpS and N-end rule recognition.

(A) The ClpAP protease is composed of the barrel-shaped ClpP peptidase (green) and AAA+ ClpA unfoldase (dark blue). The ClpS adaptor protein (cyan) binds both N-end rule substrates (pink) and the ClpA N-terminal domain, which is flexibly attached to the body of ClpA.
(B) Structure of C. crescentus ClpS bound to N-terminal Tyr (PDB: 3DNJ). The unstructured N-terminal extension, the N-degron binding pocket, and ClpA-interacting residues are indicated.
Zoom box: The α-amino group of Tyr is coordinated by three hydrogen bonds involving His79, Asp49, Asn47 of C. crescentus ClpS and a water molecule (red sphere).
(C) Sequence alignment of ClpS proteins from E. coli, C. crescentus, A. tumefaciens, and S. elongatus. The alignment is colored by conservation from lower conservation (light blue) to higher conservation (dark blue). Binding-pocket residues are indicated by black stars (★). ClpA-interacting residues are indicated by red stars. The alignment was constructed using Clustal Omega (Sievers et al., 2011) and Jalview (Waterhouse et al., 2009)
Much work has been done to determine how ClpS recognizes N-end rule substrates. Crystallographic studies show that the side chain of each N-end-rule residue packs into a hydrophobic pocket in ClpS, and the N-degron α-amino group forms three hydrogen bonds (one coordinated by water) with ClpS (Fig. 1B) (Román-Hernández et al., 2009; Wang et al., 2008b). In eukaryotes, the N-end-rule degradation pathway acts at the level of substrate ubiquitination. Several E3 ubiquitin ligases use a protein domain, homologous to ClpS, to dock substrates with N-terminal Phe, Tyr, Trp, Leu, or Ile residues, before mediating their ubiquitination (Varshavsky, 2011). Moreover, eukaryotes employ multiple E3 ubiquitin ligases, with differing substrate preferences, to regulate N-end rule recognition.
ClpS is conserved throughout proteobacteria and is also found in some more distant genera, including cyanobacteria and actinobacteria, as well as in plant chloroplasts (Lupas and Koretke, 2003). Interestingly, although bacterial species generally encode a single ClpS or ClpS1 protein, most α-proteobacteria also encode a second, more divergent ClpS2 protein (Fig. 1C) (Lupas and Koretke, 2003). The gene encoding ClpS or ClpS1 is almost always adjacent to the gene for ClpA, whereas the gene encoding ClpS2 is present elsewhere in the genome. Similar to α-proteobacteria, cyanobacteria also encode ClpS1 and ClpS2 adaptors, although both are divergent in sequence from the α-proteobacterial ClpS1 and ClpS2 proteins (Fig. 1C). In this paper, we initially perform a high-throughput-binding analysis of the ClpS proteins from Agrobacterium tumefaciens (an α-proteobacterium) and Synechococcus elongatus (a cyanobacterium) and then investigate the binding specificity, delivery capabilities, and expression of A. tumefaciens ClpS1 and ClpS2. We find that A. tumefaciens ClpS2 binds and delivers a more restricted set of N-end-rule substrates than does ClpS1. The structure of ClpS2, with and without bound substrate, suggests how this selective binding is achieved. We also find that ClpS1 and ClpS2 are differentially expressed during growth in A. tumefaciens. Together, our results strongly suggest that A. tumefaciens, and most likely other α-proteobacteria and cyanobacteria, employs multiple ClpS proteins to tune N-end-rule recognition and proteolysis under different growth conditions.
Results
Bacterial ClpS1 and ClpS2 proteins differ in binding specificity
To rapidly assess the N-terminal-binding specificities of ClpS1 and ClpS2 protein-pairs from α-proteobacteria and cyanobacteria, we synthesized carboxy-terminally coupled peptide arrays in which the 20 common amino acids were placed at the N-terminal (P1) and penultimate (P2) residues of the peptide P1-P2-FVQELASKEV. We then probed these arrays with purified 35S-labeled ClpS1 or ClpS2 from A. tumefaciens and S. elongatus and imaged the bound radioactive proteins. As observed previously for E. coli ClpS (Erbse et al., 2006), A. tumefaciens ClpS1 recognized peptides with N-terminal Phe, Tyr, Trp, or Leu residues and did not recognize peptides with N-terminal Ala, Val, or Ile (Fig. 2A). In contrast, A. tumefaciens ClpS2 did not detectably bind peptides with N-terminal Leu and showed reduced binding to peptides with N-terminal Tyr and Trp (Fig. 2B). ClpS1 from the bacterial species S. elongatus did not detectably recognize peptides with N-terminal Leu but bound peptides with N-terminal Phe, Tyr, and Trp (Fig. 2C). S. elongatus ClpS2, by contrast, bound N-end rule Leu, Phe and Tyr, as well as the β-branched amino acids Val and Ile (Fig. 2D). In all cases, we found that Arg or Lys at the P2 position increased binding, whereas Asp or Glu at P2 decreased binding (Fig. 2A, B, C, and D), presumably due to ionic interactions with the negatively charged residues in the ClpS binding pocket. Moreover, all the ClpS proteins seemed to favor small residues, such as Gly and Ser, at the P2 position. The small side chains of these amino acids likely avoid clashes with residues at the rim of the ClpS binding pocket. Thus, within a species, ClpS1 and ClpS2 proteins appear to differ in their P1 binding specificities. Moreover, the observed specificity differences are not conserved between α-proteobacteria and cyanobacteria. These results indicate that ClpS variants in different bacteria have evolved to recognize species-specific N-degron profiles. We chose to characterize the A. tumefaciens ClpS1 and ClpS2 proteins, which were more biochemically tractable, in greater detail.
Figure 2. A. tumefaciens and S. elongatus ClpS1 and ClpS2 differ in binding specificity.

Selected slices of a peptide blot probed with (A) 35S-labeled ClpS1 from A. tumefaciens, (B) 35S-labeled ClpS2 from A. tumefaciens, (C) 35S-labeled ClpS1 from S. elongatus, and (D) 35S-labeled ClpS2 from S. elongatus. Each spot corresponds to a single peptide with the sequence N-P1-P2-FVQELASKEV-C. The P1 residue is indicated by the letters to the left of the blot, whereas the P2 residue is indicated by the letters above the blot.
The ClpS2 adaptor is more selective than ClpS1 in A. tumefaciens
To quantitatively assess A. tumefaciens ClpS binding specificities, we used fluorescence anisotropy to assay binding of ClpS1 and ClpS2 to P1-RFVQELASKEVC-fluorescein peptides with Phe (Fpep), Tyr (Ypep), Trp (Wpep), and Leu (Lpep) at the N-terminal P1 position. ClpS1 bound these peptides with dissociation constants of 3 μM (Fpep), 4 μM (Wpep), 6 μM (Ypep), and 9 μM (Lpep) respectively (Fig. 3A and C). ClpS2 bound Fpep most tightly (KD = 4 μM), bound Ypep (KD = 17 μM) and Wpep (KD = 23 μM) ~5 fold more weakly, and did not detectably bind Lpep (Fig. 3B and C). Assuming a potential detection limit of 10% peptide bound at the highest ClpS2 concentration tested (95 μM), we estimate that the equilibrium dissociation constant for ClpS2-Lpep binding is greater than 800 μM. Thus, ClpS2 binds a more restricted subset of N-degrons than does ClpS1.
Figure 3. A. tumefaciens ClpS2 is a more selective N-end rule adaptor than ClpS1.

(A) A. tumefaciens ClpS1 binding to fluorescently labeled peptides with varying N-termini, as assayed by change in fluorescence anisotropy. Data are representative of 3 independent experiments. Curves are non-linear least squares fits to a hyperbolic binding isotherm, R > 0.95.
(B) A. tumefaciens ClpS2 binding to fluorescently labeled peptides with varying N-termini, as assayed by change in fluorescence anisotropy. See A for experimental details. For Lpep, a linear fit was used.
(C) Summary of measured dissociation constants (KD) for A. tumefaciens ClpS1 and ClpS2 binding to peptides with different N-termini. Each KD represents an average (N = 3) ± the greater of 1 SEM or 10% of average.
ClpS1 and ClpS2 deliver N-end rule substrates to A. tumefaciens ClpA
Primary-sequence analysis suggested that both ClpS1 and ClpS2 should be capable of delivering N-end-rule substrates to ClpA, as each protein contains a set of conserved residues that form the ClpA-binding interface and an N-terminal extension of sufficient length to mediate ClpA engagement and substrate delivery (Fig. 1B and C and Fig. S1A) (Guo et al., 2002; Rivera-Rivera et al., 2014; Román-Hernández et al., 2011; Zeth et al., 2002). To test this prediction directly, we purified A. tumefaciens ClpA and assayed the ability of ClpS1 or ClpS2 to stimulate unfolding of N-degron GFP substrates. These experiments also contained the D87K variant of GroEL (GroELtrap) to bind unfolded GFP and prevent its refolding, thus allowing direct monitoring of unfolding by loss of GFP fluorescence (Weber-Ban et al., 1999). Without ClpS, ClpA did not unfold FLFVQ-GFP (Fig. 4A and B), but addition of ClpS1 stimulated efficient unfolding of FLFVQ-GFP, YLFVQ-GFP, WLFVQ-GFP, and LLFVQ-GFP (Fig. 4A). Likewise, ClpA efficiently unfolded FLFVQ-GFP in the presence, but not absence, of ClpS2 (Fig. 4B). However, ClpS2 promoted slower unfolding of YLFVQ-GFP, even slower unfolding of WLFVQ-GFP, and no detectable unfolding of LLFVQ-GFP. We found that both ClpS1 and ClpS2 also deliver N-degron-GFP substrates to E. coli ClpAP for degradation and displayed similar delivery specificities to those observed in unfolding reactions with A. tumefaciens ClpA (Fig. 4C and D). The delivery specificities of ClpS1 and ClpS2 were largely those expected based on our peptide-binding experiments. Discrepancies could be explained if the N-degron also affects steps subsequent to ClpS1 or ClpS2 binding in the ClpA unfolding reaction or if the differences between the N-terminal sequences of our peptides and GFP substrates affect binding affinity.
Figure 4. ClpS1 and ClpS2 deliver N-end rule substrates to ClpA in vitro.

(A) In vitro unfolding of N-degron GFP (1 μM) by ClpA6 (0.5 μM) and ClpS1 (2 μM) was monitored by loss of GFP fluorescence over time. Excess GroELtrap (10 μM 14mer) was added to reactions to capture unfolded GFP and prevent refolding. Data are averages of 3 technical replicates and are representative of 3 independent experiments.
(B) In vitro unfolding of N-degron GFP (1 μM) by ClpA6 (0.5 μM) and ClpS2 (2 μM). The no ClpS control is the same as in panel A. See A for experimental details.
(C) In vitro degradation of N-degron GFP (1 μM) by E. coli ClpAP (0.4 μM ClpP14, 0.2 μM ClpA6) and A. tumefaciens ClpS1 (2 μM) was measured by loss of fluorescence.
(D) In vitro degradation of N-degron GFP (1 μM) by E. coli ClpAP (0.4 μM ClpP14, 0.2 μM ClpA6) and A. tumefaciens ClpS2 (2 μM) was measured by loss of fluorescence. The no ClpS control is the same as in panel C. FLFVQ-GFP unfolding rates as a function of ClpS1 and ClpS2 concentration with 100 nM ClpA6, 1 μM FLFVQ-GFP, and 5 μM GroELtrap 14mer. Points are averages of 3 independent experiments and errors represent ± 1 SD. Curves are non-linear least squares fits to a hyperbolic binding isotherm, R > 0.95. Kapp values are averages (N = 3) ± the greater of 1 SEM or 10% of average.
(E) In vitro unfolding of N-degron GFP (1 μM) by ClpA6 (0.5 μ), ClpS1 (1 μM), and ClpS2 (1 μM). See A for experimental details. See also Figures S1 and S2.
We next assayed the apparent binding affinities between the ClpS adaptors and ClpA by measuring initial unfolding rates of FLFVQ-GFP, using 100 nM ClpA6 and a range of ClpS1 or ClpS2 concentrations (Fig. 4E). With both ClpS paralogs, half-maximal stimulation of unfolding (Kapp) occurred at ClpS1 and ClpS2 concentrations of between 400–500 nM, although the maximal delivery rate was higher for ClpS1. This difference in delivery rates might be due to the differing lengths and compositions of the ClpS1 and ClpS2 N-terminal extensions. As such, we replaced the N-terminal extension of ClpS2 with that of ClpS1 and assayed delivery of N-degron GFP to ClpA. This mutant, ClpS2S1NTE, displayed a similar hierarchy of preferred N-degrons to that of WT ClpS2 (Fig. S1A). However, its delivery was less efficient than either ClpS1 or WT ClpS2 (Fig. S1B), suggesting that the ClpS1 N-terminal extension, alone, cannot confer greater delivery efficiency to ClpS2.
Although ClpS1 and ClpS2 appear to bind ClpA with similar affinities, it is possible that one adaptor might interact more favorably with ClpA during subsequent steps of the delivery reaction. In this case, if both adaptors are present, one adaptor may outcompete the other for delivery of substrates. Therefore, we assayed N-degron-GFP unfolding using a mixture of ClpS1 and ClpS2.. In the presence of a 1:1 mixture of ClpS1 and ClpS2, we observed efficient unfolding of FLFVQ-GFP, reflecting the ability of both adaptors to deliver this substrate (Fig. 4F). Moreover, ClpA unfolded YLFVQ-GFP, WLFVQ-GFP, and LLFVQ-GFP at rates intermediate between those observed in the ClpS1-only and ClpS2-only reactions. Thus, when both ClpS1 and ClpS2 were present, neither adaptor dominated in delivery of substrates to ClpA. Together, our experiments suggest that by altering the relative levels of ClpS1 and ClpS2, the A. tumefaciens cells could tune the level of unfolding and degradation of substrates with N-terminal Tyr, Trp, or Leu residues.
In addition to delivering N-end rule substrates, E. coli ClpS also inhibits the degradation of other substrates, including ssrA-tagged substrates, by ClpAP. Therefore, we also tested the ability of ClpS1 and ClpS2 to inhibit GFP-ssrA degradation by E. coli ClpAP. ClpS1 (at 2 μM) modestly inhibited the degradation of GFP-ssrA (at 1 μM) (Fig. S2). ClpS2 (at 2 μM) also weakly inhibited GFP-ssrA (at 1 μM) degradation (Fig. S2). Thus, both adaptors can inhibit GFP-ssrA degradation by E. coli ClpAP, albeit with differing efficiencies.
Ligand-stabilized conformational changes in the ClpS2 binding pocket
We addressed the structural basis of the restricted binding specificity of ClpS2 by solving crystal structures without ligand (1.95 Å; PDB: 4YJM), with bound Phe-amide (2.55 Å; PDB: 4YJX), and with bound Tyr-amide (2.80 Å; PDB: 4YKA) (Table 1, Fig. 5 and Fig. S3). Phe-amide and Tyr-amide mimic peptide-bonded amino acids, as they have an amide in place of the carboxyl group. Simulated annealing FO-FC omit maps strongly support high occupancy of these substrate analogs in the binding pocket. The overall fold of each ClpS2 structure agreed well with those of C. crescentus and E. coli ClpS (Fig. 5D and Fig. 1B). However, soaking ligands into our apo crystals resulted in substantial conformational shifts (Fig. 6B), with least-squares superpositions of main-chain atoms giving an RMSD of 0.78 Å for the apo and Phe-bound structures and 0.15 Å for the Phe- and Tyr-bound structures. The largest backbone changes occurred in helix 2, which forms part of the ClpS2 binding pocket (Fig. 6A and B). A shift in helix 2 moved the His62 ND1 nitrogen about 3 Å, allowing formation of an important hydrogen bond with the α-amino group of the bound ligand (Fig. 6B). This movement also shifted additional helix-2 binding-pocket residues (i.e. Met58, Ala61) to allow accommodation and close packing against the side-chain of the bound ligand (Fig. 6B; Fig. 7A). Several residues outside of helix 2 also shifted to interact with the ligand; for example, the side-chain carbonyl oxygen of Asn30 moved about 1 Å to hydrogen bond with the α-amino group of Phe-amide (Fig. 6B).
Table 1. Crystallographic data and refinement statistics.
Values in parentheses represent the highest resolution bins: 1.98–1.95 Å for PDB: 4YJM, 2.59–2.55 Å for PDB: 4YJX, and 2.85–2.80 Å for PDB: 4YKA. and , where 〈Ihkl〉 is the average of symmetry-related observations of a unique reflection. , calculated over the 95% of the data in the working set. Rfree is equivalent to Rwork except that it is calculated over the remaining 5% of the data. Geometry was assessed using MolProbity (Chen et al., 2009). See supplementary information for PDB validation reports.
| PDB ID | 4YJM | 4YJX | 4YKA |
|---|---|---|---|
| Data Collection | |||
| Ligand | None | Phe-amide | Tyr-amide |
| Space Group | P212121 | P212121 | P212121 |
| Unit Cell: a, b, c (Å) | 58.01 92.55 96.46 | 58.03 92.99 94.25 | 57.95 92.65 94.92 |
| Resolution (Å) | 1.95 | 2.55 | 2.80 |
| Wavelength (Å) | 0.979 | 1.54 | 1.54 |
| Rsym | 0.067 | 0.098 | 0.161 |
| Rpim | 0.027 | 0.039 | 0.046 |
| Number of Reflections | 38283 | 17258 | 13021 |
| Completeness (%) | 99.7 (100) | 99.9 (100) | 99.7 (96.4) |
| Data Redundancy | 7.2 (7.3) | 7.1 (6.6) | 12.5 (6.2) |
| Wilson B | 31.1 | 36.3 | 44.6 |
| 〈I/σ(I)〉 | 3.21 (at 1.96 Å) | 3.43 (at 2.54 Å) | 2.12 (at 2.81 Å) |
| Refinement and Validation | |||
| Rwork | 0.177 | 0.176 | 0.187 |
| Rfree | 0.209 | 0.216 | 0.256 |
| Average B-factor | 59.0 | 45 | 49 |
| Rmsd bonds (Å) | 0.012 | 0.004 | 0.003 |
| Rmsd angles (°) | 1.18 | 0.81 | 0.67 |
| Rotamer Outliers (%) | 0.68 | 0 | 0 |
| Ramachandran Outliers (%) | 0 | 0 | 0 |
| Ramachandran Favored (%) | 99.39 | 93.38 | 99.08 |
| Clash Score | 0.93 | 0.73 | 0.92 |
| Clash Score Percentile | 100th (N = 721) | 100th (N = 259) | 100th (N = 139) |
| Molprobity Score | 0.78 | 0.73 | 0.78 |
| Molprobity Percentile | 100th (N = 12327) | 100th (N = 6632) | 100th (N = 4394) |
Figure 5. The structure of apo and ligand-bound ClpS2.

(A) 2F0−FC electron density map, contoured at 1.25 σ, for residues 66–69 in Chain A of the Apo (PDB: 4YJM) structure
(B) Simulated annealing F0−FC omit map, contoured at 2.0 σ, for the Tyr-bound structure is shown in green. Tyr-Amide (yellow), His62 (cyan), and Asp31 (cyan) of Chain A of the Tyr-bound structure are also shown.
(C) Simulated annealing F0 −FC omit map, contoured at 2.0 σ, for the Phe-bound structure is shown in green. Phe-amide (blue), His62 (green), and Asp31 (green) in Chain A of the Phe-bound structure are also shown.
(D) Cartoon representation, with transparent surface, of a Phe-bound ClpS2 monomer. The Phe-amide ligand (blue) is shown in stick representation. See also Figure S3.
Figure 6. The ClpS2 binding pocket undergoes ligand-stabilized conformational changes.

(A) Cartoon representation of Phe-bound monomer with Helix 2 colored in cyan and its terminal residues labeled.
(B) Upper Left: Cα overlay of Phe-bound (green) and Apo (orange) structures. Upper Right: Cα overlay of monomer from Phe-bound (green) and Tyr-bound (purple, PDB: 4YKA) structures.
Bottom: Selected binding pocket residues of aligned Phe-bound (green) and Apo (orange) structures with the bound Phe-amide in grey. The black dotted lines represent hydrogen bonds with the α-amino group in the Phe-bound pocket.
(C) Left: Model of Leu in the binding pocket of the Phe-bound structure. Yellow surfaces indicate potential clashes with the Leu side-chain. Right: Phe-amide bound in the ClpS2 binding pocket
Figure 7. ClpS2 disfavors binding of Tyr and Trp via steric clashes.

(A) Surface representation cross-sections of the ClpS2 binding pocket in the Apo, Phe-bound, and Tyr-bound structures. Arrows indicate rotations and shifts in residues in the Apo pocket required to form the Phe- and Tyr-bound pockets.
(B) Left: Dot representation (representing the van der Waals surface of atoms) of bound Tyr-amide and selected residues at the base of the ClpS2 binding pocket in the Tyr-bound structure.
Right: Dot representation of bound Tyr peptide and selected residues at the base of the C. crescentus ClpS binding pocket (PDB: 3DNJ).
(C) Roles of the ClpS2 residues that select against Tyr or Trp binding in the ClpS2 binding pocket. Only Tyr-amide is shown bound in the ClpS2 pocket.
(D) Summary of measured dissociation constants (KD) for ClpS2 mutants and each peptide from panels B and D. Each KD represents an average (N = 3) ± the greater of 1 SEM or 10% of average.
(E) Summary of the calculated ΔΔG values for each mutant binding to Fpep, Ypep, and Wpep. Each value represents an average (N = 3) ± the greater of 1 SEM or 10% of average.
(F) Initial rates of N-degron GFP unfolding ((% N-degron GFP unfolded/sec) for WT, L28A, and R36M ClpS2. Conditions are the same as described Fig. 4A. Rates represent an average (N = 3) ± the greater of 1 SEM or 10% of average.
These structural results suggest that appropriate N-degron binding stabilizes a “tight” binding-pocket conformation that is energetically unfavorable and thus poorly populated in apo ClpS2. This model, in turn, implies that there is an energetic cost for N-degrons to bind to ClpS2, as binding must “pay” for the cost of the associated conformational change. The bound Phe side chain fits tightly into the ClpS2 pocket, with optimal hydrophobic and van der Waals interactions, and thus achieves a reasonably tight binding affinity despite this energetic cost. Modeling suggested that the smaller, but branched, Leu side chain would clash with some atoms in the pocket observed in the Phe-bound structure and would fill other parts of the pocket less well than Phe (Fig. 6C). As a result, the free energy of Leu binding may not be sufficient to drive the conformational change necessary to form the “tight” binding pocket (see Discussion).
In the Tyr-bound ClpS2 structure, we observed crowding near the side-chain –OH of the tyrosine ring (Fig. 7A and B). Specifically, the side chain of Leu28 in ClpS2, buttressed by Phe97, clashed mildly with the Tyr –OH (3.1 Å; Fig. 7B). This clash may explain the ~4-fold weaker binding of Tyr than Phe. In C. crescentus ClpS, by contrast, the residue corresponding to Leu28 (Ile45) adopts a rotamer that does not clash with the Tyr –OH group, because the residue corresponding to Phe97 (Cys114) is smaller (Fig. 1C and Fig. 7B). Additionally, the carbonyl of Leu29 in ClpS2 also clashed with the Tyr –OH (2.3 Å; Fig. 7B). When we modeled a Trp side chain into the ClpS2 pocket, we also observed small potential clashes with residues in the binding pocket (Fig. 7C).
To test the importance of Leu28 (that appears to clash with Tyr-amide) in determining the relative affinity of ClpS2 for different N-degron side chains, we assayed binding to the L28A mutant. This variant bound Ypep more strongly than the parent protein (ΔΔG = −0.26 kcal/mol) but bound Fpep (ΔΔG = 0.91 kcal/mol) and Wpep (ΔΔG = 0.30 kcal/mol) more weakly (Fig. 7D and E). Decreased hydrophobic packing at the base of the L28A binding pocket presumably accounts for weaker binding to peptides with N-terminal Phe and Trp residues, whereas relief of the steric clash overcomes this effect and strengthens binding to peptides with an N-terminal Tyr residue. Like the parent protein, the L28A variant did not bind Lpep. Consistently, the L28A ClpS2 variant supported faster ClpA unfolding of YLFVQ-GFP than FLFVQ-GFP or WLFVQ-GFP and did not unfold LLFVQ-GFP (Fig. 7F).
The side chain of Arg36 lines part of the ClpS2 binding pocket (Fig. 6B and Fig. 7C). The corresponding position in ClpS1 and most ClpS orthologs is Met and has been implicated in governing binding specificity, as a mutation to Ala in E. coli ClpS allows binding of non-canonical β-branched Ile and Val N-degrons (Wang et al., 2008b). We found that the R36M ClpS2 variant bound Ypep with higher affinity than the parent protein (ΔΔG = −0.74 kcal/mol), showed smaller improvements in binding Fpep (ΔΔG = −0.17 kcal/mol) and Wpep (ΔΔG = −0.30 kcal/mol), and did not bind Lpep (Fig. 7D and E). Consistently, despite the R36M ClpS2 variant’s general weakness in delivery, this adaptor displayed a large relative improvement in delivery of YLFVQ-GFP to ClpA for unfolding, as compared to the delivery of FLFVQ-GFP (Fig. 7F). In the R36M variant, elimination of charge repulsion between the Arg36 side chain and the α-amino group of the N-degron may improve binding to all peptide variants and also allow repositioning of the Tyr side chain to avoid steric clashes at the base of the pocket.
ClpS1 and ClpS2 are differentially expressed in A. tumefaciens
To test if A. tumefaciens expresses the ClpS paralogs differentially, we assayed the protein levels of ClpS1 and ClpS2 by western blotting using cell lysates from different stages of growth (Fig. 8A). These experiments showed robust levels of ClpS1 protein in exponential and stationary phase cells. However, substantial accumulation of ClpS2 protein was only observed in stationary-phase cells (Fig. 8A and Fig. S4). Using purified ClpS1 and ClpS2 as standards, we estimated that ClpS1 protein levels were ~2.5-fold higher than ClpS2 in mid-to-late stationary phase. RT-qPCR measurements also detected differential regulation of ClpS1 and ClpS2 mRNA levels upon transition to stationary phase. These results indicate that changes in ClpS1 and ClpS2 protein levels depend upon changes in translation/degradation as well as changes in gene expression. In combination, these experiments suggest that the biological role of ClpS2 is largely restricted to stationary phase.
Figure 8. ClpS1 and ClpS2 are differentially expressed in A. tumefaciens.

(A) Representative western blot of cell lysate samples from different stages of growth. Top: Growth curve of A. tumefaciens GV3101 that corresponds to the western blots shown below. Bottom: Selected slices of western blots using anti-ClpS1 or anti-ClpS2 polyclonal antibodies. Ponceau staining of total protein is shown as a loading control. A western blot of purified ClpS1 and ClpS2 is shown to the right to demonstrate antibody specificity.
(B) A model illustrating the potential downstream effect of altered ClpS1 and ClpS2 levels on the bacterial proteome. As levels of ClpS2 increase relative to ClpS1, substrates with N-terminal Phe (grey) may be degraded more rapidly, leading to lower steady state levels of these proteins. In contrasts, substrates with N-terminal Tyr (red), N-terminal Trp (purple), and N-terminal Leu (blue) may be degraded less often, leading to higher steady state levels of these proteins.
See also Figure S4.
Discussion
We find that A. tumefaciens expresses ClpS1 in both exponential and stationary phase, whereas ClpS2 is present at substantial levels only as cells enter stationary phase. Moreover, our biochemical studies show specificity differences between these adaptor paralogs. For example, A. tumefaciens ClpS1 binds proteins with N-terminal Phe, Tyr, Trp, or Leu residues and delivers them to ClpA for unfolding. These activities closely resemble those of well-studied ClpS adaptors from bacteria that encode only a single ClpS ortholog, a result consistent with strong sequence homology between the ClpS and α-proteobacterial ClpS1 families. By contrast, A. tumefaciens ClpS2 only recognizes substrates with N-end Phe, Tyr, and Trp residues and fails to bind and deliver proteins beginning with Leu. The sequences of α-proteobacterial ClpS2 orthologs are highly conserved, and thus this family of N-end-rule adaptors is likely to have more stringent specificity than their ClpS1 paralogs. In combination, these results suggest that N-end-rule proteolysis in α-proteobacteria is regulated using paralogous adaptors with distinct but overlapping specificities and expression patterns.
The affinity of A. tumefaciens ClpS1 for N-end peptides beginning with Phe, Tyr, Trp, and Leu varies over a narrow ~3-fold range. Similar narrow affinity ranges for these four canonical bacterial N-end-rule residues also occur for C. crescentus ClpS and E. coli ClpS (Schuenemann et al., 2009; Wang et al., 2008b). Thus, the binding pockets of these adaptors accommodate side chains of moderately different size, shape, and polarity with similar interaction energies. Crystal structures of free and N-degron-bound C. crescentus ClpS show that the binding pocket is very similar in the apo, Phe-bound, Tyr-bound, and Trp-bound structures but rearranges slightly in the Leu-bound structure to maximize contacts with the smaller side chain (Román-Hernández et al., 2009; Wang et al., 2008b).
Strikingly, we find that the A. tumefaciens ClpS2 adaptor shows no detectable binding to an N-terminal Leu peptide, a novel restriction in N-degron specificity. Based on our crystal structures, apo ClpS2 has an open peptide-binding pocket that closes when Phe or Tyr bind. If a similar conformational change occurs in solution, then some of the N-degron binding energy must be used to drive this structural change. Although this thermodynamic cost would weaken binding, it does not explain why ClpS fails to bind Leu but still binds well to Phe. Moreover, it is possible that our crystal structures do not accurately represent the range of conformations present in solution. When we model Leu in the conformation observed in the C. crescentus ClpS structure into the closed A. tumefaciens ClpS2 binding pocket, steric clashes occur with the side chains of Met58 and Val39. Only one rotamer of Leu fit into the ClpS2 pocket without any of these steric clashes. However, this rotamer is present in only 0.2% of leucines in the structure database, whereas the rotamer observed in the Phe-amide structure is present in 24.7% of phenylalanines in the structure database (Chen et al., 2009). Assuming that the distribution of rotamers in the structure database approximates the distribution of rotamers in unstructured molecules in solution, we predict that Leu binding would be ~120-fold weaker than Phe binding, solely considering side-chain entropy. In addition to steric clashes, there is a void between the modeled Leu side chain and the Ala61 side chain (Fig. 6C).
In the Leu-bound C. crescentus ClpS structure, Val78 occupies the Ala61 position and conformational shifts in the binding pocket allow the void to be filled (Román-Hernández et al., 2009). In addition, in A. tumefaciens ClpS2, the side chain of Leu28 packs closely against bound Phe, but would provide only weak van der Waals interactions with bound Leu. In the C. crescentus ClpS structure, the corresponding Ile45 adopts a rotamer that packs less tightly against bound Phe, leading to a smaller energy difference between Leu and Phe interactions at the base of the binding pocket. We propose that Leu binding to ClpS2 is reduced to an undetectable level because the binding pocket cannot rearrange to avoid clashes and minimize the impact of lost van der Waals and hydrophobic interactions. Support for this model comes from studies of protein stability, where the Phe7 to Leu mutation in barnase does not result in structural adaptation and destabilizes the native structure by 4.6 kcal/mol (Chen et al., 1995; Kellis et al., 1988). An energetic change of comparable magnitude would weaken ClpS2 affinity for Leu more than 2000-fold compared to Phe. Thus, ClpS2 likely optimizes Phe binding, maintaining an affinity comparable to ClpS1, at the expense of Leu binding by employing conformational changes and remodeling of the substrate-binding pocket.
How might increased ClpS2 levels, as cells enter stationary phase, impact N-end-rule degradation? If ClpS1 is in excess of ClpA in the cell, then increasing the levels of ClpS2 should decrease the rate of degradation of proteins with N-terminal Tyr, Trp, and Leu, increasing their steady-state levels in the cell. Irrespective of ClpA levels, however, increased ClpS2 would focus degradation on substrates with N-terminal Phe (Fig. 8B). Recent studies suggest that Leu is the most abundant E. coli N-degron, followed by Phe (Humbard et al., 2013; Ninnis et al., 2009; Schmidt et al., 2009). If these observations hold true for A. tumefaciens, elevated levels of ClpS2 could affect the proteome by favoring degradation of Phe substrates over Leu substrates. Moreover, specific substrates with N-terminal Phe may need to be degraded more efficiently during stationary phase than during exponential phase. Conversely, proteins with N-terminal Tyr, Trp and/or Leu might be advantageous at higher levels during stationary phase. As other clades of proteobacteria do not employ a ClpS2 adaptor, such substrates would likely serve α-proteobacterial-specific functions. Identifying these substrates could provide insights into the biological role of the bacterial N-end rule and why many α-proteobacteria have evolved a tunable recognition system.
Interestingly, α-proteobacteria are not alone in employing N-end-rule adaptors with differing specificities. We found that S. elongatus ClpS1 bound N-terminal Phe, Tyr, and Trp, whereas ClpS2 bound N-terminal Leu, Phe, Tyr, Val, and Ile. The ability of S. elongatus ClpS2 to recognize Val and Ile may be a consequence of the presence of Phe74 at the “gating” methionine position, which is responsible for excluding β-branched amino acids from the E. coli ClpS binding pocket (Wang et al., 2008b). Indeed, Tyr and Phe are often observed at this position in the ClpS-like domains of N-end-rule specific E3 ligases that recognize N-terminal Ile (Lupas and Koretke, 2003; Varshavsky, 2011). The ability of ClpS2 to bind substrates with N-terminal Val is intriguing, as methionine aminopeptidase is predicted to cleave many of the N-terminal Met residues adjacent to Val. Thus, in their native states, many proteins in S. elongatus (111 of the 2657 proteins in the proteome) may present N-degrons that can be recognized by ClpS2.
Our work supports the idea that both cyanobacteria and α-proteobacteria can tune N-end-rule recognition via expression of different ClpS proteins. This strategy represents an interesting parallel with the eukaryotic N-end rule. For example, mammals employ at least five N-end-rule specific E3 ligases that recognize different classes of N-terminal residues and facilitate their polyubiquitinylation (Varshavsky, 2011). By tuning the levels of these enzymes, cells can modulate which substrates will be recognized and which will avoid degradation. Similarly, bacteria with multiple ClpS proteins can regulate which N-end-rule substrate classes are most efficiently recognized for degradation. In combination with previous studies, our work demonstrates that evolution can alter the binding pocket of ClpS pocket either to expand or to narrow N-degron binding specificity. These features may make ClpS an attractive module for engineering artificial protein-interaction networks.
Materials and Methods
Strains and Plasmids
All proteins were expressed in E. coli strain BL21 (DE3) transformed with appropriate plasmid vectors. A. tumefaciens ClpS1, ClpS2, and ClpA ORFs were amplified from A. tumefaciens GV3101 (a gift from Mary Gehring, Whitehead Institute/MIT and Graham Walker, MIT) by colony PCR. S. elongatus ClpS1 and ClpS2 were amplified from S. elongatus Strain PCC 7942 genomic DNA (ATCC) using standard molecular biology techniques. The ClpS1 and ClpS2 ORFs were inserted into a pET23b vector at the C-terminus of H6-SUMO. ClpA was inserted into pET23b with a C-terminal H6 tag. For 35S-lableled proteins, E. coli Bl21 cultures expressing the desired protein were grown at 37°C in LB to OD600 = 1, centrifuged, resuspended in M9 medium + 10% LB broth, supplemented with EXPRESS [35S]-protein labeling mix (Perkin Elmer) and grown for 4 h. Western blotting experiments were performed using A. tumefaciens strain GV3101.
Peptides and Proteins
Peptide blots were synthesized by standard Fmoc techniques using a ResPep SL peptide-blot synthesizer (Intavis). Peptides used for binding studies (FRFVQELASKEVC, YRFVQELASKEVC, LRFVQELASKEVC, WRFVQELASKEVC) were synthesized by standard Fmoc techniques using a solid phase peptide synthesizer (Apex 396), labeled with fluorescein-5-maleimide (Life technologies), and purified by HPLC (Wang et al., 2008a). L-Phe-amide and L-Tyr-amide were purchased from Sigma-Aldrich.
ClpS1, ClpS2, and GFP variants (FLFVQ-GFP, YLFVQ-GFP, LLFVQ-GFP) were expressed as H6-SUMO-fusion proteins, subjected to Ni-NTA affinity chromatography before and after cleavage with Ulp1 protease, and purified by gel-filtration and ion-exchange chromatography as described (Román-Hernández et al., 2011). 35S-labeled proteins were purified similarly, except the size-exclusion step was omitted. ClpA was purified by Ni-NTA chromatography (Qiagen), followed by gel filtration on Sephacryl-300 16/60 (GE Healthcare). The protein was concentrated and stored in reaction solution (50 mM HEPES (pH 7.5), 300 mM NaCl, 20 mM MgCl2, 0.5 mM DTT, 10% glycerol). GroEL D87K was purified by 30% and 60% AmSO4 precipitations, incubation with Affi-gel Blue gel (Bio-Rad), purification by ion-exchange chromatography on MonoQ 5/50 GL (GE Healthcare), and was stored in solution A (50 mM Tris (pH 7.5), 50 mM KCl, 1 mM DTT, 10% glycerol) as described (Burton et al., 2001).
Peptide Blots
Peptide blots were blocked sequentially with 1X PBS plus 0.5% tween-20 without and with 10 mg/mL bovine serum albumin. The blots were then incubated with 625 nM 35S-labeled proteins in ClpS solution (20 mM HEPES (pH 7.5), 150 mM KCl, 10% glycerol, 1 mM DTT), exposed to a phosphor screen for 24–60 hours (Molecular Dynamics) and imaged using Typhoon FLA 9500 laser scanner (GE Healthcare).
Crystallography
Crystals of A. tumefaciens ClpS2 were grown at 18°C for 2 weeks in hanging drops containing 1 μL of protein solution (3.5–5 mg/mL) and 1 μL of reservoir solution (2.2 M AmSO4, 0.2 M sodium formate). Crystals were briefly dipped in reservoir solution plus 20% ethylene glycol for cryoprotection and were flash frozen. Data were collected at the NE-CAT 24-ID-E beamline (Argonne National Laboratory). For ligand-bound crystals, apo crystals were soaked in reservoir solution with 2 mM L-Phe-amine or L-Tyr-amide for 5 min and then were cryoprotected and flash frozen. Data were collected using a Rigaku Micromax 007-HF rotating anode equipped with Varimax-HF mirrors, a Saturn 944 detector, and an Oxford cryosystems 700 series cold head. Diffraction data were indexed, integrated, and scaled using HKL2000. Initial phases for the apo structure (PDB: 4YJM) were determined by molecular replacement using the PHASER module (McCoy et al., 2007) in PHENIX with a C. crescentus ClpS structure (PDB: 3DNJ) as a search model. Subsequent structures (PDB: 4YJX, 4YKA) were solved using the apo structure as a starting model for refinement. Final structures were obtained using iterative model building in COOT (Emsley et al., 2010) and refinement in PHENIX (Adams et al., 2010). To generate simulated annealing F0−FC omit maps, ligands were deleted from the final structures and simulated annealing was run in Phenix.
Solution Binding
Binding of peptides to ClpS1 or ClpS2 at 30°C was monitored by fluorescence anisotropy (495 nm excitation; 515 nm emission) using a Photon Technology International Fluorimeter. Fluorescent peptide (200 nM) and different concentrations of ClpS1 or ClpS2 protein in ClpS solution were incubated until equilibrium was reached. Data were fitted to a hyperbolic binding isotherm using a nonlinear least squares algorithm. Raw anisotropy values were normalized using the equation (X − B) / A where X is the raw anisotropy, B is the value of the fit in the absence of ClpS (0.02 to 0.05) and A is the amplitude of the fit (0.07 to 0.12). KD values are averages (n = 3) ± the greater of 1 standard error of the mean (SEM) or 10% of the average. For mutant analysis, ΔΔG values were calculated as ΔGmut − ΔGWT = RTln(KDmut/KDWT), where R = 0.00198 kcal•K−1•mol−1 and T is the temperature in Kelvin.
Unfolding and Degradation Assays
For unfolding reactions, ClpA6 (0.5 μM), ClpS1 or ClpS2 (2 μM), N-degron GFP (1 μM), and GroEL14 D87K (10 μM) were pre-incubated for 3 min in reaction solution at 30°C. For the mixed ClpS experiments, 1 μM ClpS1 and 1 μM ClpS2 were used. Reactions were initiated by addition of ATP and a regeneration system (16 mM ATP, 200 μg/mL creatine kinase, 20 mM creatine phosphate). GFP unfolding was monitored by loss of fluorescence (420 nm excitation; 540 nm emission), and data were normalized to the fluorescence at time zero. For further analysis, average initial rates of unfolding (in % N-degron GFP/sec, n = 3) were normalized to FLFVQ-GFP initial rates for each ClpS2 variant. Errors for normalized initial rates of unfolding are the greater of 1 SEM or 10% of the average.
Experiments to monitor the effect of different concentrations of ClpS on N-degron GFP (1 μM) unfolding contained ClpA6 (0.1 μM), GroEL14 D87K (5 μM), and ATP and the regeneration system. Initial rates were converted to units of GFP concentration using a standard curve and normalized to the total ClpA6 concentration. Kapp values are averages (n = 3) ± the greater of 1 SEM or 10% of the average.
Degradation reactions were performed with E. coli ClpA6 (0.2 μM), E. coli ClpP14 (0.4 μM), ClpS1 or ClpS2 (2 μM) and N-degron GFP (1 μM). Reactions and data analysis were carried out in the same manner as the unfolding assays.
Western Blotting
A. tumefaciens strain GV3101 was grown at 28°C in LB broth with 50 μg/mL gentamycin and 10 μg/mL rifampicin. Cells were removed at different times during growth, lysed in Laemmeli sample buffer, and electrophoresed on Mini-PROTEAN TGX 4–15% (wt/vol) precast gels (Bio-Rad). Proteins were transferred to Immobilon-P membranes (EMD Millipore) in a wet transfer apparatus (Bio-Rad). Membranes were probed with polyclonal antibodies (produced by Covance Research Products) raised against ClpS1 (1:50 dilution) or ClpS2 (1:25 dilution) overnight at 4°C, incubated with goat anti-rabbit IgG-AP conjugate (Bio-Rad; 1:10,000 dilution) for 1 h at room temperature, and developed with alkaline phosphatase dephosphorylates ECF Substrate (GE Healthcare). The blots were exposed with a blue laser using a Typhoon FLA 9500 scanner (GE Healthcare). To estimate relative amounts of ClpS1 and ClpS2, bands were quantified using ImageQuant (GE Healthcare) and compared to standard curves of purified proteins within the same blot.
Supplementary Material
Highlights.
A. tumefaciens ClpS1 binds and delivers N-degron Phe, Tyr, Trp, and Leu to ClpA
A. tumefaciens ClpS2 binds and delivers only N-degron Phe, Tyr, and Trp to ClpA
Apo and holo ClpS2 structures reveal distinct conformations that define specificity
The paralogs are at different levels, with ClpS2 increasing at stationary phase
Acknowledgments
We thank I. Levchenko for peptide synthesis, the MIT BioMicroCenter for use of their LightCycler 480 machine, F. Solomon, A. Torres-Delgado, B. Brown, S. Calmat, and H. Chandra Kotamarthi for helpful discussion, and M. Gehring and G. Walker for providing A. tumefaciens strain GV3101. This work was supported in part by National Institutes of Health Pre-Doctoral Training Grant T32GM007287, the Howard Hughes Medical Institute, and National Institutes of Health Grants GM-49224 and Al-16892. T.A.B. is an employee of the Howard Hughes Medical Institute. Studies using the NE-CAT beamline were supported by the NIGMS (P41 GM103403-10). Use of the Advanced Photon Source at Argonne National Laboratory was supported by the US DOE (contract DE-AC02-06CH11357).
Footnotes
The authors declare no conflicts of interest.
Author Contributions
Conceptualization, B.J.S., R.T.S., and T.A.B.; Methodology, B.J.S., R.T.S., and T.A.B.; Investigation, B.J.S.; Formal Analysis, B.J.S., R.A.G., R.T.S., and T.A.B.; Writing - Original Draft, B.J.S., R.T.S., and T.A.B.; Writing – Review & Editing, B.J.S., R.A.G, R.T.S., and T.A.B.; Supervision, R.A.G, R.T.S, and T.A.B.; Funding Acquisition, T.A.B.
Publisher's Disclaimer: This is a PDF file of an unedited manuscript that has been accepted for publication. As a service to our customers we are providing this early version of the manuscript. The manuscript will undergo copyediting, typesetting, and review of the resulting proof before it is published in its final citable form. Please note that during the production process errors may be discovered which could affect the content, and all legal disclaimers that apply to the journal pertain.
References
- Adams PD, Afonine PV, Bunkóczi G, Chen VB, Davis IW, Echols N, Headd JJ, Hung LW, Kapral GJ, Grosse-Kunstleve RW, et al. PHENIX: a comprehensive Python-based system for macromolecular structure solution. Acta Crystallogr Sect D Biol Crystallogr. 2010;66:213–221. doi: 10.1107/S0907444909052925. [DOI] [PMC free article] [PubMed] [Google Scholar]
- Burton BM, Williams TL, Baker TA. ClpX-Mediated Remodeling of Mu Transpososomes Selective Unfolding of Subunits Destabilizes the Entire Complex. Molecular Cell. 2001;8:449–454. doi: 10.1016/s1097-2765(01)00307-0. [DOI] [PubMed] [Google Scholar]
- Chen VB, Arendall WB, III, Headd JJ, Keedy DA, Immormino RM, Kapral GJ, Murray LW, Richardson JS, Richardson DC. MolProbity: all-atom structure validation for macromolecular crystallography. Acta Crystallogr Sect D Biol Crystallogr. 2009;66:12–21. doi: 10.1107/S0907444909042073. [DOI] [PMC free article] [PubMed] [Google Scholar]
- Chen YW, Fersht AR, Henrick K. Crystallographic analysis of Phe→Leu substitution in the hydrophobic core of barnase. Acta Crystallogr Sect D Biol Crystallogr. 1995;51:220–231. doi: 10.1107/S0907444994008851. [DOI] [PubMed] [Google Scholar]
- De Donatis GM, Singh SK, Viswanathan S, Maurizi MR. A single ClpS monomer is sufficient to direct the activity of the ClpA hexamer. J Biol Chem. 2010;285:8771–8781. doi: 10.1074/jbc.M109.053736. [DOI] [PMC free article] [PubMed] [Google Scholar]
- Dougan DA, Micevski D, Truscott KN. The N-end rule pathway: From recognition by N-recognins, to destruction by AAA+ proteases. BBA - Molecular Cell Research. 2011;1823:83–91. doi: 10.1016/j.bbamcr.2011.07.002. [DOI] [PubMed] [Google Scholar]
- Dougan DA, Reid BG, Horwich AL, Bukau B. ClpS, a substrate modulator of the ClpAP machine. Molecular Cell. 2002;9:673–683. doi: 10.1016/s1097-2765(02)00485-9. [DOI] [PubMed] [Google Scholar]
- Emsley P, Lohkamp B, Scott WG, Cowtan K. Features and development of Coot. Acta Crystallogr Sect D Biol Crystallogr. 2010;66:486–501. doi: 10.1107/S0907444910007493. [DOI] [PMC free article] [PubMed] [Google Scholar]
- Erbse A, Schmidt R, Bornemann T, Schneider-Mergener J, Mogk A, Zahn R, Dougan DA, Bukau B. ClpS is an essential component of the N-end rule pathway in Escherichia coli. Nature. 2006;439:753–756. doi: 10.1038/nature04412. [DOI] [PubMed] [Google Scholar]
- Guo F, Esser L, Singh SK, Maurizi MR, Xia D. Crystal Structure of the Heterodimeric Complex of the Adaptor, ClpS, with the N-domain of the AAA+ Chaperone, ClpA. Journal of Biological Chemistry. 2002;277:46753–46762. doi: 10.1074/jbc.M208104200. [DOI] [PubMed] [Google Scholar]
- Hou JY, Sauer RT, Baker TA. Distinct structural elements of the adaptor ClpS are required for regulating degradation by ClpAP. Nat Struct Mol Biol. 2008;15:288–294. doi: 10.1038/nsmb.1392. [DOI] [PubMed] [Google Scholar]
- Hu RG, Wang H, Xia Z, Varshavsky A. The N-end rule pathway is a sensor of heme. PNAS. 2008;105:76–81. doi: 10.1073/pnas.0710568105. [DOI] [PMC free article] [PubMed] [Google Scholar]
- Humbard MA, Surkov S, De Donatis GM, Jenkins L, Maurizi MR. The N-degradome of escherichia coli: limited proteolysis in vivo generates a large pool of proteins bearing N-degrons. J Biol Chem. 2013 doi: 10.1074/jbc.M113.492108. [DOI] [PMC free article] [PubMed] [Google Scholar]
- Kellis JT, Jr, Nyberg K, Sail DRXA, Fersht AR. Contribution of hydrophobic interactions to protein stability. Nature. 1988;333:784–786. doi: 10.1038/333784a0. [DOI] [PubMed] [Google Scholar]
- Lee MJ, Tasaki T, Moroi K, An JY, Kimura S, Davydov IV, Kwon YT. RGS4 and RGS5 are in vivo substrates of the N-end rule pathway. PNAS. 2005;102:15030–15035. doi: 10.1073/pnas.0507533102. [DOI] [PMC free article] [PubMed] [Google Scholar]
- Licausi F, Kosmacz M, Weits DA, Giuntoli B, Giorgi FM, Voesenek LACJ, Perata P, van Dongen JT. Oxygen sensing in plants is mediated by an N-end rule pathway for protein destabilization. Nature. 2011;479:419–422. doi: 10.1038/nature10536. [DOI] [PubMed] [Google Scholar]
- Lupas AN, Koretke KK. Bioinformatic analysis of ClpS, a protein module involved in prokaryotic and eukaryotic protein degradation. Journal of Structural Biology. 2003;141:77–83. doi: 10.1016/s1047-8477(02)00582-8. [DOI] [PubMed] [Google Scholar]
- McCoy AJ, Grosse-Kunstleve RW, Adams PD, Winn MD, Storoni LC, Read RJ. Phaser crystallographic software. J Appl Crystallogr. 2007;40:658–674. doi: 10.1107/S0021889807021206. [DOI] [PMC free article] [PubMed] [Google Scholar]
- Ninnis RL, Spall SK, Talbo GH, Truscott KN, Dougan DA. Modification of PATase by L/F-transferase generates a ClpS-dependent N-end rule substrate in Escherichia coli. Embo J. 2009;28:1732–1744. doi: 10.1038/emboj.2009.134. [DOI] [PMC free article] [PubMed] [Google Scholar]
- Piatkov KI, Brower CS, Varshavsky A. The N-end rule pathway counteracts cell death by destroying proapoptotic protein fragments. PNAS. 2012;109:E1839–E1847. doi: 10.1073/pnas.1207786109. [DOI] [PMC free article] [PubMed] [Google Scholar]
- Rao H, Uhlmann F, Nasmyth K, Varshavsky A. Degradation of a cohesin subunit by the N-end rule pathway is essential for chromosome stability. Nature. 2001;410:955–959. doi: 10.1038/35073627. [DOI] [PubMed] [Google Scholar]
- Rivera-Rivera I, Roman-Hernandez G, Sauer RT, Baker TA. Remodeling of a delivery complex allows ClpS-mediated degradation of N-degron substrates. PNAS. 2014;111:E3853–E3859. doi: 10.1073/pnas.1414933111. [DOI] [PMC free article] [PubMed] [Google Scholar]
- Román-Hernández G, Grant RA, Sauer RT, Baker TA. Molecular basis of substrate selection by the N-end rule adaptor protein ClpS. Proc Natl Acad Sci USa. 2009;106:8888–8893. doi: 10.1073/pnas.0903614106. [DOI] [PMC free article] [PubMed] [Google Scholar]
- Román-Hernández G, Hou JY, Grant RA, Sauer RT, Baker TA. The ClpS Adaptor Mediates Staged Delivery of N-End Rule Substrates to the AAA+ ClpAP Protease. Molecular Cell. 2011;43:217–228. doi: 10.1016/j.molcel.2011.06.009. [DOI] [PMC free article] [PubMed] [Google Scholar]
- Sauer RT, Baker TA. AAA+ Proteases: ATP-Fueled Machines of Protein Destruction. Annu Rev Biochem. 2011;80:587–612. doi: 10.1146/annurev-biochem-060408-172623. [DOI] [PubMed] [Google Scholar]
- Sauer RT, Bolon DN, Burton BM, Burton RE, Flynn JM, Grant RA, Hersch GL, Joshi SA, Kenniston JA, Levchenko I, et al. Sculpting the proteome with AAA(+) proteases and disassembly machines. Cell. 2004;119:9–18. doi: 10.1016/j.cell.2004.09.020. [DOI] [PMC free article] [PubMed] [Google Scholar]
- Schmidt R, Zahn R, Bukau B, Mogk A. ClpS is the recognition component for Escherichia coli substrates of the N-end rule degradation pathway. Molecular Microbiology. 2009;72:506–517. doi: 10.1111/j.1365-2958.2009.06666.x. [DOI] [PubMed] [Google Scholar]
- Schuenemann VJ, Kralik SM, Albrecht R, Spall SK, Truscott KN, Dougan DA, Zeth K. Structural basis of N-end rule substrate recognition in Escherichia coli by the ClpAP adaptor protein ClpS. EMBO Rep. 2009;10:508–514. doi: 10.1038/embor.2009.62. [DOI] [PMC free article] [PubMed] [Google Scholar]
- Sievers F, Wilm A, Dineen D, Gibson TJ, Karplus K, Li W, Lopez R, McWilliam H, Remmert M, Soding J, et al. Fast, scalable generation of high-quality protein multiple sequence alignments using Clustal Omega. Molecular Systems Biology. 2011;7:539–539. doi: 10.1038/msb.2011.75. [DOI] [PMC free article] [PubMed] [Google Scholar]
- Tobias JW, Shrader TE, Rocap G, Varshavsky A. The N-end rule in bacteria. Science. 1991;254:1374–1377. doi: 10.1126/science.1962196. [DOI] [PubMed] [Google Scholar]
- Varshavsky A. The N-end rule pathway and regulation by proteolysis. Protein Sci. 2011;20:1298–1345. doi: 10.1002/pro.666. [DOI] [PMC free article] [PubMed] [Google Scholar]
- Wang KH, Oakes ESC, Sauer RT, Baker TA. Tuning the strength of a bacterial N-end rule degradation signal. J Biol Chem. 2008a;283:24600–24607. doi: 10.1074/jbc.M802213200. [DOI] [PMC free article] [PubMed] [Google Scholar]
- Wang KH, Román-Hernández G, Grant RA, Sauer RT, Baker TA. The molecular basis of N-end rule recognition. Molecular Cell. 2008b;32:406–414. doi: 10.1016/j.molcel.2008.08.032. [DOI] [PMC free article] [PubMed] [Google Scholar]
- Waterhouse AM, Procter JB, Martin DMA, Clamp M, Barton GJ. Jalview Version 2--a multiple sequence alignment editor and analysis workbench. Bioinformatics. 2009;25:1189–1191. doi: 10.1093/bioinformatics/btp033. [DOI] [PMC free article] [PubMed] [Google Scholar]
- Weber-Ban EU, Reid BG, Miranker AD, Horwich AL. Global unfolding of a substrate protein by the Hsp100 chaperone ClpA : Article : Nature. Nature. 1999;401:90–93. doi: 10.1038/43481. [DOI] [PubMed] [Google Scholar]
- Zeth K, Ravelli RB, Paal K, Cusack S, Bukau B, Dougan DA. Structural analysis of the adaptor protein ClpS in complex with the N-terminal domain of ClpA. Nat Struct Biol. 2002;9:906–911. doi: 10.1038/nsb869. [DOI] [PubMed] [Google Scholar]
Associated Data
This section collects any data citations, data availability statements, or supplementary materials included in this article.